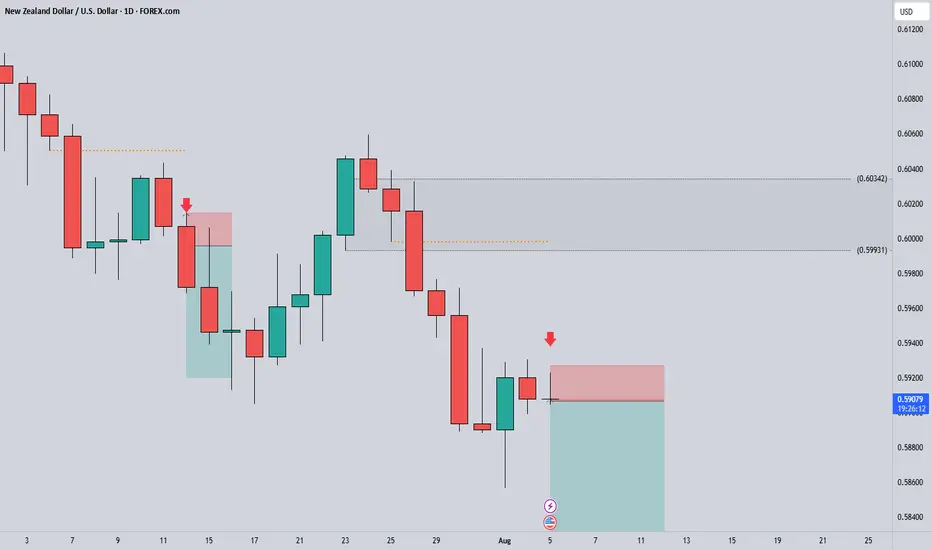
NZDUSD Short ProjectHi guys...😎
It's time to do a Short Project on NZDUSD with 3 key reasons:
1. Price Drivers: institutional shorting
2. Trend: down
3. Momentum: bearish
Action: waiting for entry on the intraday timeframe (entry will be published further)
Beyond Technical Analysis
GBPUSD DAILY ANALYSISOn the daily timeframe, GU is currently bearish but right now, it is retracing to a bearish FVG, and i think it wants to complete a 50% fib retracement level before it continues to the downside.
i am expecting my first point of engagement with the market shorts to be at level 1.33662, if that level fails, i will try shorting at 1.34533 and at 1.35308...

Next Volatility Period: Around August 13th (August 12th-14th)
Hello, fellow traders!
Follow us to get the latest information quickly.
Have a great day!
-------------------------------------
(USDT 12M Chart)
A lot of money has been flowing into the coin market through USDT.
A decline in USDT indicates capital outflow from the coin market.
(USDT.D 12M chart)
As USDT continues to rise, its dominance naturally rises.
However, if USDT is used to purchase coins (tokens) in the coin market, its dominance will decline.
USDT dominance peaked in 2022 and is showing a downward trend.
This indicates that a significant amount of capital flowing into the coin market was used to purchase coins (tokens).
USDT dominance is expected to fall to around 2.84 this year before beginning an upward trend, marking the end of its three-year bull market.
I believe this trend will inject new vitality into the coin market.
For the coin market to maintain an upward trend, USDT dominance must remain below 4.91 or show a downward trend.
If this fails and the price rises above 4.91, the coin market is likely already in a downward trend.
A decline occurred on May 8, 2025, creating a reverse trend.
To maintain this reverse trend, we need to see if it can fall below 4.24.
If USDT dominance declines, the coin market is likely to show an upward trend.
------------------------------------------------------
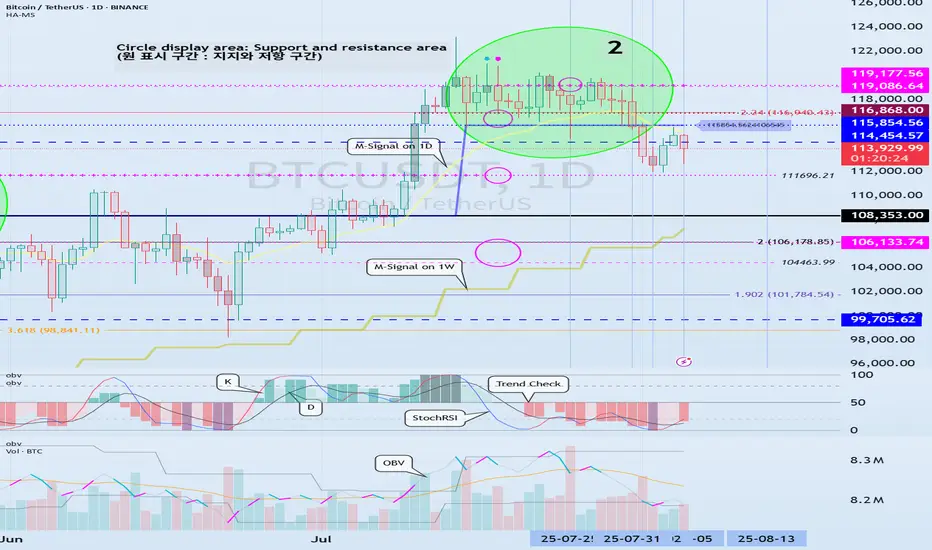
(BTCUSDT 1D chart)
As the new week begins, the HA-High indicator on the 1W chart is showing signs of forming a new level at 114454.57.
Accordingly, the key question is whether the price can rise after finding support in the 114454.57-115854.56 range.
The formation of the HA-High indicator means that the price has fallen from its high.
This also means that further declines are highly likely.
Therefore, if possible, the price should rise above the 114454.57-115854.56 range and maintain its upward momentum.
This period of volatility is expected to last until August 6th.
Therefore, the key question is whether the price can rise above the 114454.57-115854.56 range after the volatility period.
If not, we assume the price will decline until it meets the HA-Low indicator and consider countermeasures accordingly.
This is because the HA-Low and HA-High indicators are paired.
As the price declines, indicators such as the HA-Low or DOM(-60) may appear.
Therefore, if the price declines, you should monitor for the emergence of indicators such as the HA-Low or DOM(-60).
The basic trading strategy is to buy between the DOM(-60) and HA-Low ranges and sell between the HA-High and DOM(60) ranges.
-
If the price falls below the M-Signal indicator on the 1D chart, it is highly likely that the trend will be re-established upon meeting the M-Signal indicator on the 1W chart.
Therefore, if the price fails to rise to the 114454.57-115854.56 range, it is highly likely that the price will eventually meet the M-Signal indicator on the 1W chart.
At this time, a key support and resistance level is expected to be around 108353.0.
When new support and resistance levels are formed, they must remain horizontal for at least three candlesticks to function as support and resistance.
In other words, the HA-High indicator on the 1W chart is showing signs of forming, but it hasn't yet.
Therefore, if the current price holds this week, it will form next week.
Therefore, for the HA-High indicator to function properly as support and resistance, it must remain horizontal for three candlesticks, or three weeks.
This rule must be acquired through significant time and observation.
-
If you sold partially in the 115854.56-119177.56 range according to your basic trading strategy, you will find it easier to observe the current movement. If not, you will likely become anxious.
The key to trading is maintaining a stable psychological state.
If you begin to feel anxious, you should consider how to stabilize your psychological state.
Otherwise, you'll end up making the wrong trades.
-
Thank you for reading to the end.
I wish you successful trading.
--------------------------------------------------
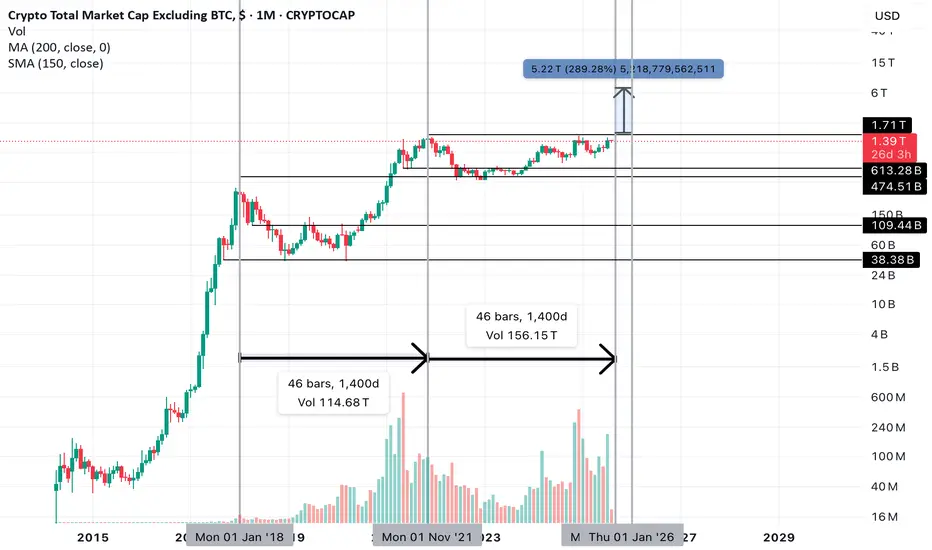
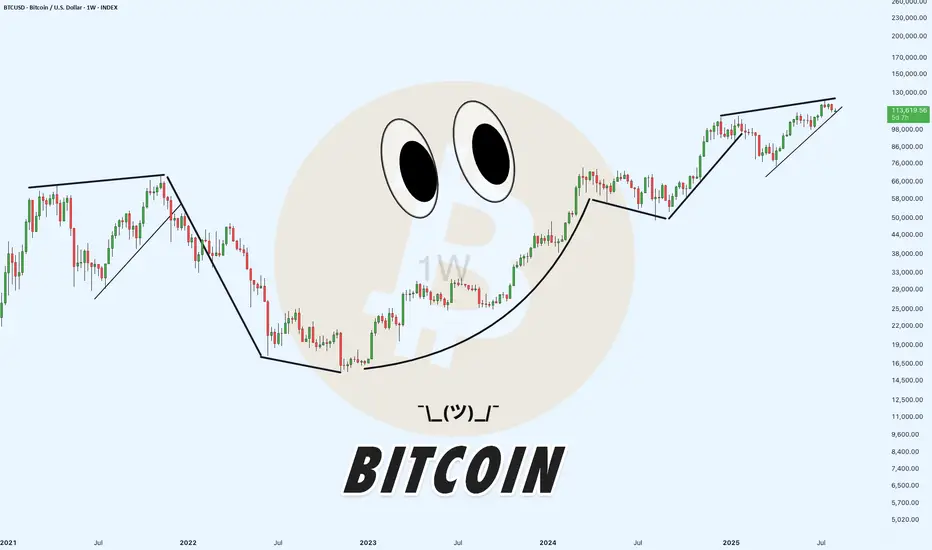
- Here's an explanation of the big picture.
(3-year bull market, 1-year bear market pattern)
I'll explain more in detail when the bear market begins.
------------------------------------------------------
Alt Season? Buy dips, then run it turbo. 1400 days...? Then up. It took exactly 1400 days from the previous all time high (ATH) set in alts (excluding BTC) in early Jan 2018 to break that level again in 2021 to form our current all time high resistance.
Alts have tapped the ATH set in 2021 3-4 times. And it will be 1400 days since the last all time high on September 1st.
Why do you think this time will be different?
I don't control the tape, but I trade it.
August maybe soft, but you'll remember this September and we'll be in funky town james brown price discovery before you know it. Just dont blow it. Buy liquidations and what's going up. By early Jan you'll be the man.

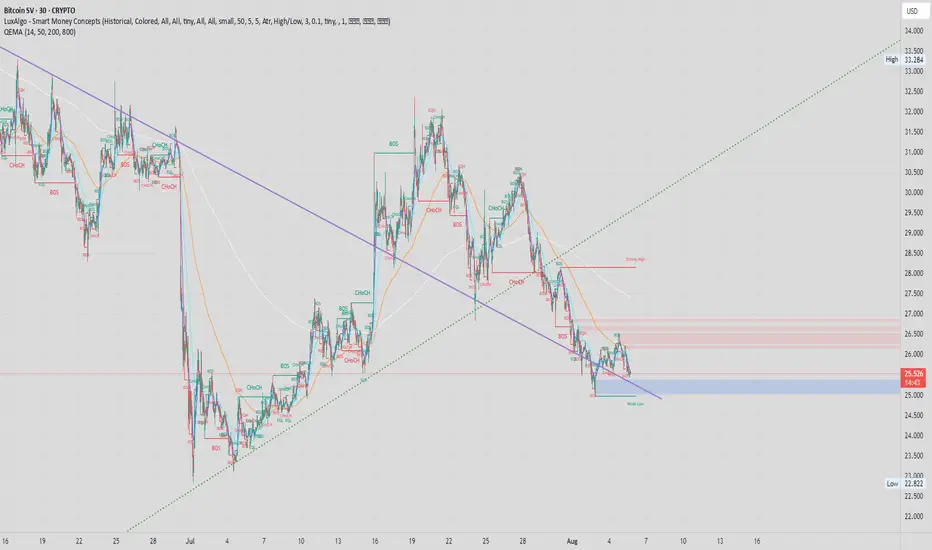
Stop screenshotting and Publishing on X.So many People in the BSV community publish charts on X. Stop. Publish here. Make the token TREND. Here. ok. Your Welcome. Here is my chart. I haven't updated it in a while but i'll post it anyways and you should be able to view my findings.
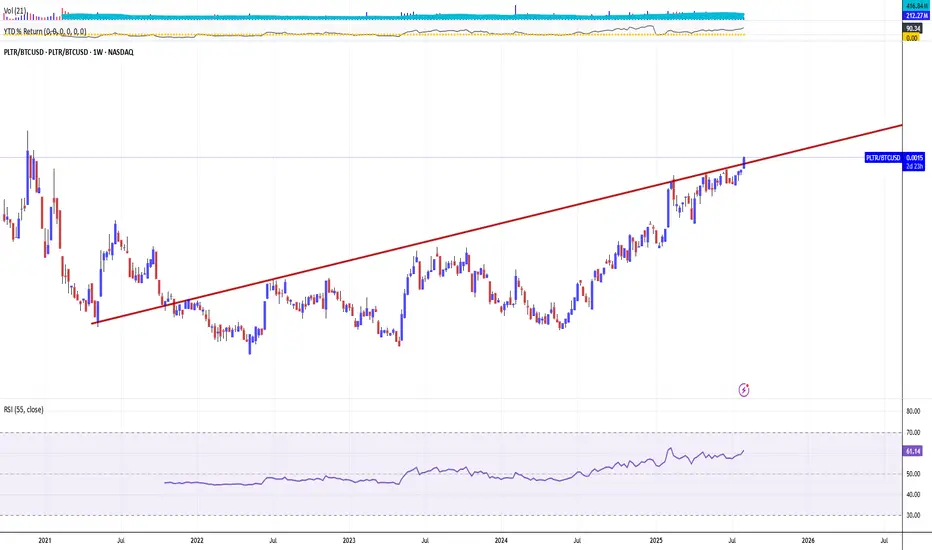
PALANTIR GOES 'BOMBASTIC', DETHRONES JUGGER BITCOIN SUPERIORITYIt's gone less than a year or so since Palantir stock has joined on Friday, September 20, 2024 Stock Top Club, also known as S&P 500 stock index SPX .
Palantir was one of the strongest contenders for inclusion in the broad market S&P500 Index.
This inclusion, as well as Dell (DELL), came after tech companies Super Micro (SMCI) and Crowdstrike (CRWD) also joined the index earlier in the year 2024.
Since that, Palantir stock became the best (i.e. #1) S&P500 index performer the year 2024 and even in nowadays this Jugger remains 'The Best of The Best' over the whole S&P 500 index, with current +127% YTD return in 2025 (and +697% over the past 12 months), being highlighted at 173.29 USD per share - the new all the history peak reached last Wednesday, August 05, 2025 at regular session close.
What is most important also, nor Federal Reserve (The US Central Bank) hawkish projections on monetary policy in 2025, nor bearish were not able to stop the only game in the city, or even make a pause on Palantir leadership.
Since Palantir stock is rallying, the stalkers remain decently far away, swallowing the galactic dust of Palantir shares.
Judge for yourself.
All the nearest pursuers in 2025 are still under 100% YTD return while Bitcoin BITSTAMP:BTCUSD is traded with modest +21% YTD return in 2025.
What is most important also, Palantir stock was able to outperform S&P500 index within 12 (twelve) straight month in a row.
In human words that means, Palantir stock monthly returns (every single month from June 2024 to May 2025) were better against broad market index.
What is Behind this?
On August 4, 2025 Palantir Technologies has announced financial results for the second quarter ended June 30, 2025.
Palantir reported revenue ahead of Wall Street’s expectations in Q2 CY2025, with sales up 48% year on year to $1.00 billion. On top of that, next quarter’s revenue guidance ($1.09 billion at the midpoint) was surprisingly good and 10.5% above what analysts were expecting. Its non-GAAP profit of $0.16 per share was 15.6% above analysts’ consensus estimates.
“The growth rate of our business has accelerated radically, after years of investment on our part and derision by some. The skeptics are admittedly fewer now, having been defanged and bent into a kind of submission. Yet we see no reason to pause, to relent, here.
It has been a steep and upward climb—an ascent that is a reflection of the remarkable confluence of the arrival of language models, the chips necessary to power them, and our software infrastructure, one that allows organizations to tether the power of artificial intelligence to objects and relationships in the real world,” said Alexander C. Karp, Co-Founder and Chief Executive Officer of Palantir Technologies Inc.
Palantir stock Alpha
What is Alpha?
Alpha (a) is a term used in investing to describe an investment's ability to beat (outperform) the market, or its “edge.” Alpha is thus also often referred to as excess return or the abnormal rate of return in relation to a benchmark, or any other asset (even against simple sitting in a cash) when adjusted for risk.
The main graph represents a comparison across Bitcoin and Palantir stocks. Since Palantir outperforms BTC and accelerate right now, so why isn't to continue the play, by staying in a long with Palantir, and finally dethrone "the new oranges" respectively.
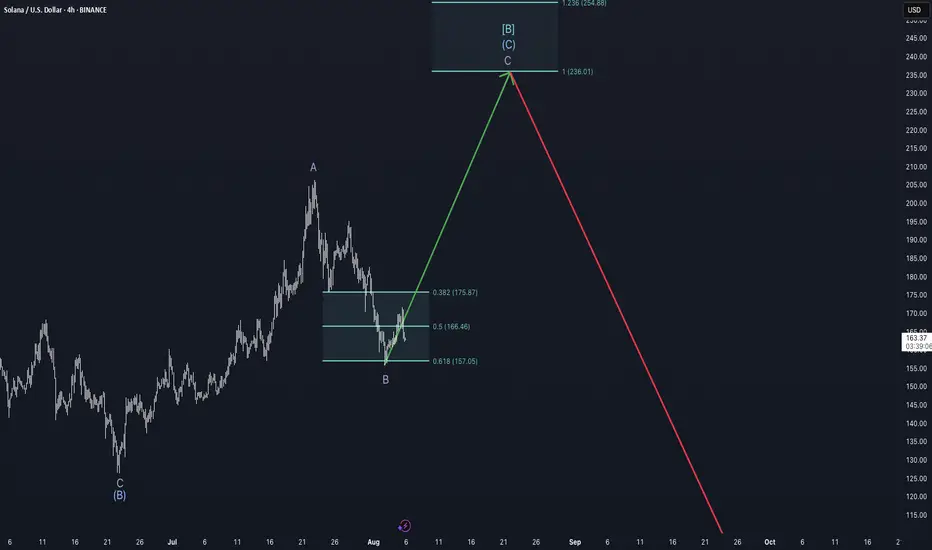
Bulls will be disappointed - Weekly Update August 5-11thSolana appears to be in the final leg of a complex corrective structure. According to the current Elliott Wave count, the larger cycle degree is unfolding in a downward wave c, while the primary degree is in an upward wave B, subdividing into intermediate wave C, which itself is in minor wave C—now developing.
The corrective decline from the July high has retraced toward the 0.618 Fibonacci retracement level (~$157) of the prior move, marking a typical zone for the end of Wave B within a flat or zig-zag formation. From this low, Solana has begun to push higher, indicating the likely beginning of Wave C to the upside. Based on Fibonacci extensions, the potential target zone for this move lies between $236 (1.0 extension) and $254 (1.236 extension).
From a market structure perspective, funding rates across major perpetual futures markets for SOL remain slightly negative or neutral, indicating that the majority of traders are not aggressively long at this stage. This often provides a more stable environment for an upward move, as it suggests the absence of overcrowded long positions that could lead to sharp liquidations. For reference, data from Velo (as of August 5) shows funding on Binance SOLUSDT Perpetual at 6.07%, confirming this neutral-to-slightly-bearish bias in funding.
Additionally, open interest has been neutral since the local low around $157. This is visible on futures data platforms such as Velo.xyz.
However, the liquidity heatmap does not currently support a strong magnet effect toward the $236–$254 zone. There is no significant cluster of stop liquidity or resting orders above $230 that would attract price purely through liquidation mechanics. In contrast, notable liquidity still resides below current levels, making the setup more technically driven than structurally supported by liquidity.
Given these conditions, the case for a C-wave rally remains technically intact, but traders should be cautious: the absence of upper-side liquidity and the corrective macro context imply that this move, even if successful, is likely a countertrend rally within a broader bearish cycle structure.
In conclusion, as long as price holds above the $157–$166 support zone and maintains impulsive structure on lower timeframes, the outlook remains short- to mid-term bullish toward the $236–$254 area. Yet, any breakdown below $157 would invalidate this wave count and suggest that Cycle Wave c may already be resuming to the downside.
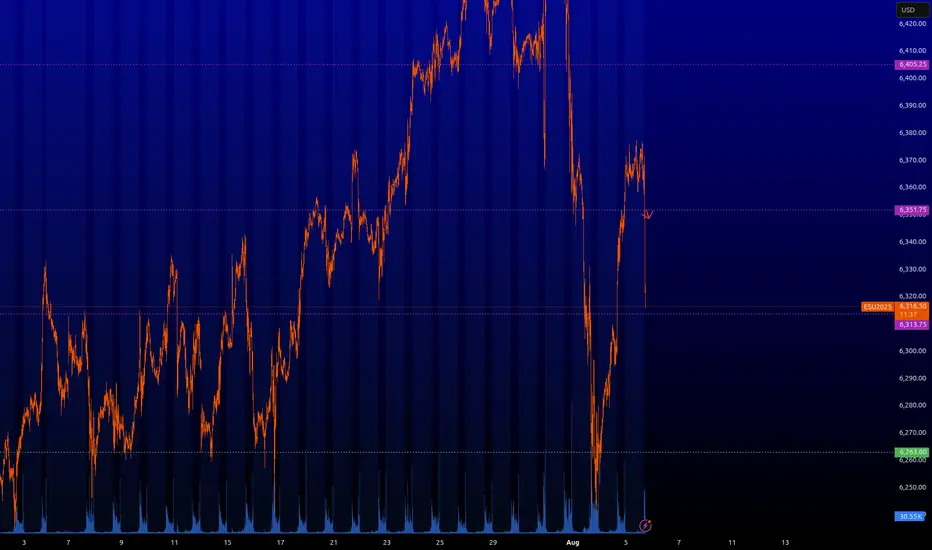
ES : Short levelThe level has been activated, so you can short it. I have slightly edited it since last time. It is best to scalp or pip it; I cannot promise any significant movement. Be careful when trading on news or at market close/open.
gold on sell#XAUUSD price third range have been broken, now we wait for reverse below 3355.
Sell from 3375-3373 on H1 closure, target 3355, SL 3384
If price touch 3371 and reverse back close, bullish range between.

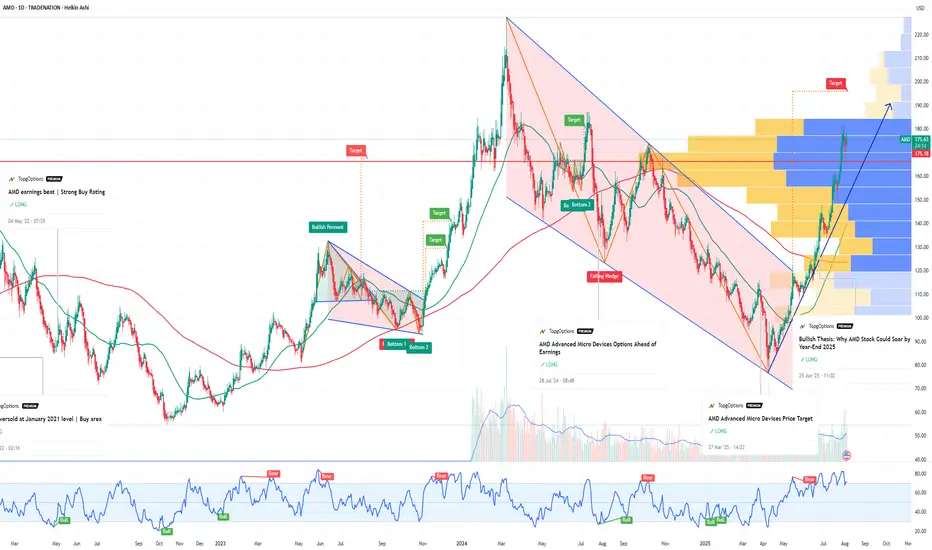
AMD Advanced Micro Devices Options Ahead of EarningsIf you haven`t bought AMD before the previous earnings:
Now analyzing the options chain and the chart patterns of AMD Advanced Micro Devices prior to the earnings report this week,
I would consider purchasing the 220usd strike price Calls with
an expiration date of 2026-9-18,
for a premium of approximately $22.15.
If these options prove to be profitable prior to the earnings release, I would sell at least half of them.
Disclosure: I am part of Trade Nation's Influencer program and receive a monthly fee for using their TradingView charts in my analysis.
RIVN Rivian Automotive Options Ahead of EarningsIf you haven`t bought RIVN before the previous earnings:
Now analyzing the options chain and the chart patterns of RIVN Rivian Automotive prior to the earnings report this week,
I would consider purchasing the 10usd strike price Puts with
an expiration date of 2025-10-17,
for a premium of approximately $0.39.
If these options prove to be profitable prior to the earnings release, I would sell at least half of them.
Disclosure: I am part of Trade Nation's Influencer program and receive a monthly fee for using their TradingView charts in my analysis.

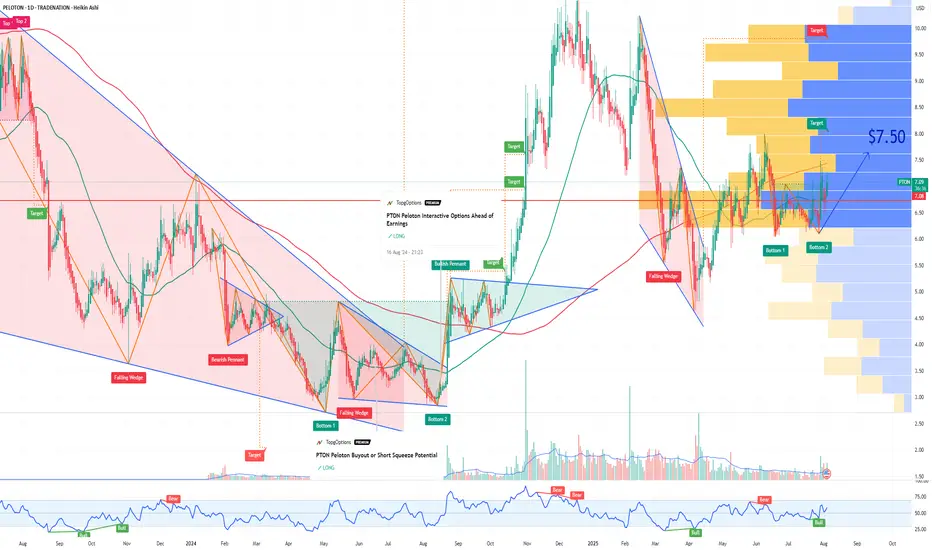
PTON Peloton Interactive Options Ahead of EarningsIf you haven`t bought the dip on PTON:
Now analyzing the options chain and the chart patterns of PTON Peloton Interactive prior to the earnings report this week,
I would consider purchasing the 7.50usd strike price Calls with
an expiration date of 2025-8-8,
for a premium of approximately $0.46.
If these options prove to be profitable prior to the earnings release, I would sell at least half of them.
Disclosure: I am part of Trade Nation's Influencer program and receive a monthly fee for using their TradingView charts in my analysis.
PINS Pinterest Options Ahead of EarningsIf you haven`t bought PINS before the previous earnings:
Now analyzing the options chain and the chart patterns of PINS Pinterest prior to the earnings report this week,
I would consider purchasing the 39usd strike price Calls with
an expiration date of 2025-8-8,
for a premium of approximately $2.22.
If these options prove to be profitable prior to the earnings release, I would sell at least half of them.

Bear trap on its way - Bitcoin Weekly Update August 4-10thThis week brings a series of macroeconomic and geopolitical developments that may influence global risk sentiment and, consequently, Bitcoin’s price trajectory.
On Monday, the U.S. releases Factory Orders, a key indicator of industrial demand. Surprises in this data can affect risk assets broadly, as they reflect business investment activity. Weak numbers would likely increase expectations of monetary easing, which tends to support Bitcoin.
On Tuesday, the spotlight turns to the ISM Non-Manufacturing PMI, a leading indicator for the U.S. services sector, which accounts for roughly 70% of GDP. A significant deviation from expectations—especially a decline—could reinforce rate-cut expectations and provide tailwinds for speculative assets like Bitcoin.
Thursday is a critical day, with the Bank of England's interest rate decision in focus. While direct effects on crypto are limited, a hawkish stance could weigh on global risk appetite if inflation concerns resurface. Also on Thursday, the U.S. releases its weekly Initial Jobless Claims—a timely barometer of labor market strength. A rising trend here would suggest economic cooling, strengthening the case for looser policy and potentially benefiting crypto.
However, the most geopolitically sensitive event this week is the reintroduction of country-specific reciprocal tariffs by the United States, taking effect on August 7. Affected countries include Canada (35%), Mexico (30%), and Brazil (50%). These measures could re-escalate trade tensions and trigger short-term market volatility. Retaliatory responses from these countries would likely fuel risk-off sentiment, pressuring assets across the board.
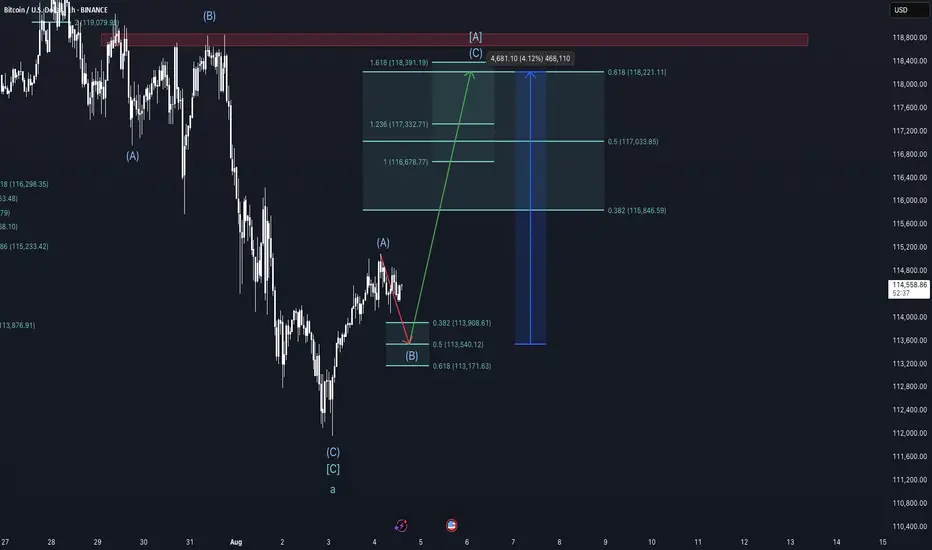
From a technical standpoint, Bitcoin remains within a multi-degree corrective structure according to the Elliott Wave framework. On the cycle degree, we are in a B-wave; on the primary degree, in an A-wave; on the intermediate degree, in a B-wave; and on the minor degree, in a C-wave. This implies that a short-term move lower is still expected, but once complete, a relief rally of approximately 4% could follow before the onset of a larger correction, likely Primary Wave B.
Chart structure suggests that Minor Wave C is in its late stages. Early signs of exhaustion, such as waning downside momentum or bullish reaction at key support zones, could offer clues of an approaching bottom. However, such a rebound should be viewed as temporary and not a trend reversal.
Taking a view between the lines on the on-chain data, the liquidity heatmap shows major liquidity around the red rectangle drawn into the chart, suggesting higher prices. Also, the rather low funding rate on futures suggest an exhausted downward trend and a trend reversal in the near future is likely.
Conclusion:
This week’s calendar offers several macroeconomic catalysts with the potential to move markets. U.S. economic data and tariff policy developments will likely shape near-term sentiment. Technically, Bitcoin remains in a corrective phase with limited downside left before a short-term recovery becomes more probable. Traders should stay alert for signs of a local bottom to position for a tactical bounce—but be cautious, as a larger correction likely looms beyond that.
This is no financial advice and for educational purposes only.
Possible run to 130 in the cardsEasily invalidated.
We are using the patterns from the price action post threshold break (redline in bottom pane)
These breaks are unseen on this time frame
The volume instabilities are between the 15 minute and the 1 hour. I would look for breaks under 15 minutes, too much noise at that level. Go ahead and test it yourself. See my script posted on trading view for details.

Calm Before a StormSince the post-COVID period, we have not seen such a gentle and continuous uptrend. This phenomenon reminds me of the market before the COVID meltdown.
How do I going to interpret this "Gentle & Continuous Uptrend" move?
My answer: Cautiously bullish
Back then, market was cautiously bullish because COVID seemed to be contagious.
It has triggered.
Now, market is cautiously bullish because tariffs appear to be deepening inflation. With slowing job numbers, this is becoming a bigger concern.
Will it trigger?
Mirco Nasdaq Futures and Options
Ticker: MNQ
Minimum fluctuation:
0.25 index points = $0.50
Disclaimer:
• What presented here is not a recommendation, please consult your licensed broker.
• Our mission is to create lateral thinking skills for every investor and trader, knowing when to take a calculated risk with market uncertainty and a bolder risk when opportunity arises.
CME Real-time Market Data help identify trading set-ups in real-time and express my market views. If you have futures in your trading portfolio, you can check out on CME Group data plans available that suit your trading needs www.tradingview.com

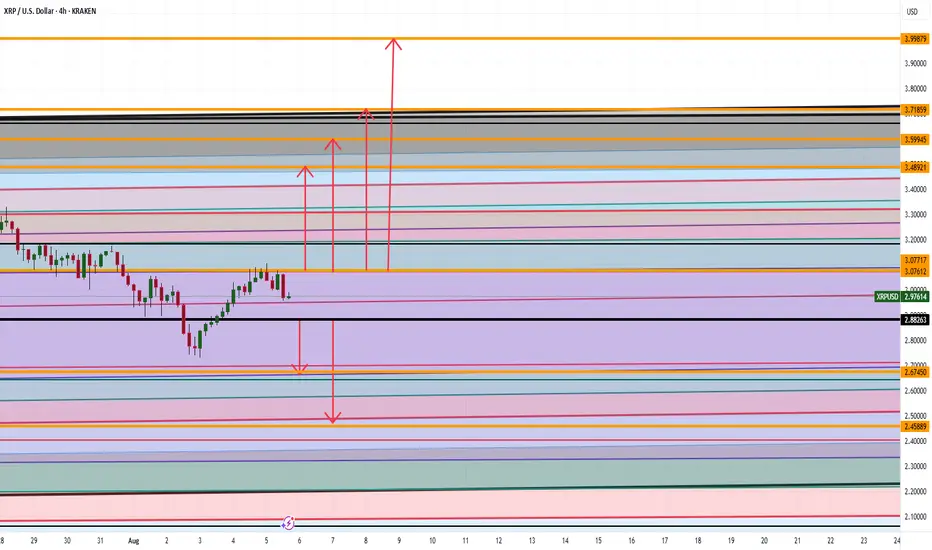
XRP ARE WE GOING TO $4 ANALYSIS Good afternoon
So looking at XRP we can spot a couple things :
Bullish Side: If we can break the high at 3.07 then 3.48,3.59,3.71, and 3.99 makes sense
Bearish Side: If we go below 2.88 then a drop down to 2.67 then 2.45 makes sense
Trade Smarter Live Better
Kris
TSLA Don't Miss Out
### 🔥 TradingView Viral Post Format 🔥
---
### 📢 **Title:**
**TSLA Options Surge? \$330 Call Could Double in 3 Days — Here's the Setup** 🚀📈
---
### 📝 **Description:**
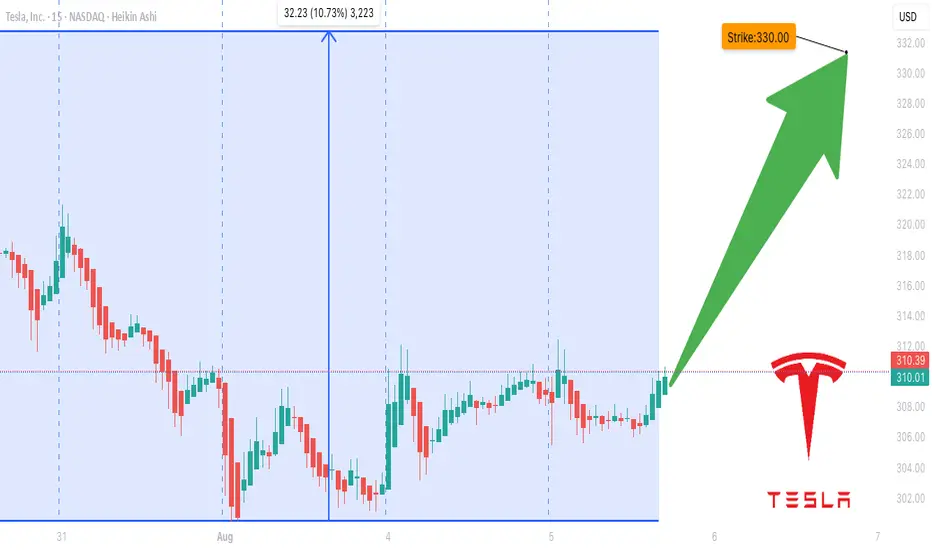
Tesla’s options market is flashing **moderate bullish signals** this week! 📊
✔️ Call/Put Ratio: **1.39** (Bullish)
✔️ RSI (Daily & Weekly): **Rising**
⚠️ Volume is light, but sentiment leans bullish.
🎯 **Trade Idea:**
Buy TSLA \$330 Call (Exp: Aug 8)
💰 Entry: \$0.85
🎯 Target: \$1.70
🛑 Stop: \$0.43
⏱️ Confidence: 65%
⚡ Gamma risk rising with time decay — tight execution is key.
Is this the breakout or a bull trap? Let’s watch it play out 👀
👇 Drop your thoughts or setups in the comments!
---
### 🏷️ **Tags (for TradingView):**
```
#TSLA #Tesla #OptionsTrading #CallOptions #BullishSetup #TSLAOptions #StockMarket #WeeklySetup #TradingStrategy #TechnicalAnalysis #TradeIdea #MomentumTrade #UnusualOptionsActivity #TradingView
LTC Adoption CurveThere was adoptions like this: TV, color TV, refrigerator, phone, mobile phone, pc. Now it's time for crypto. It's 7% today, summer 2025.

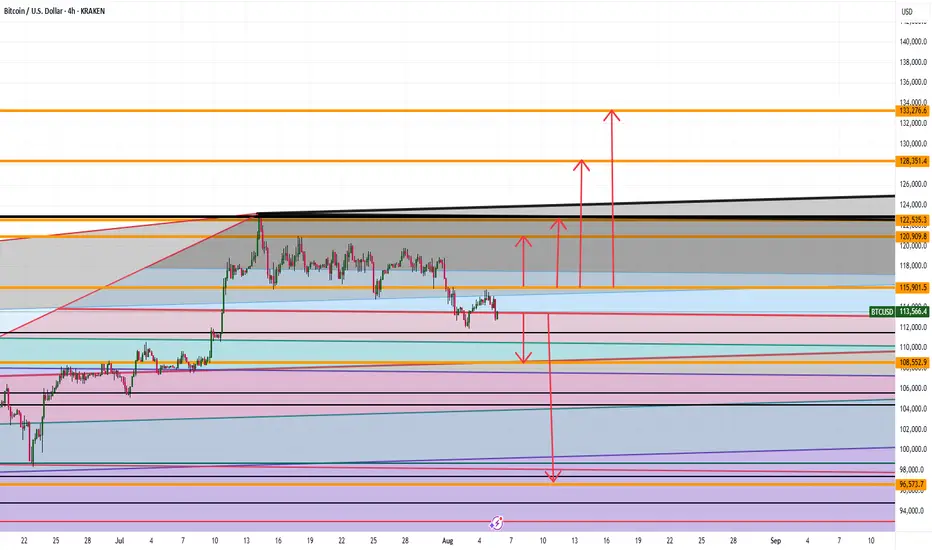
BTC Full Analysis WHERE ARE WE HEADING ???Good afternoon
SO currently with BTC we see the following:
Bullish:
If we can stay and hold above 115,900 then 120K, 122K, 128K and 133K makes sense
BEARISH:
If we close and hold under 113K levels then we can see 108, and 96K levels being hit
What do you think ? Comment Below
Trade Smarter Live Better
Kris

USD CAD Where Are We Heading DEEP ANALYSIS Hi Trading Fam
So with USD CAD this is what we are seeing:
Bearish:
If we stay under 1.38 then a drop down to the 1.37 range
Bullish:
If we can close above the high at 1.38 then we have levels of 1.3840 , and 1.3980 that could be hit
Trade Smarter Live Better
Kris
