USDCADOANDA:USDCAD price overall is bullish but since there's no liquidity above after that distribution we're most likely to see a sell. But anything can happen we'll see it goes but you guys do let me know what you think on the comment session 💯🤔 your ideas matter to me.
Beyond Technical Analysis

Further downside for GBPUSDGBPUSD broke the ascending price channel on the daily chart and currently I do not see any opportunity to enter the long position because after this break the pair will head to the order flow area of 1.29990 from which the price may rebound or deal with it as a retracement zone

Gold Extends Gains as USD Weakens📊 Market Overview:
Gold prices are extending their gains during the Asian and European sessions today, as the US dollar weakens following weaker-than-expected US jobs data. Rising unemployment and a softer Non-Farm Payroll report boosted expectations that the Fed may cut interest rates in September. The US 10-year Treasury yield also dipped slightly, supporting gold's safe-haven appeal.
📉 Technical Analysis:
• Key Resistance: $3,385 – $3,390
• Nearest Support: $3,365 – $3,370
• EMA: Price is trading above the EMA 09, indicating a short-term bullish trend
• Candles / Volume / Momentum: H1 candles show steady buying pressure with stable volume, but we should monitor potential profit-taking if price nears the $3,390–$3,400 zone.
📌 Outlook:
Gold may continue to rise in the short term if USD weakness persists and bond yields stay low. However, failure to break above $3,390 could lead to a pullback toward support levels.
💡 Suggested Trading Strategy:
🔺 BUY XAU/USD: $3,365 – $3,368
🎯 TP: 40/80/200 pips
❌ SL: $3,362
🔻 SELL XAU/USD : $3,392 – $3,395 (if reversal signal appears)
🎯 TP: 40/80/200 pips
❌ SL: $3,398

Report - 5 August, 2025EVENT OVERVIEW & MARKET REACTIONS
Global markets are undergoing a seismic recalibration in response to a series of high-impact developments driven by U.S. policy shifts under President Trump’s administration. The introduction of sweeping tariffs—15% on the EU, 39% on Switzerland, and up to 40% on others—has shocked allies and fractured transatlantic trade relations. Key EU states like Germany and France have publicly denounced the deal, calling it a capitulation and a strategic misstep. Markets responded accordingly: the euro posted its second-largest single-day decline of the year, falling 1.1% against the dollar, while European indices such as Germany’s DAX and France’s CAC 40 closed down 1.1% and 0.4% respectively.
Swiss equities saw strong volatility, with the Swiss Market Index falling as much as 1.9% intraday after the shock 39% tariff announcement. The Swiss franc also weakened 0.6% against the dollar, exacerbating investor anxiety. Conversely, Wall Street remained relatively buoyant with the S&P 500 and Nasdaq Composite climbing 1.3% and 1.8% respectively, driven by expectations of Federal Reserve rate cuts following weak U.S. jobs data. Treasury yields fell, with the 10-year note dipping to 4.21% and similar softening seen in German Bunds and UK gilts.
Crude oil markets were rattled by OPEC+'s surprise decision to increase production by 547,000 barrels/day starting September, marking an end to the group’s multi-year strategy of withholding supply. This triggered fears of a renewed oil glut heading into winter, especially as EV market concerns and Chinese demand weakness persist. Brent crude dipped on the announcement, compounding energy sector volatility.
STRATEGIC FORECASTS
Strategically, the trade realignment driven by the U.S. will lead to increased fragmentation in global commerce. Countries caught off-guard by Trump’s tariff decisions, such as Switzerland, India, and Taiwan, are scrambling to re-engage diplomatically. The EU appears divided, with some members pushing for aggressive countermeasures while others—primarily Germany—seek more calibrated solutions such as quotas and “offset” schemes. Trump’s approach—demanding investment pledges or unilateral concessions—risks a broader breakdown in multilateral trade norms.
We expect increased geopolitical volatility around U.S.-China relations as well. Trump has paused tech export restrictions to China in an attempt to secure a summit with Xi Jinping, temporarily soothing market nerves. However, this has sparked bipartisan backlash within the U.S. security apparatus. As a result, sectors like AI chips, semiconductors, and rare earths are now high-risk zones for both investors and policymakers.
In parallel, Tesla’s $16.5bn AI chip deal with Samsung marks a critical milestone in global tech supply chains, potentially boosting South Korea’s strategic relevance while challenging Taiwan’s TSMC dominance. This also serves as a confidence signal to global markets despite Musk’s ongoing litigation over a $56bn pay award and his volatile relationship with Trump.
FISCAL AND POLITICAL IMPLICATIONS
The tariffs are already triggering fiscal consequences. The Yale Budget Lab estimates U.S. tariffs will reduce disposable income for the bottom 10% of households by 3%, compared to 1% for the top decile. Trump's "One Big, Beautiful Bill" tax plan is exacerbating income inequality, favoring higher-income earners with $12,000/year increases versus a $1,600 hit to the poorest households.
Politically, there is growing unrest both in the U.S. and abroad. Trump’s sacking of the head of the Bureau of Labor Statistics has raised alarms about institutional independence. Germany's finance minister has openly criticized these actions, calling them a breach of democratic norms. Meanwhile, OPEC+'s decision to abandon supply cuts reflects internal cartel tensions and shifting alliances, particularly as U.S., Canadian, and Brazilian production continues to rise.
In the EU, far-right parties are seizing on the trade deal to criticize institutional weakness, while Switzerland faces internal political turmoil after being blindsided by the U.S. tariff rate. Emerging political fractures across the Western alliance could limit coordinated responses to future crises.
RISKS
Tariff Escalation Risk: With tariffs now hitting over 70% of U.S. trade partners, the risk of retaliatory measures remains elevated, particularly from China and the EU.
Institutional Credibility Risk: The politicization of U.S. economic data may erode investor confidence in official statistics, impacting bond and currency markets.
Energy Price Volatility: OPEC+’s return to production growth could overwhelm winter demand and spark a crude oil price collapse if EV adoption outpaces expectations.
Investor Confidence: Emerging market economies, particularly in Southeast Asia, are being caught in the crossfire. New “transshipment” tariffs make offshoring less attractive, compressing corporate margins.
OPPORTUNITIES
Tech Supply Chain Diversification: Samsung’s Tesla contract opens pathways for other U.S. tech firms to reduce reliance on TSMC and hedge geopolitical risk.
Rate-Cut-Driven Equity Rebound: With weak U.S. jobs data fueling Fed dovishness, global equities may benefit in the short term as investors reposition for monetary easing.
European Banks Rebound: European financials continue to outperform U.S. counterparts amid rising net interest margins, creating relative value opportunities.
Energy Exploration Investment: BP’s massive Brazilian discovery signals renewed viability for fossil fuel projects, potentially attracting capital flows back into traditional energy.
ASSET IMPACT OUTLOOK
XAUUSD (Gold)
With rising trade uncertainty, weak U.S. jobs data, and Fed dovishness, gold stands to benefit as a hedge against inflation, geopolitical turmoil, and dollar volatility.
S&P 500
Relieved by Fed dovishness and strong Big Tech earnings, but faces margin compression risks in consumer sectors and potential spillovers from Trump’s policy unpredictability.
USDJPY
Yen has started rebounding slightly, aided by safe-haven flows and a weakening dollar following poor U.S. jobs data. Volatility likely to persist as BOJ policy diverges.
DXY (US Dollar Index)
The dollar's rally has reversed on rate cut expectations and weaker labor prints. Fed's next move is critical—any surprise hawkish tone would re-ignite upside.
Crude Oil (Brent/WTI)
Supply glut fears from OPEC+ hikes, muted Chinese demand, and rising non-OPEC output suggest pressure on crude. Risk of sub-$70 if winter demand fails to materialize.
Dow Jones
Benefiting from rate-cut hopes and strong corporate earnings in financials and tech, but vulnerable to volatility from domestic political interventions and sector rotation.

Nasdaq and S&P500 Short: A multi-factor analysisIn this long video, I go through why I think the equity markets are going to crash in August.
Here are the important points:
1. I talk about the stealth liquidity which is the reverse repo balance being drawn down and almost emptied.
2. The risk-off asset classes rising: Gold, Japanese Yen.
3. The risk-on asset classes falling: Nasdaq, Bitcoin, Ethereum.
Here's my outlook for the markets from now till September FOMC:
1. The equity markets, USDJPY, Bitcoin, and Ethereum will crash.
2. 3-month treasury yield will fall below 4.25% and even below 4%.
3. Fed will cut target rates to be within the 3-month treasury yield.
As usual, good luck in your trading and keep your risks tight!

Sensex long setupSensex long setup
Entry - 80651
Stop loss - 80528.00
Target - 81093
Risk Reward - 1:3.6

GBPUSD SELLGBP/USD holds steady above 1.3250 as investors brace for US ISM Services PMI release
The GBP/USD pair trades on a flat note near 1.3280 during the Asian trading hours on Tuesday. Nonetheless, rising odds of Federal Reserve rate cuts could weigh on the US Dollar against the Cable. Investors will keep an eye on the US ISM Services Purchasing Managers Index data, which is due later on Tuesday.
The broad-based selling pressure surrounding the US Dollar (USD) helped GBP/USD gain traction and allowed the pair to snap a six-day losing streak.
The monthly data published by the US Bureau of Labor Statistics (BLS) showed that Nonfarm Payrolls (NFP) rose by 73,000 in July, missing analysts' estimate of 110,000, while the Unemployment Rate edged higher to 4.2% from 4.1%, as expected. More importantly, the BLS announced that it revised down May and June NFP increases, noting that NFP growth in this two-month period combined was 258,000 lower than previously reported.
The probability of a 25 basis points Federal Reserve (Fed) rate cut in September jumped above 70% from about 30% before the data, as per CME FedWatch Tool. In turn, the USD weakened sharply against its peers.
The economic calendar will not feature any high-tier macroeconomic data releases on Monday. Later in the week, the Bank of England (BoE) will announce monetary policy decisions.
In the meantime, market participants will keep a close eye on US politics. Following the dismal employment report, US President Donald Trump fired BLS Chief Erika McEntarfer, accusing her of manipulating the numbers for political purposes. Additionally, Fed Governor Adriana Kugler, whose term was scheduled to end on January 31, 2026, announced her resignation.
Investors could opt to stay away from the USD in case political developments feed into concerns over the Fed or the BLS losing independence.
SUPPORT 1.32382
SUPPORT 1.31758
SUPPORT 1.32382
RESISTANCE 1.33086
RESISTANCE 1.33375

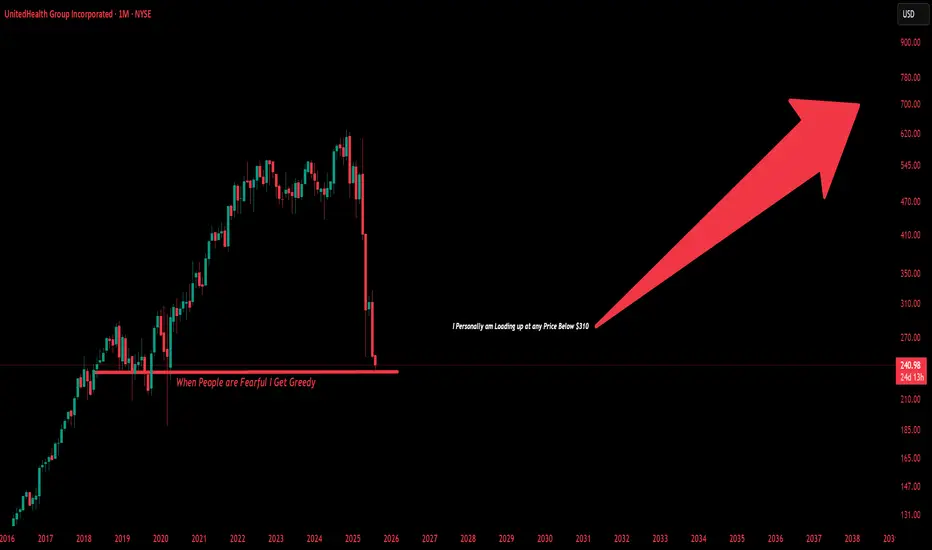
$UNH This Behemoth Is Not Going Anywhere and I am Loading Up United HealthGroup is extremely Appealing to me at these valuations. Health Insurance Is something all people need. I Don't See Medicaid/Medicare Cuts affecting NYSE:UNH To the extent People believe it will. Legislation can be temporary, This Company Produces 20B Plus in Free Cashflow Every single Year Let alone 420B in Revenue its a behemoth controlling more than 30% of American Health Insurance in terms of Market Share. The United States could never afford to socialize Healthcare the way Europe Or Canada does. Social Security/Health/Medicare already eat up 49% Of GDP. The United States is almost dependent on companies Like United Healthgroup to provide its services. This Could almost Give Companies like NYSE:UNH an opportunity to offer plans to gain more customers who before had Government assisted health insurance. While more downside is almost Guaranteed I see nothing more then even better discounts for the long-term. This is not a question of If UNH Can recover its only a question of how long will it take. We are back at Prices Pre Covid-19.
---------------------
Possible Reasons for the Major Drops:
The Big Beautiful Bill
DOJ Lawsuits
Rising Medicare Costs
Rising Expenses on Insurers
Swapped CEO Twice
Swapped CFO Once
Lawsuits
Scandals
---------------------
NYSE:UNH Fundamentals:
Price To Sales: 0.5x
Price To Earnings:10.3x
Price to Book: 2.2x
---------------------
Balance Sheet:
Cash: US$32.02b
Debt: US$104.78b
Total Liabilities: US$203.79b
Total Assets: US$308.57b
---------------------
Management Efficiency:
ROE: 21.1%
ROCE: 15.5%
ROA: 8.2%
---------------------
Dividend Safety:
Dividend Yield: 3.7%
Payout Ratio: 37% of Profits
---------------------
I recently Began Acquiring Shares around the $260 Mark and plan on continuing to load up for the long-term.
---------------------
This is not financial Advice, Just what I am doing on my own as an investor. I do not give Buy/Sell/Hold Signals.
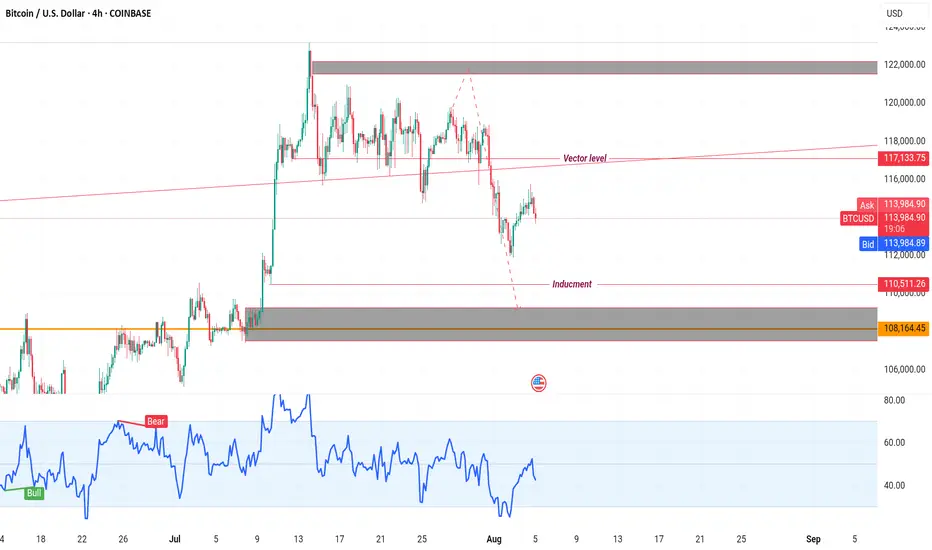
BTC on high time frame
"Hello traders, regarding Bitcoin, as previously mentioned, BTC is in the process of completing its pullback to the 110k zone. Candle formations indicate increasing bearish momentum on higher time frames. In my view, when the price reaches 110k, it will be a crucial point to assess and consider the next potential price level."
If you need further assistance or have more details to discuss, please let me know!
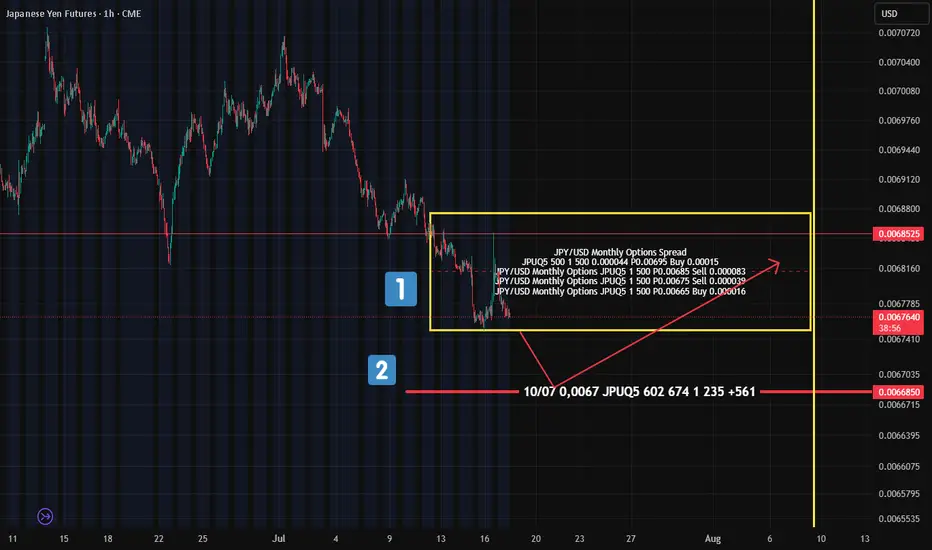
Yen Futures Options: What the "Put Condor" Tells Us About FutureA quick look at the options sentiment on Japanese Yen futures (not spot) — and there’s something interesting on the flow radar.
On July 10 , a "Put Condor" was placed — boundaries marked by the yellow rectangle on the chart (№1).
The goal of this setup? Price should expire within these boundaries — meaning the seller expects limited downside , but still allows for some controlled movement.
What’s notable?
This position was placed before the yen started to weaken — so someone was clearly preparing for this scenario in advance .
Also worth watching:
Further down (№2 on the chart), there’s another cluster of put options at 0.0067 — suggesting this level could act as a support zone if the futures contract drops that low.
📊 Bottom Line:
There are clear signs pointing to continued downside pressure in Yen futures.
The 0.006685 level is key — potential support for a bounce back into the 0.00675–0.00685 range .
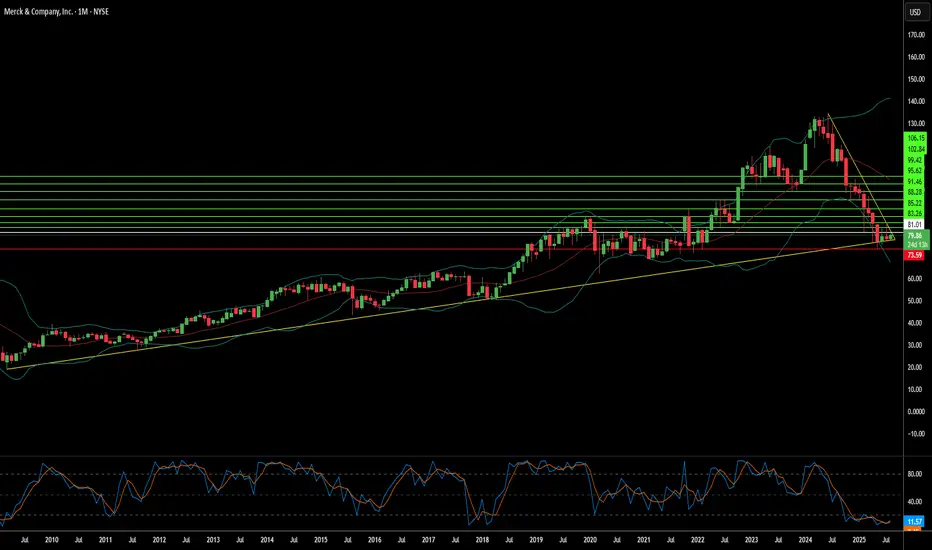
Can Global Chaos Fuel Pharmaceutical Giants?Merck's remarkable growth trajectory demonstrates how a pharmaceutical leader can transform global uncertainties into strategic advantages. The company has masterfully navigated geopolitical tensions, including US-China trade disputes, by diversifying supply chains and establishing regionalized manufacturing networks. Simultaneously, Merck has capitalized on macroeconomic trends such as aging populations and rising chronic disease prevalence, which create sustained demand for pharmaceutical products regardless of economic fluctuations. This strategic positioning allows the company to thrive amid global instability while securing revenue streams through demographic tailwinds.
The foundation of Merck's success lies in its innovation engine, powered by cutting-edge scientific breakthroughs and comprehensive digital transformation. The company's partnership with Moderna for mRNA technology and its continued expansion of Keytruda's indications exemplify its ability to leverage both external collaborations and internal R&D prowess. Merck has strategically integrated artificial intelligence, big data analytics, and advanced manufacturing techniques across its operations, creating a holistic competitive advantage that accelerates drug development, reduces costs, and improves time-to-market efficiency.
Protecting future growth requires fortress-like defenses of intellectual property and cybersecurity assets. Merck employs sophisticated patent lifecycle management strategies, including aggressive biosimilar defense and continuous indication expansions, to extend the commercial life of blockbuster drugs beyond their primary patent expiry. The company's substantial cybersecurity investments safeguard its valuable R&D data and intellectual property from increasingly sophisticated threats, including state-sponsored espionage, thereby ensuring operational continuity and a competitive advantage.
Looking forward, Merck's sustained momentum depends on its ability to maintain this multifaceted approach while adapting to evolving market dynamics. The company's commitment to ESG principles and corporate social responsibility not only attracts socially conscious investors but also helps retain top talent in a competitive landscape. By combining organic innovation with strategic acquisitions, robust IP protection, and proactive risk management, Merck has positioned itself as a resilient leader capable of converting global complexity into sustained pharmaceutical dominance.
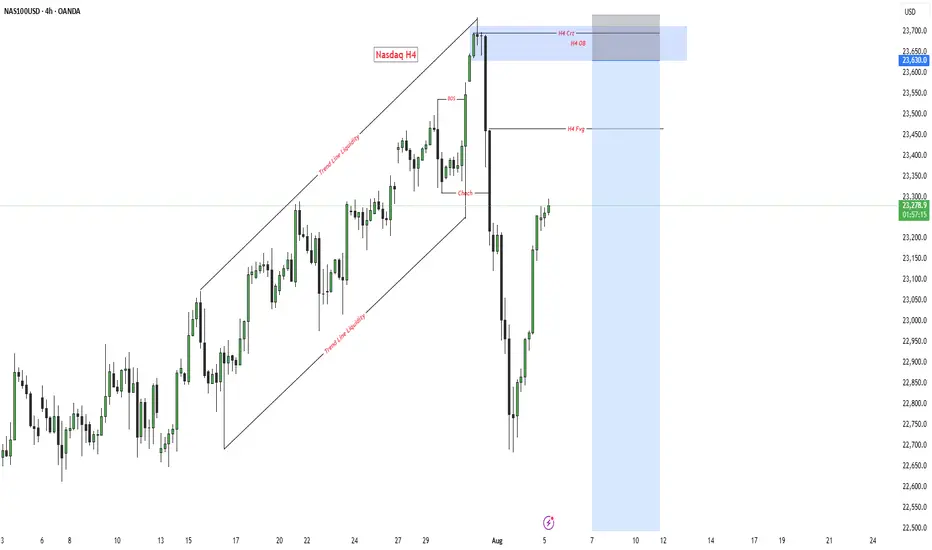
Nasdaq h4✅ NASDAQ H4 – Premium Short Setup
📊 What we are looking at:
✔️ H4 FVG (Fair Value Gap)
✔️ H4 Order Block (OB)
✔️ H4 CRT (Candle Range Theory)
✔️ Trendline Liquidity already taken out
📌 Game Plan:
Price swept trendline liquidity and is now pushing towards H4 FVG.
As soon as it retests the FVG and taps into OB & CRT zone, we’ll look for SELL opportunities from this premium area.
🎯 Target: Next liquidity pool below.
⚠️ Patience = Profit. Wait for confirmation before entry.
🔥 Smart Money never chases – it waits for the market to deliver.
BRENT: OPEC+ Reacts as a New Geopolitical Chapter LoomsIon Jauregui – Analyst at ActivTrades
The oil market is bracing for a new episode of high tension. With Brent stabilizing around $70 per barrel, OPEC+ has made a decisive move: starting in September, it will increase production by 547,000 barrels per day—a decision that could significantly alter the global supply-demand balance. The announcement comes at a critical moment, marked by political pressure, conflicting interests, and an increasingly uncertain geoeconomic backdrop. September 7 is shaping up to be the next major turning point for the market.
Fundamental Analysis
OPEC+’s decision to increase output effectively erases its largest remaining production cut, implemented during the height of the pandemic. The group is not only restoring supply but has also granted the United Arab Emirates an additional quota equivalent to 2.4% of global demand—an internal rebalancing that could create tension within the cartel.
Meanwhile, diplomatic pressure continues to mount. The United States, maintaining a firm stance inherited from the Trump era, keeps urging India and other major consumers to reduce their dependence on Russian oil. This dynamic complicates the outlook for countries that have benefited from discounted Russian crude in recent years and reopens the debate over strategic energy alliances.
The current environment is defined by increasing supply, sustained demand, and growing political pressure on certain trade flows. All these factors suggest a more volatile market, highly sensitive to any disruption in the balance.
Technical Analysis
From a technical perspective, Brent remains stuck in a downward-sloping sideways structure. Prices are fluctuating between key support at $67.50 and strong resistance at $79. Volume has declined in recent sessions, indicating trader caution ahead of upcoming OPEC+ decisions.
A clear breakout above the $72.74 resistance could pave the way for a bullish move toward the next target zone at $75–76, while a drop below $67.50 would activate a corrective scenario targeting the $64–65 area. Both RSI and MACD indicators are showing neutral signals with no clear trend, reinforcing the short-term consolidation outlook.
The next move will largely depend on how events unfold around September 7, a date that could redefine the market balance.
*******************************************************************************************
The information provided does not constitute investment research. The material has not been prepared in accordance with the legal requirements designed to promote the independence of investment research and such should be considered a marketing communication.
All information has been prepared by ActivTrades ("AT"). The information does not contain a record of AT's prices, or an offer of or solicitation for a transaction in any financial instrument. No representation or warranty is given as to the accuracy or completeness of this information.
Any material provided does not have regard to the specific investment objective and financial situation of any person who may receive it. Past performance and forecasting are not a synonym of a reliable indicator of future performance. AT provides an execution-only service. Consequently, any person acting on the information provided does so at their own risk. Political risk is unpredictable. Central bank actions can vary. Platform tools do not guarantee success.

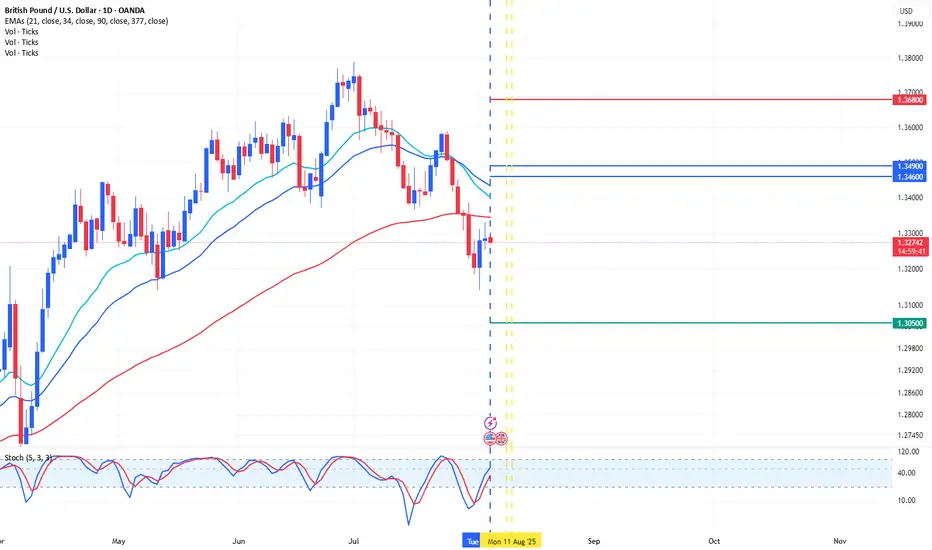
Trading Ideas GBPUSD 1D [Disc On]Technical Analysis:
A bearish pattern has formed on the daily (1D) timeframe, with price action potentially targeting the Fibonacci cluster zone at the psychological level 1.3600 - 1.3490.
Fundamental Analysis:
Fed Interest Rate: 4.50% (in line with expectations)
BoE Interest Rate: (Release date: 7 August 2025)
Conclusion:
High probability for SELL entries in the 1.3600 - 1.3490 zone, with:
(SL): 1.3680
(TP): 1.3050
USDCHF Short - swingprice retracing to daily area of interest, all time frame aligned weekly daily 4h 2h 30m 15 aligned bearish, 1:2 RRR lets see how it goes

KLCI BULLISH
This is just a continuation from my previous thesis of KLCI
*Refer to the link
Trading Range, forming the Schematic #2 of Accumulation
Need to refer other source for volume as TV doesnt provide it

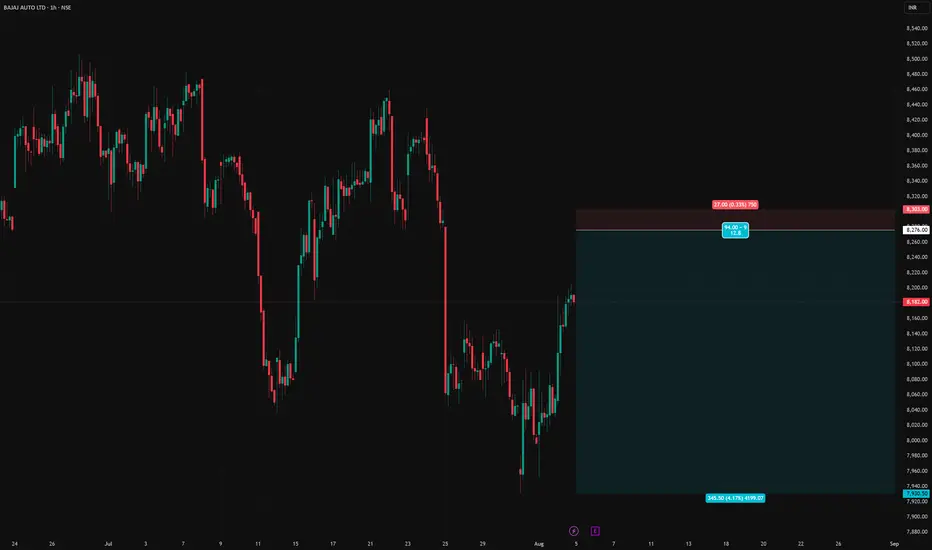
BAJAJ-AUTO short setupBAJAJ-AUTO short setup
Entry price - 8276
Stop Loss - 8303
Target - 7391
Risk Reward - 1:12.8 (Approx 1:13)
Trade Idea – GBPJPYBased on the daily market structure and Elliott Wave count, there’s potential for another bullish push to complete Wave 5.
However, on the H4 timeframe, price may still create one more lower low (LL) before confirming the upward move.
🔔 Wait for confirmation — either a break of structure or a bullish engulfing candle on the H1 timeframe before entering any buy positions.
#GBPJPY #ForexAnalysis #ElliottWave #Wave5Setup #UKTraders #USTraders #SwingTrading #PriceAction #ForexStrategy #H1Confirmation

BITCOIN DAILY ANALYSISAn in-depth daily analysis was done on CRYPTOCAP:BTC after revisiting our yesterday trade setup which played out. For the main time we will be bearish while at the back of our mind we are overall bullish. but as usually we will allow market eventually do what it know how to do best.

Gold - Brent OilGold and oil are poised for a 7-10% price surge amid escalating Middle East tensions. Oil prices face downward pressure from US efforts to stabilize markets, but supply risks from the conflict-prone region—a major production hub—may override this, driving prices higher. Meanwhile, investors are likely to flock to gold as a safe-haven asset to hedge against volatility, boosting demand and prices. Historically, geopolitical instability strengthens gold’s appeal, and current conditions suggest a repeat of this trend.
Sasha Charkhchian

SCGBHD CONT MARKING UPThis is a continuation from my previous thesis
A simple , short , trading range, offer low risk entry
I Maintained my previous thesis
Current marking up is a continuation from previous Trading Range (Refer Link)
Position as attached
PureWcykoff

MNHLDG CONTINUE MARKING UPThis is a continuation from my previous entry
**Refer link
Referring to the Red Box, I see it as a Stepping Stone (SS) , a mere temporary stop centre,
before continuing marking up from previous Trading Range (Red Arc Line).
My hypothesis is that, this box are forming a mini Trading Range , in which the formation of local spring , prompted me to initiate position.
The 3 Bars (Or Candlesticks, whatever you prefer), are basically a SpringBoard [/b ] in the form of Absorption.
For Non Wyckoffian, this might be confusing.
Different POV produce different meaning & context/subcontext.
I intiated my position @ 31/7/25, added position today
PureWyckoff

Daily Analysis- XAUUSD (Tuesday, 5th August 2025)Bias: No Bias
Notes:
- No exact bias for today as price sitting at 0.618 fib level
- Looking for liquidity sweep for sell and strong pullback for buy
- Potential BUY/SELL if there's
confirmation on lower timeframe
- Pivot point: -
Disclaimer:
This analysis is from a personal point of view, always conduct on your own research before making any trading decisions as the analysis do not guarantee complete accuracy.
