Transports: Non-Confirmation for Stocks?The S&P 500 SP:SPX hit new all-time highs last week. But one noteworthy part of the market didn’t participate: transportation stocks.
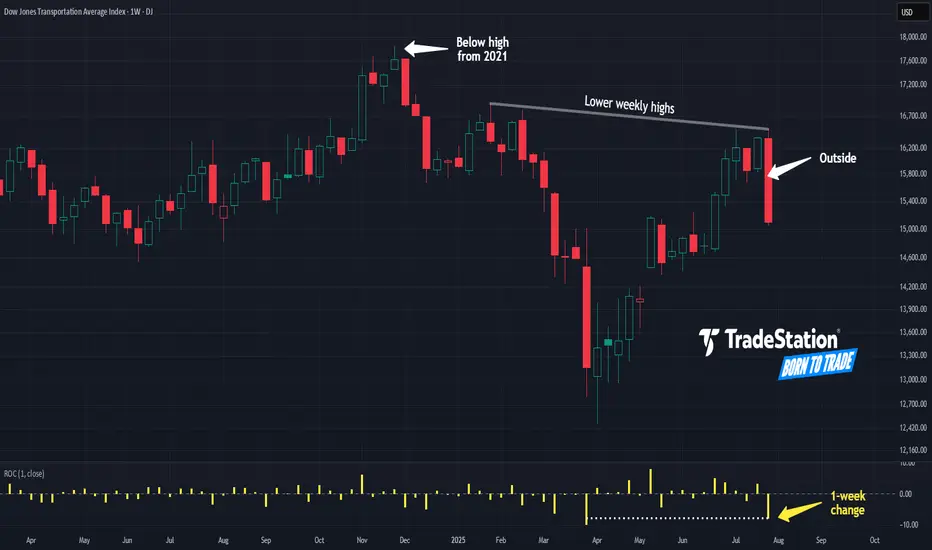
Today’s weekly chart of the Dow Jones Transportation Average shows how prices inched to a new high but failed to hold. They instead reversed and closed at the lowest level in over a month. The resulting bearish outside candle is a potential reversal pattern.
Second, DJT peaked last November below its previous all-time high from 2021. That’s a potential sign of poor relative strength.
Third is the series of lower weekly highs since late 2024. Why aren’t buyers driving the group to new records?
Fourth, rate of change in the lower study reveals the Transports lost 7.7 percent of their value last week. Aside from the extreme volatility around “Liberation Day,” it was the biggest weekly drop since September 2022.
Finally, there could be implications for the broader market because DJT is often seen as a bellwether for business and the economy in general. (This is often known as “Dow Theory.”) Given apparent weakening of the labor market last week, some investors may see a warning sign in DJT’s price action.
TradeStation has, for decades, advanced the trading industry, providing access to stocks, options and futures. If you're born to trade, we could be for you. See our Overview for more.
Past performance, whether actual or indicated by historical tests of strategies, is no guarantee of future performance or success. There is a possibility that you may sustain a loss equal to or greater than your entire investment regardless of which asset class you trade (equities, options or futures); therefore, you should not invest or risk money that you cannot afford to lose. Online trading is not suitable for all investors. View the document titled Characteristics and Risks of Standardized Options at www.TradeStation.com . Before trading any asset class, customers must read the relevant risk disclosure statements on www.TradeStation.com . System access and trade placement and execution may be delayed or fail due to market volatility and volume, quote delays, system and software errors, Internet traffic, outages and other factors.
Securities and futures trading is offered to self-directed customers by TradeStation Securities, Inc., a broker-dealer registered with the Securities and Exchange Commission and a futures commission merchant licensed with the Commodity Futures Trading Commission). TradeStation Securities is a member of the Financial Industry Regulatory Authority, the National Futures Association, and a number of exchanges.
TradeStation Securities, Inc. and TradeStation Technologies, Inc. are each wholly owned subsidiaries of TradeStation Group, Inc., both operating, and providing products and services, under the TradeStation brand and trademark. When applying for, or purchasing, accounts, subscriptions, products and services, it is important that you know which company you will be dealing with. Visit www.TradeStation.com for further important information explaining what this means.
Beyond Technical Analysis
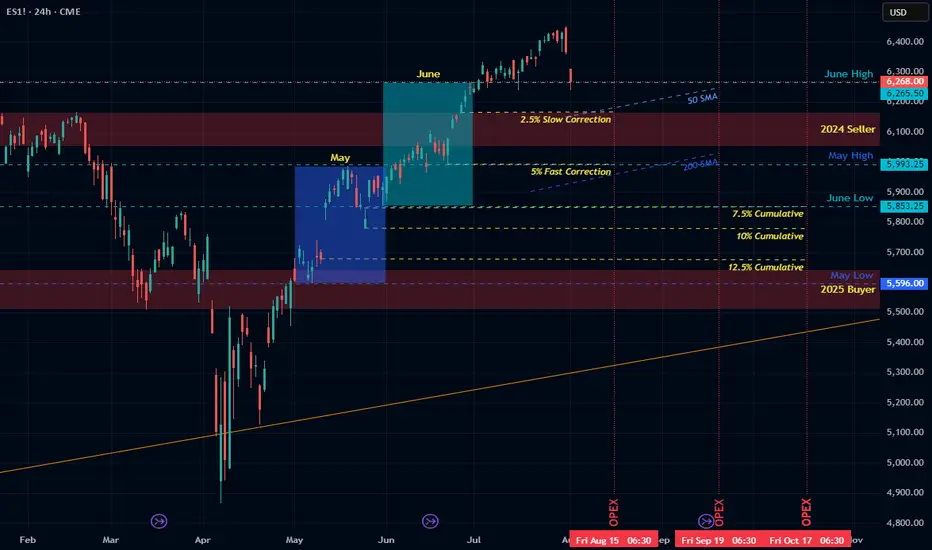
Path into Q3Outlook for the Next Few Months
• Now–August OpEx: -2.5% to -5% slow correction
• August–September OpEx: potential 5–7.5% additional decline
• By late Q3: cumulative 10–12.5% drawdown (target S&P ~5700).
• October: possible bounce — or acceleration if data worsens
• End of Year: risk of deep drop à la Oct–Dec 2018 if trends continue
Macro Backdrop
• Watch for margin compression, CPI surprise, and unemployment uptick
• Private data shows more fragility than government numbers
• QRA-driven liquidity tightening may amplify downside risk
Political Timing and Fed Policy
• Administration may welcome controlled decline to enable early 2026 rate cuts
• If market doesn’t decline soon, blow-off top/melt-up into midterms possible
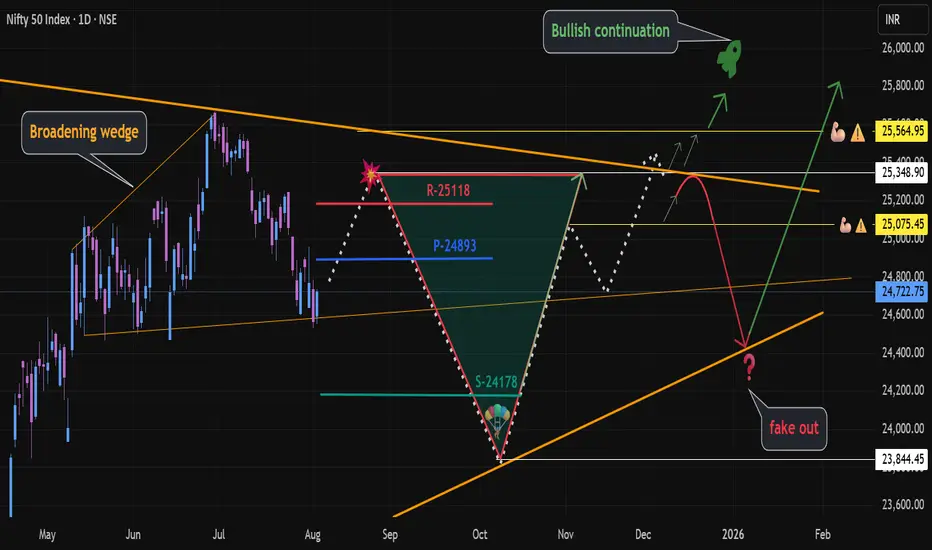
NIFTY 50 – 1D TF: Expanding Triangle DynamicsInside the triangle we saw a triangle again
Pattern: Classic Broadening wedge —higher highs & lower lows = volatility + indecision
Microstructure: Within the Triangle, a smaller broadening wedge formed, signaling coiling price before potential range expansion.
Sideways & expanding = distribution or re-accumulation phase. (For 1D TF Macro Triangle outlook scroll ↧)
Markers:
🥵Resistance
🥶Pivot
🤢Support
💪🏼⚠️Key levels
💥 Order block from Supply Line breakdown
🪂 Our main Man
❓U-🔻Turn Fake Out, lets see how it goes!
🚀 Let me know your views
Technical Insight
Broadening wedge 📐:
Often signals high emotional volatility— smart money accumulates in the chaos while retail gets whipsawed. Market is struggling to agree on fair value — hence breakout/breakdown traps are common.
Progressively a rejection from the supply💥 line zone could result in a lower high, leading to sharp retracement toward 24,000 or lower → our main man 🪂
Liquidity Grab Setup:
If NIFTY dips near 🪂 23,844 and forms a V-reversal, it could be a liquidity spring towards 25,350 🚀
🚫 Critical Checks to Avoid False Breakouts
Watch out 🪂💥❓
Liquidity Trap: Ignore breakouts with volume < 1.5x avg.
Expiry Week: Reduce position size (PCR/OI noise increases).
VIX Filter: No shorts if VIX < 15 (low volatility traps).
📊 Fundamental Alignment
Macro Tailwinds:
Q2 GDP prints strong: India remains among the fastest-growing economies.
FIIs have returned in phases post-June; DII participation remains robust.
Inflation cooling (CPI near 5%) + expectation of status quo on rates by RBI = positive for equities.
💹Risk Catalysts
Global volatility from US yields, Fed guidance, and oil prices could influence near-term moves.
Upcoming domestic events (elections, fiscal data, monsoon trend) may impact sentiment around key supply zones.
🛠️ Strategic Outlook
Validated (Bullish Continuation)
Setup: Bounce off 24,178 → breakout above 25,118 → reclaim 25,565
Bias: Bullish breakout
Trigger: Daily close above 25,565 with volume
Invalidated (Fakeout then Breakdown)
Setup: Pop above 25,118 → rejection from OB → lower high → flush toward 23,844 and Lower
Bias: Bearish
Trigger: Bearish engulfing near 25,350
Always DYOR,
See you on the other side
💡 Reflective Close:
In expanding structures, the real edge isn’t prediction — it’s patience.
Are you managing risk through structure or emotion through bias?
Report - 4 August, 2025OPEC+ Ends Output Restraint, Glut Risk Emerges
OPEC+ announced a production increase of 547,000 barrels/day starting in September, marking the end of its nearly two-year output restraint policy. The move comes after coordinated cuts of 2.2 million b/d by core members like Saudi Arabia and the UAE failed to stabilize prices amid weak Chinese demand and rising EV adoption. With U.S., Canada, and Brazil gaining market share, internal cohesion within the cartel has weakened.
Implication: Bearish short-term crude oil outlook. A Q4 glut risk rises. Watch for downside toward $65/barrel. Inflationary pressures may abate, reducing urgency for central bank hawkishness.
U.S. Wage Inequality Deepens, Data Integrity in Question
New Atlanta Fed data shows low-income workers (<$806/week) saw wage growth fall to 3.7% YoY — nearly half its 2022 peak — while the top 25% still enjoy 4.7% gains. This uneven recovery is amplifying scrutiny of Trump’s economic policies. The president’s firing of the Labor Statistics chief post-weak jobs report has alarmed economists and investors, raising fears of political interference in vital data.
Implication: Undermines institutional trust in U.S. economic data. Increases political risk premium. Weighs on confidence in Treasury markets and complicates Fed response amid wage stagnation for key consumer segments.
Swiss Trade Shock – Tariffs Spike to 39%
Switzerland faces a 39% U.S. tariff after being blindsided by Trump’s administration, which rejected a presumed 10% baseline deal. Despite pledging $150B in U.S. investments, the Swiss were penalized over a $39B trade deficit, most of which stems from gold and pharma — sectors already exempt. President Keller-Sutter is under political fire, with comparisons drawn to historic national embarrassments.
Implication: Undermines smaller neutral economies' negotiating leverage. Risks spillover into Swiss equities (e.g., watchmakers, pharma). FX safe-haven status of CHF could weaken if investor confidence wavers.
European Bank Stocks Surge to 2008 Highs
Europe’s banks are outperforming globally, with shares in HSBC, Santander, Barclays, and UniCredit reaching decade highs. The rally is driven by sharply rising long-term yields (30Y–2Y spread at 1.3%+), boosting net interest margins. Though Trump’s latest tariff shock pulled back gains slightly, the sector is still up 34% YTD — outpacing U.S. peers.
Implication: Positive for European financials. But sustainability is tied to rate curve steepness — a flattening or ECB dovish pivot could halt momentum. Sector rotation trades favor EU banks over U.S. for now.
Dollar Rallies, Then Retreats on Weak Jobs Print
The U.S. dollar rallied 1.5% during the week — its strongest since Trump’s re-election — but Friday’s dismal jobs data triggered a 1.3% drop. Downward revisions and signs of broader labor market weakness are raising bets on Fed rate cuts. Trump’s abrupt removal of the BLS head has added institutional risk to dollar sentiment.
Implication: Dollar strength narrative interrupted. Expect near-term softness as markets price deeper cuts. Watch for EURUSD support around 1.08 and DXY pullback toward 101. Tech and gold likely to benefit from a weaker USD outlook.
Trade War Creates Uneven U.S. Corporate Profit Map
Big Tech and banks (Apple, Meta, JPMorgan) are defying tariffs with strong Q2 earnings, while consumer staples and materials suffer margin erosion despite rising sales. Over half of S&P 500 companies report lower margins YoY. The top 10 stocks now account for one-third of total index profits, underlining concentration risk.
Implication: Fragile breadth in equity markets. Overweight tech/financials remains dominant strategy, but under-the-surface weakness in consumer cyclicals may pressure indices on earnings misses. Trade war effects are being absorbed by the bottom end of the corporate and household spectrum.

USDJPY short position 04/08/2025English : According to our analysis, we anticipate a bearish scenario.
Morocan Darija : kanchofo d'apres l'analyse dyalna antsanaw hboot
ATENTION : I only share my ideas, not signals

DOGE | 3D PlanPrice broke down instead of sweeping the range, leaving a new set of equal lows as liquidity targets. Structure now favors a patience play.
Triggers for action:
Monthly reclaim: Bullish trigger — reclaiming the M level signals strength, opens path for a trend reversal.
Sweep of equal lows: If price dips and runs the new set of equal lows (gray box), look for signs of absorption or reversal for a long setup.
No trade in the middle—waiting for either a proper liquidity sweep or a confirmed reclaim of the major level.

Xrp/Btc✨ Ripple vs Bitcoin — awakening from a long slumber?
📍 August 2025, Monthly Chart
A decade of swinging
between historic peaks and the heavy shadow of silence...
Now, XRP rests at 0.000026 BTC,
as if slowly awakening after years of dormancy.
🔸 RSI has moved off historic lows, gaining strength.
🔸 The long-term moving average (red) is drawing closer to price.
🔸 Key resistances ahead:
▫️ 0.000097 → 38.2% Fib
▫️ 0.000125 → 50% Fib
▫️ 0.000153 → golden 0.618 Fib.
🔮 Scenarios:
1️⃣ Break above 0.000097 → a mid-term wave toward 0.000153.
2️⃣ Failure to break → a pullback toward the 0.000062 ~ 0.000058 support zone.
📌 Is Ripple finally awakening?
Or is this just another breath before the next slumber?
Time will tell... ⏳

Sol/Btc✨ Solana vs Bitcoin — a quiet moment before the move?
📍 First week of August 2025
From the roaring highs of 2021,
Solana slowly faded under Bitcoin’s shadow…
Now resting around 0.0014 BTC,
breathing quietly, perhaps gathering strength:
🔸 RSI shows a bullish divergence — momentum building.
🔸 Moving averages (red & yellow) still overhead, but the gap is narrowing.
🔸 Key resistances:
▫️ 0.0020 → 38.2% Fib
▫️ 0.0025 → 50% Fib
▫️ 0.0030 → the golden 0.618 Fib.
🔮 Scenarios:
1️⃣ Break above 0.0020 → a fresh wave toward 0.0030 and beyond.
2️⃣ Rejection → a revisit to 0.0012 ~ 0.0014 BTC zone to reload.
📌 For now, the market holds its breath…
Will Solana awaken?
Or remain in Bitcoin’s shadow a little longer? 🌙

Eth/Btc✨ Ethereum vs Bitcoin — perhaps a new season is near...
📍 First week of August 2025
From the depths of a long, quiet downtrend,
Ethereum has risen from the 0.018 ~ 0.022 BTC zone...
Where unseen hands quietly caught the fall.
Now standing at 0.031 BTC:
RSI has regained strength, entering bullish territory.
Moving averages are converging — hinting at a possible shift.
All eyes now on the major resistance at 0.042 BTC...
🔮 Possible scenarios:
1️⃣ A breakout above 0.042 BTC → a path toward 0.057 and beyond.
2️⃣ Failure to break resistance → a return to the same mysterious yellow box.
📌 For now, the market breathes with renewed energy...
But is this the renaissance of ETH against BTC?
Or just another dance before the next calm?
🕊️ Patience remains our greatest ally...

gold on sell reverse#XAUUSD on price reverse, base on the double rejection between 3345-3357. We await for breakout below 3351.6 before selling.
Entry 3351.6, target 3340-3315, SL 3361.
Above 3367 on 2 times breakout holds bullish till 3377 which have sell reject to fall below 3360-3350.

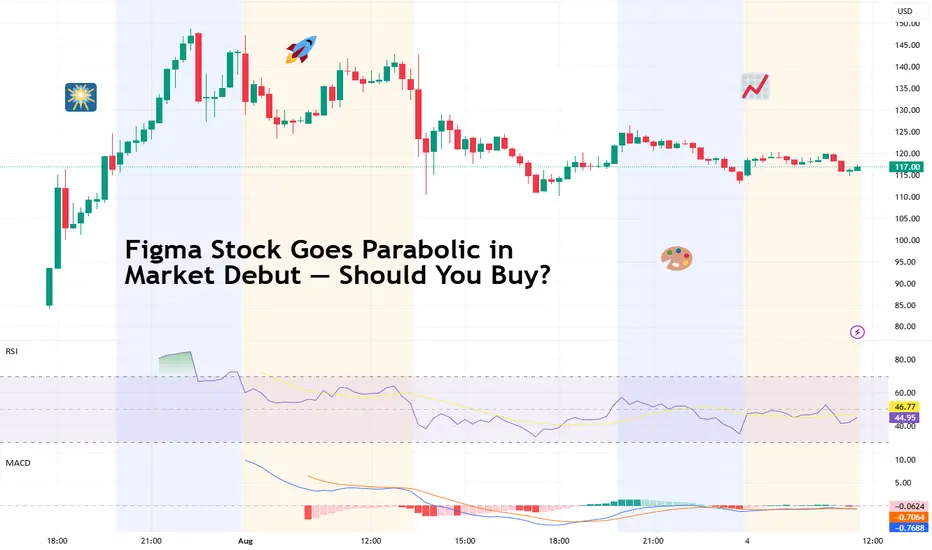
Figma Stock Goes Parabolic in Market Debut — Should You Buy?Figma stock NYSE:FIG more than tripled on IPO day. But that’s not thanks to the Figma guys — they had agreed to sell the company to Adobe NASDAQ:ADBE just two years ago.
Figma stock NYSE:FIG made a spectacular entrance into public markets last week — and then some. Shares of the design software firm surged 250% in their debut Thursday and climbed another 5% Friday, pushing the company’s fully diluted valuation to about half the size of Adobe NASDAQ:ADBE , the company that once tried to acquire Figma for $20 billion before regulators shut it down.
It’s a strong showing for the IPO market and a signal that investors are still willing to pay up for growth — even if the valuation raises more than a few eyebrows.
💸 $33 Becomes $118: Here’s What Happened
Figma priced its IPO at $33 per share on Wednesday, above the already-raised target range of $30–$32. The stock opened at $85, hit highs around $120, and closed the day up 250% . It ended Friday at $122, giving the company a fully diluted valuation of roughly $70 billion.
Quick stat: Figma pulled in $749 million in revenue last year. That means Figma’s price-to-sales ratio is sitting close to 94x. By contrast, Adobe trades at just under 11x sales. Froth or not?
📈 Growth Is Real — But So Is Volatility
The one big thing in Figma’s favor is growth. The company increased revenue by 48% last year and by another 46% in Q1 2025. But profitability is uneven. It posted a net loss of $732 million last year — a reversal from a $737 million profit in 2023 that was mostly boosted by a $1 billion breakup fee from Adobe. Without that one-off, the business hasn’t been consistently profitable.
In Q1 of this year, however, Figma did turn a small profit of $44.9 million. That’s a good sign — but it’s not enough to embrace a 94x multiple.
🤝 Who Uses Figma and Why It Matters
Figma isn’t just a trendy tool for designers — it’s widely used across big tech. Clients include Netflix NASDAQ:NFLX , Coinbase NASDAQ:COIN , Spotify NYSE:SPOT , and even the finance bros over at Vanguard. The software allows real-time collaboration, making it pretty attractive for remote or hybrid teams.
Its browser-based model and freemium pricing helped it spread fast during the pandemic, and now it’s seen as essential software for modern digital product teams. If you’ve ever opened a figma.com link during a Zoom call, you already know. “Can everyone see my screen?”
💎 Figma, the Bitcoin Holder
In a twist that feels very 2025, Figma disclosed in its filings that it holds Bitcoin BITSTAMP:BTCUSD . The company invested $55 million in the Bitwise Bitcoin ETF AMEX:BITB in March 2024 — and by March 2025, that stake had grown to nearly $70 million. They also bought $30 million worth of USD Coin CRYPTOCAP:USDC , which they plan to convert into more Bitcoin later on.
Figma’s treasury strategy echoes moves by companies like Strategy NASDAQ:MSTR , GameStop NYSE:GME , and Tesla NASDAQ:TSLA , and signals a growing trend among tech companies holding crypto on the balance sheet. It also adds another layer of volatility to Figma’s investment profile — though bulls might see it as a hedge.
🧾 IPO Cash and What Comes Next
Figma, as the newest entrant into the US stock market , raised over $1.2 billion from its IPO, capital it says will be used for general corporate purposes, product development, and potential acquisitions. Given its ambitious roadmap, that kind of cash cushion could help sustain growth — especially as it scales up competition with Adobe, Sketch, Canva, and Notion.
That said, being public also means new (and painful) expectations. Traders and investors will want to see steady top-line expansion, margin improvement, and a path to sustainable profit.
👀 Should You Buy the Stock Now?
The enthusiasm is clear — but so is the premium. Buying Figma now means paying 94x revenue for a company with promising growth but no long-term track record of profitability. That’s a tough sell for value investors but par for the course in growth tech — at least during bullish cycles.
If you're a long-term believer in the design software space and Figma's competitive edge, you may see upside. But for others, it might be worth watching a few quarters of earnings before jumping in. IPOs often pull back once the first wave of euphoria fades (and the insiders dump their stakes).
👉 Bottom Line
Figma’s market debut was one of the most successful of 2025 so far. The company has the brand, the user base, and the growth metrics to somewhat justify serious investor interest. But it also has a premium valuation and a patchy history of profitability.
Earlier this year, CoreWeave NASDAQ:CRWV (cloud computing and AI) and Circle Internet Group NYSE:CRCL (the stablecoin guys) stunned Wall Street with similarly turbocharged entries. It’s a unicorn stampede, and investors are chasing them like it’s 2021 all over again.
Off to you : Are you buying NYSE:FIG ? Holding off? Or just admiring the charts like a good minimalist designer?
One Sweet Bullish Candle Above 50EMA… and I’m All Yours, 1.7940I’ve got a lovely 1H bullish range from 1.7733 to 1.7940 — pure potential.
Market gave me a 100-pip pullback/retracement from 1.7940 to 1.7840 — just a little mood swing. 😒
Now I’m patiently stalking...
If a bullish candle closes above my 50EMA,
I’m not thinking twice — I’m riding the bull! 🐂💥
SL? Depends on the candle’s vibe:
If it’s a strong Marubozu, I’ll trust it like a loyal partner — SL goes just below it.
TP? Straight to 1.7940 — no detours, no drama. 🎯
Wish me luck… and a Marubozu with commitment issues! 😂📉📈

XAUUSD Long - DiscretionaryElite Analysis - Discretionary Trade
Not Rules Based Execution
Executed in a lower OB in lower time frame
Targeting upper liquidity pools
I believe we are bullish on gold until structured liquidity, than we will see an violent drop.

XAUUSDHello Traders! 👋
What are your thoughts on GOLD?
Gold saw a strong rally on Friday following the U.S. Non-Farm Payrolls (NFP) report and is now trading near a key resistance zone.
At this resistance, a short-term pullback is likely as traders lock in profits.
We expect the correction to be contained within key support levels, and if price holds in that zone, the uptrend is likely to resume, targeting new highs.
Will gold resume its rally after the correction? Share your view below! 👇
Don’t forget to like and share your thoughts in the comments! ❤️

BTC accumulates, slightly adjusts down💎 BTC PLAN UPDATE – START OF THE WEEK (04/08)
🔍 1. Current Technical Structure
Price Pattern: The chart shows BTC is forming a falling wedge pattern, with converging support and resistance lines.
False Break: There was a false break below the strong support zone around ~112,000, followed by a sharp rebound. This indicates buyers are actively defending this level, showing potential buying pressure.
Fibonacci Retracement: From the recent low to high, the 0.5 (115,559) and 0.618 (116,361) Fibonacci levels are acting as key resistance zones.
Key Price Levels:
• Strong support: 111,800 – 112,300
• Near resistance: 115,500 – 116,500
• Next resistance: downtrend line and previous high around 118,000 – 119,000
🔄 2. Possible Trend Scenarios
✅ Main scenario (bullish):
BTC made a false break below the wedge → rebounded toward Fibonacci resistance → potential:
• Continue rising to the 115,500 – 116,500 zone
• If it breaks and holds above this zone, BTC could break out of the wedge pattern and target 118,000 – 120,000
• A longer-term target could be the 1.618 Fibonacci Extension around ~123,159
❌ Alternative scenario (bearish):
If BTC fails to break above 116,000 and gets rejected:
• It may retest the 112,000 support zone again
• A breakdown below this support would bring back the downtrend
🔄 3. Bullish Supporting Factors:
• The false break signals a shakeout of weak sellers.
• A potential inverse head-and-shoulders pattern is forming, supporting a bullish reversal.
• Moving Averages (MA): Price is nearing the 200 MA (red) – a possible bullish crossover with shorter-term MAs may occur, signaling a buy.
🧭 Suggested Trading Strategy
• Safe buy zone: Around 113,500 – 114,000 if there’s a pullback.
• Take profit in stages: 116,500 – 118,000 – 120,000
• Stop-loss: Below 112,000 in case of a confirmed breakdown

Gold Continues Its Upward Momentum Despite Short-Term Pullback📊 Market Summary
• Spot gold slipped slightly by ~0.1% to around $3,354–$3,361/oz due to profit-taking after last week’s sharp rally following weaker-than-expected U.S. job data
• The U.S. added only 73,000 jobs in July, boosting expectations of a Federal Reserve rate cut in September, with a current market probability of around 81%
• Ongoing geopolitical risks, trade tensions, and robust central bank and ETF gold demand continue to support the long-term bullish outlook
________________________________________
📉 Technical Analysis
• Key resistance: ~$3,360–$3,370/oz (short-term highs, potential profit-taking zone).
• Nearest support: ~$3,330/oz (watch for buying interest on pullbacks).
• EMA09: Price is currently hovering around the short-term EMA (~EMA09), still below EMA50, indicating a mild sideways bias. According to Economies.com, gold hasn’t confirmed a stable uptrend above EMA50 yet
• Candlestick / volume / momentum:
o Today's candle shows mild profit-taking, but momentum remains bullish from the prior session. Volume shows light distribution, not strong selling.
________________________________________
📌 Outlook
• Gold may continue rising slightly in the short term if the upcoming U.S. inflation data (due August 12) remains soft, reinforcing the likelihood of a Fed rate cut
• Conversely, if the U.S. dollar strengthens unexpectedly or new data comes out more robust, gold could retreat back to the $3,330 zone.
________________________________________
💡 Suggested Trading Strategy
SELL XAU/USD : $3,370–$3,373
🎯 TP: 40/80/200 pips
❌ SL: $3,377
BUY XAU/USD : $3,330–$3,333
🎯 TP:40/80/200 pips
❌ SL: $3,327

xau longnews on the tariff on swiss last friday, should still have a up ward movement.
wait for retest to enter this.
expecting bull flag strat, if triple top, exit the trade. or sl be
been very busy lately, also doing well with our copy trading, we also launched a smart plan copytrading service.
we have partnered with Blackbull markets to give the best spreads of roundtrip 5.5 usd.
see profile to get updated.

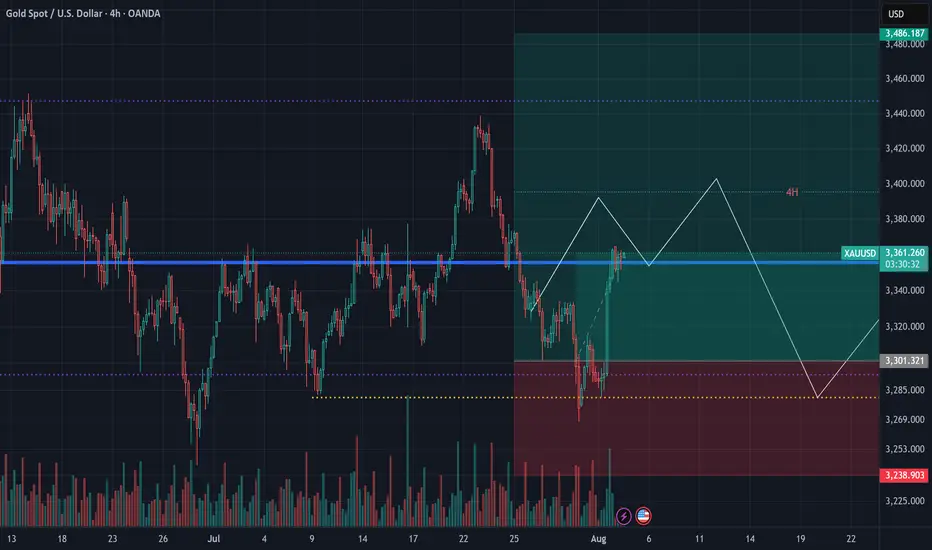
XAUUSD Technical Outlook – August 4, 2025Last week, prior to Powell’s speech, we expected a move down to the $3280 area.
While we anticipated a brief pullback to lighten liquidity around $3400 first,
price instead dropped straight down without a bounce.
✅ The reaction at our level was spot-on,
culminating in a weekly close above $3360 — very bullish.
With liquidity around $3370 already cleared,
we don’t expect strong resistance ahead.
📈 The preferred strategy for this week: Buy gold.
🎯 A solid entry zone lies between $3320–$3330.
⚠️ For those insisting on counter-trend trades,
we strongly advise keeping targets small.
SUI | Sui Network - Swing Long Idea - Altcoin
📊 Market Sentiment
Market sentiment remains bullish, supported by expectations of a 0.25% rate cut at the upcoming FOMC meeting. The weakening USD and rising risk appetite across global markets are favoring crypto assets in particular.
📈 Technical Analysis
SUI recently gained bullish momentum, largely following Bitcoin's strength.
We’re now seeing a healthy retracement, which is expected after a strong move.
The break of the LTF bullish trendline suggests potential for a deeper pullback toward HTF confluence zones.
📌 Game Plan
I'm eyeing the HTF demand zone around $3.06, which aligns with the 0.5 Fibonacci retracement—a key discount zone.
Just below this, we also have a higher time frame bullish trendline, which could offer dynamic support.
These overlapping levels provide a strong confluence for a swing long idea.
🎯 Setup Trigger
I’ll wait for a 4H bullish break of structure and the formation of an LTF demand zone before entering.
📋 Trade Management
Stoploss: Below 4H demand swing low
Target: Up to $4.44
I’ll trail my stop to lock in profits aggressively along the way.
💬 Like, follow, and comment if this breakdown supports your trading!
More setups and market insights coming soon — stay connected!


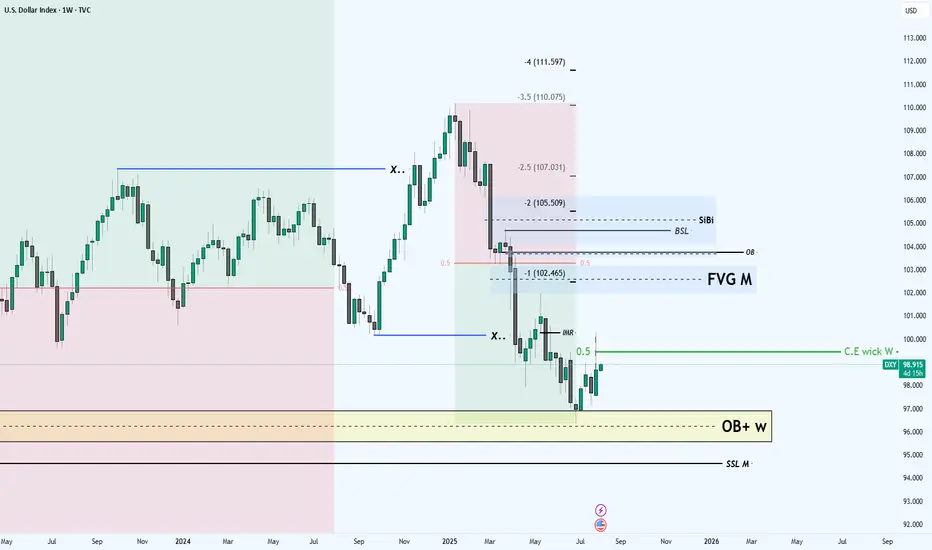
future of the DXYHi to every one
In the DXY we are in the middle of the decisioning area which means
we should wait for the market to show its hands
First sensitive level that i am looking for is the C.E of the weekly candle(Prev.week)
IF we get resistance at that level we can wait for the price to deep into the SSL M level
Other wise i don't see any indication and obstacle for the DXY to reach the OB level above the 0.5 mid level of the range
this is my the first low hanging fruit objective which is high probability
after that my ultimate objective is the SiBi to be rebalanced
This was the technical perspective
BUT
things are happening around the world the most important one is the
USA central bank Interest Rate Cutting Decision which can leads the DXY to go lower without retracting to the 0.5 of the range
this factor also should be considered BUT overall i am bullish for DXY
GBPUSD Short Re-Entry at Inverse SIBI Post NFP GBP/USD
Setup Overview
Price opened the week with a gap at 1.32765 following Friday’s underwhelming NFP. Asian session low formed at 1.32535 before a London-session re-entry tapped the inverse 1-hour SIBI level at 1.32765. This retest offers a high-probability short setup, targeting the Asian low and Friday NY PM low for optimal reward.
Entry & Exit Levels
Order Level Pips from Entry
Entry 1.32765 —
Stop Loss 1.32900 13.5
Target 1 1.32535 23
Target 2 1.32161 404
Risk/Reward Ratios
Target 1 R:R ≈ 1.7 (23 pips gain vs. 13.5 pips risk)
Target 2 R:R ≈ 3.1 (41.4 pips gain vs. 13.5 pips risk)
Trade Criteria
Entry triggered on a clear rejection candle at the 1-hour inverse SIBI level (1.32765)
Confirm on volume spike and bearish wick formation
Stop just above the recent high to protect against NFP-driven volatility
Confluence Factors
Weekly opening gap resistance at 1.32765
Friday’s NFP spike tapped into the daily SIBI high
Asian low at 1.32535 and NY PM low at 1.32161 provide clear, logical targets
Notes & Next Steps
Adjust position size to risk no more than 1% of account equity
Monitor US CPI and Fed speaker calendar for potential volatility twists
Annotate this idea on your TradingView chart, set alerts at entry and target levels, and review price action around London close
Good luck with your trade—stay disciplined, and may the odds be in your favor!

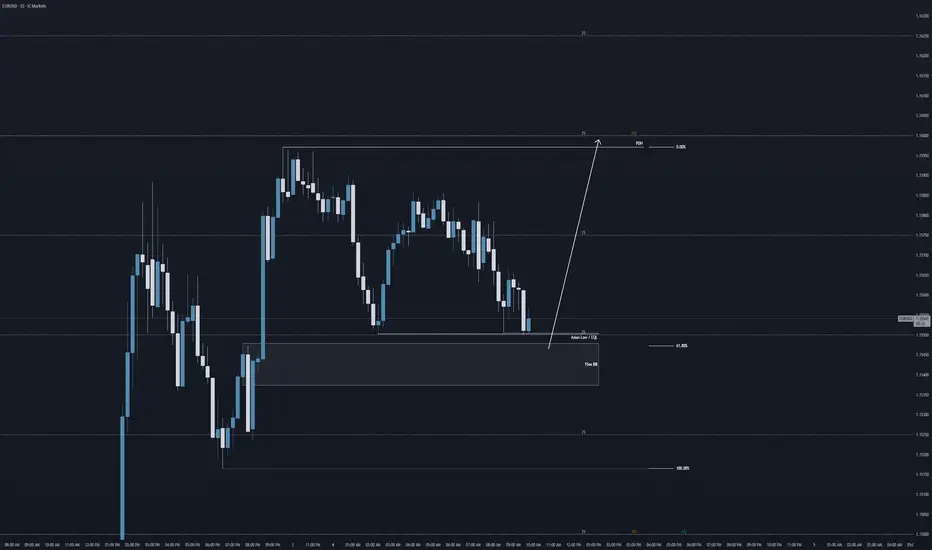
Bullish to sweep PDH (1.16)Good morning traders,
here is a bullish take on EURUSD for today.
I have my eyes set on the previous day high (PDH), and a sweep into key price level of 1.16.
Looking at an interim sell side liquidity sweep of the Asian lows into a 15m breaker block @ 61.8% FIB retracement.
Will of course wait for LTF structure confirmations before getting involved into the markets.
Kind regards,
Aman
SMC Wolf FX