SPY vs VIX two day LongSPY falling wedge - short term oversold - VIX wainning, looks like VIX to retreat to $18.50 area which translates into a DCB on SPY. We'd Aug 6th target = $631/633 Gap fill then probable resumption to the downside to test $613. Good luck 👍
Beyond Technical Analysis

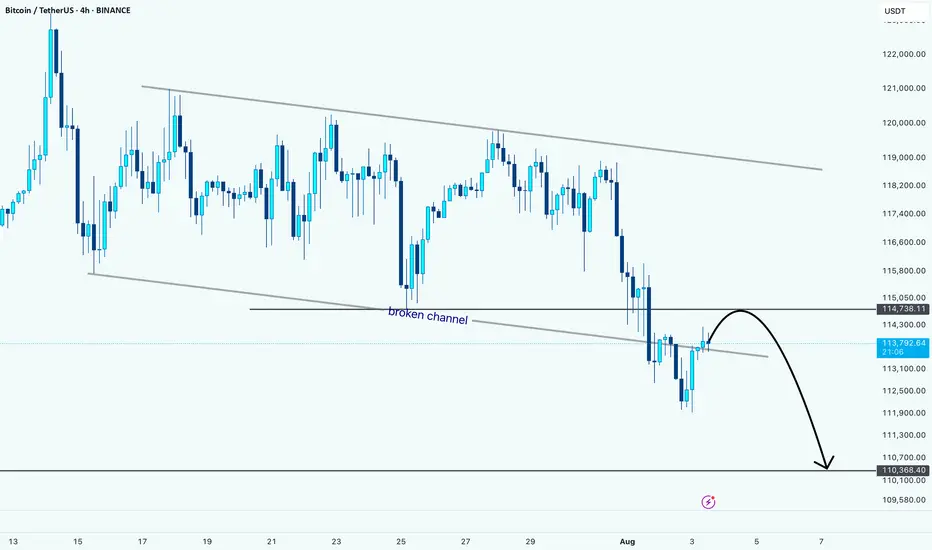
BTC Breaks Down: Retest Could Lead to More LossesHello guys!
Bitcoin has officially broken below the descending channel it was stuck in for weeks. Right now, price is pulling back to retest the broken channel, which is now acting as resistance around the 114,700 zone.
What I'm watching:
Broken channel = bearish signal
Retest zone around 114,700
Downside target near 110,400
So far, it looks like a clean setup for further downside, unless bulls manage to reclaim that broken trendline. Until then, the pressure remains to the downside.
Let’s see how price reacts here... Rejection = short opportunity.
BDMS TF Month (Buy TP 22.40/24.00/26.50)BDMS TF Month (Buy TP 22.40/24.00/26.50)
1- Looking at the past, we see that the lowest point in 2020 was around 13.90, with the RSI at approximately 37.
2- Currently, it has dropped to the same level, around 38. We believe the price should reverse upwards.
3- When the Fibo (black line) is drawn, we see that the price has retraced to the 61.8% level at 20.30 baht, which is a key historical support level.
///
If 19.80 is a reversal point,
it's possible the price will rise to test 22.40/24.00/26.50.
///
Strategy:
Buy and sell at 22.40/24.00/26.50, respectively.
If the price falls below 19.80, cut your losses.
Good luck.

CADJPY - Downside to continueSellers has taken control with a massive push down, wait for bearish continuation to form to confirm another sell opportunity.
Good Luck

#SOLUSDT: Price to turn extreme bullish! Get ReadyHey there everyone! 👋
I’ve got some updates on the BINANCE:SOLUSDT price. It’s been testing a crucial level, and it’s showing some really strong bullish signs and patterns. But here’s the thing, we’re starting to think there might be a possible reversal coming up in the next few days. If we’re right, the price could hit all three targets we’ve been tracking.
Remember, though, that this is just our analysis, and it’s always a good idea to use accurate risk management when you’re trading.
Thanks for your support! 😊
If you want to help us out, here are a few things you can do:
- Like our ideas
- Comment on our ideas
- Share our ideas
Team Setupsfx_

Btc just hit the 1.618 golden fib no analysis keep posted Keep posted if interested, i just cant show it right now i want to have million of confirmation that it is accurate but i plotted it just right it really just hit it in red cherry just like in game of darts keep posted how i unfold it in coming months/years, it is still the same asset we know the only thing thats different is btc just trying hard to mimic the past moves but its clear as day that its shorthanded in terms of market capitalization. 🥏🐝✅✅..

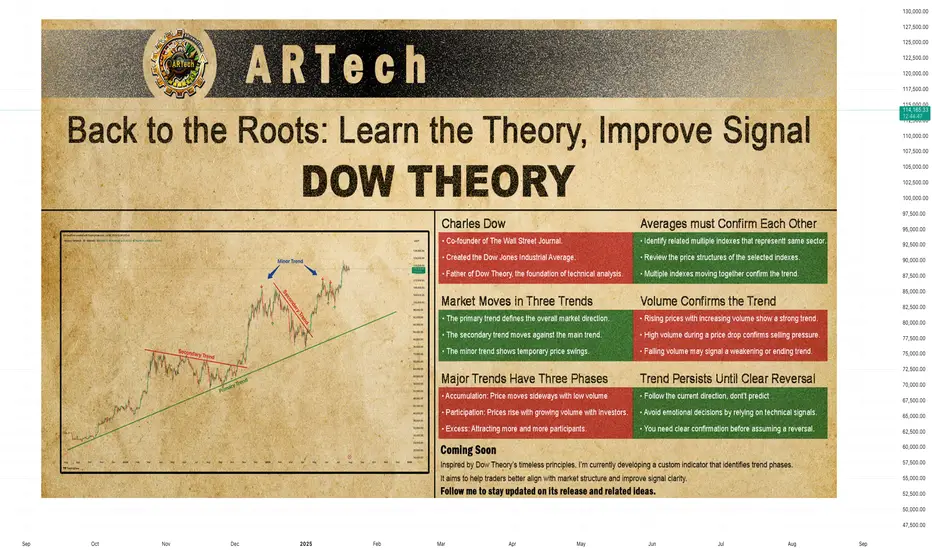
DOW THEORYBack to the Roots: Learn the Theory, Improve Signal
Charles Dow
Before we explore Dow Theory, let’s take a moment to understand who Charles Dow was — and why his ideas still matter today.
Charles Dow wasn’t a financial expert. He was a journalist with a sharp eye for market behavior. In the late 1800s, he began to write about how prices move, how trends form, and what they might mean. His goal was simple: to bring structure and logic to the chaotic world of stock prices.
More importantly, he believed that markets move in trends , and that these trends reflect the collective psychology of all investors. This basic idea became the starting point of technical analysis .
Dow created one of the first stock indexes, which helped investors see the bigger picture instead of focusing only on individual stocks. He also promoted transparency in financial data — long before it was required by law.
In 1889, Dow co-founded The Wall Street Journal, a newspaper that became the voice of financial markets. Through its pages, he published his observations on price behavior, setting the foundation for what would later be known as Dow Theory .
Dow Theory
At the heart of Dow Theory lies a simple but powerful idea:
The market discounts everything.
This means that all known information — earnings reports, interest rates, economic events, political changes, and even future expectations — is already reflected in the price. Price is not random. It is the result of collective investor behavior based on all available knowledge.
Charles Dow didn’t write this exact sentence, but his work clearly reflected this belief. He trusted that by analyzing price movements alone, one could understand the overall direction of the market — because price already includes all the important signals.
Dow and later analysts outlined a set of guiding principles. These are now known as the Six Core Principles of Dow Theory , and they continue to serve as a foundation for modern technical analysis.
The market discounts everything
The market moves in three trends
Major trends have three phases
Averages must confirm each other
Volume confirms the trend
A trend stays in place until it clearly reverses
🔸🔸🔸 The Market Moves in Three Trends 🔸🔸🔸
According to Dow Theory, market movements are not random. Prices move in three different dimensions and time frames: the primary trend , the secondary trend , and the minor (short-term) trend. These three types of movement often occur at the same time. It is very important for an investor to distinguish between them.
The primary trend shows the general direction of the market and can last for months or even years. It’s the major upward or downward movement.
The secondary trend refers to corrections or pullbacks that move in the opposite direction of the primary trend.
The minor trend typically consists of daily or weekly fluctuations and is often considered market “noise.” These short-term movements can occur in the same or opposite direction of the primary trend and may last from a few hours to two or three weeks.
Dow Theory emphasizes that understanding this three-layered structure can protect investors from many mistakes. The theory not only classifies trends but also offers valuable lessons about investor behavior.
It especially highlights the importance of three key principles:
Don’t go against the main trend
Short-term moves can easily confuse traders. Trading against the primary trend often leads to losses. That is why it is crucial to identify the main trend and follow it.
Diversify your exposure
In Dow’s time, technology wasn’t as advanced as it is today, but he still followed multiple indexes (like industrials and transport) to reduce risk. The same principle applies today: investors shouldn’t rely on a single asset — diversification remains a critical part of managing risk.
Define your holding period before entering a trade
Each type of trend comes with a different time expectation. The holding period you choose will play a key role in shaping your trading strategy and aligning it with your financial goals. Instead of debating how long each type of trend should last, it’s more important to define your intended holding period before entering a position.
Your answer to the question “Which holding period suits me?” reflects not only your trading style and lifestyle, but also determines which chart timeframes and indicator timeframes you should use.
🔸🔸🔸 Major Trends Have Three Phases 🔸🔸🔸
According to Dow Theory, major (primary) trends consist of three phases. This structure reflects how investor psychology changes over time and how those emotions are reflected in price action. Regardless of whether the trend is bullish or bearish, each major trend includes these three stages:
Accumulation Phase
The first stage of a bull market often looks like a small bounce during a bear trend. Most people still feel negative about the market. They are afraid to buy again after losing money. Trading volume is low, and prices move in a narrow range. The market stops making new lows, but investors are still unsure. Many have left the market or are very careful now. The price action becomes slow and sideways. It feels boring. But during this quiet time, smart investors slowly start buying. This is how a new trend begins — silently and with doubt.
However, there is no clear signal that a bull market has started. Buying now carries two big risks. First, the market may still go lower. Second, even if a bull trend is coming, no one knows when it will start. How long can you wait while the market does nothing? Holding positions in a flat market has costs — financial, emotional, and missed opportunities elsewhere. That’s why this phase is difficult for most traders to handle.
Public Participation Phase
The market begins to recover, and the broader investor base starts to notice positive changes. News improves, technical indicators give bullish signals. Prices rise, and trading volume increases. This is usually the strongest part of the trend. At this stage, more disciplined and research-driven investors — who follow the market closely — start buying in. They see confirmation in both price action and economic data. Their confidence supports the trend, and momentum grows. The market attracts more attention. Confidence replaces fear. Many investors who stayed out during the earlier phase now feel safer to enter.
Joining the market during this phase is important. The trend is already underway, but there’s still room to grow. Risk is lower than in the early phase, and potential rewards are still high. For many investors, this is the best time to take a position.
Excess Phase
The market enters a phase of excessive optimism. Prices have been rising for a long time, attracting more and more participants. However, during this stage, institutional investors and professional traders who entered earlier begin to gradually take profits.
Although prices remain high, momentum weakens, and the rate of increase slows down. Looking at the volume profile, prices may reach new highs but often without volume support. Technical indicators frequently show bearish divergences. These conditions generate early technical signals that the primary trend may be coming to an end.
🔸🔸🔸 Averages must Confirm Each Other 🔸🔸🔸
According to Dow Theory, a market trend is considered valid only when different indexes move in the same direction. The term “average” here refers to an index or the general direction of a price series. This principle is used to assess whether a price movement is supported by broad market participation.
A single index reaching a new high or low is not enough. For a real and sustainable trend to be confirmed, related indexes are expected to show similar movement and generate signals in the same direction. If this confirmation is missing, the current move may be considered weak or temporary.
How to Analyze It:
Identify related indexes
Choose multiple indexes that represent the same market, sector, or economic domain.
Compare trend direction
Review the price structures of the selected indexes. Are they all showing similar patterns? Did the new highs or lows form around the same time?
Look for confirmation
If multiple indexes form new structures in the same direction (e.g., all make new highs in an uptrend), this increases the validity of the trend.If only one index is moving while others are not participating, confirmation is lacking.
Be cautious without confirmation
When confirmation is missing, trading strategies should be more conservative, or additional signals should be awaited before taking action.
🔸🔸🔸 Volume Confirms the Trend 🔸🔸🔸
According to Dow Theory, the validity of a market trend depends not only on price movement but also on trading volume. For a trend to be considered strong and sustainable, price action should be supported by volume.
Why Is Volume Important?
In a rising market, increasing volume is expected. This indicates growing investor interest and broader participation in the trend.
In a falling market, if the decline happens with high volume, it suggests serious selling pressure and strengthens the trend.
Declining volume may signal a loss of momentum and suggest that the current trend is weakening or nearing its end.
How to Analyze It:
Observe the relationship between price and volume:
Price rising + volume increasing → Strong trend
Price rising + volume decreasing → Lack of confirmation; caution is advised
Check volume during breakouts:
If resistance or highs are broken with strong volume → Reliable signal
If breakouts happen on low volume → May indicate a false move (fakeout)
🔸🔸🔸 A Trend Persists Until a Clear Reversal Occurs 🔸🔸🔸
This core principle of Dow Theory is at the heart of all trend-following strategies.
It states that once a price begins moving in a certain direction, the trend is assumed to continue — until there is clear and technically confirmed evidence that it has ended.
Why Is This Principle Important?
Follow, don’t predict
Instead of guessing what the market will do next, traders stay with the current direction.
Reduces emotional decisions
Trades are based on technical signals, not assumptions like “the price is too high, it must fall.”
A weak trend is not the same as a reversal
Not every pullback means the trend is over. You need clear confirmation before assuming a reversal — such as a breakdown, volume shift, momentum loss, or structural change.
How to Apply It
First, identify the trend direction clearly, and trade in that direction.
Pullbacks are seen as normal movements within the trend — not as reversals.
Even when signs of a reversal appear, wait for confirmation before acting.
Confirmation signals may include:
Failure to form new highs or lows
A break of previous support or resistance
Sudden drop in volume or volume rising in the opposite direction
Weakness or divergence in momentum indicators
Strategic Benefit
This principle is especially useful in trend-following strategies. It helps avoid premature exits and allows traders to stay in profitable trends longer. By focusing on technical confirmation instead of speculation or panic, it encourages disciplined and systematic decision-making.
Weekly Trend Radar1. Macro Market Overview
Last week, the Federal Reserve kept interest rates unchanged, as widely expected. The decision was fully priced in, and the press conference offered no surprises: future rate cuts will depend on incoming economic data.
Markets initially reacted with a decline, but I do not see a structural break in the uptrend for commodities. It looks more like a healthy cooldown before the next leg higher .
However, the equity market is showing signs of deeper weakness . Historically, August tends to be a challenging month for stocks, and what we may be witnessing now is not a short-term correction but the early stages of a major downtrend.
Cryptocurrencies followed equities lower due to their high-beta, risk-on nature, but similar to metals, I believe the correction is temporary and the broader uptrend remains intact.
In energy markets, oil remains volatile — no clear setup for a long position yet. Natural gas has reached support and may offer a cautious long opportunity, though the medium-term trend is still bearish.
Overall, global markets are holding key levels, except for equities, which now look the weakest.
2. Metals
Buy the Dip!
🥇Gold
Gold ended the week slightly higher — a strong performance considering the broader market weakness. Its resilience highlights its role as a safe-haven asset. The bullish trend remains intact, and institutional support appears to be holding.
Trend: Bullish
Key Levels: Support at 3245, resistance at 3450
Position: Looking for a long entry next week
🥈Silver
A more volatile asset compared to gold, silver has pulled back but remains within its bullish trend. Friday’s daily candle showed promise, bouncing from the 50-day moving average. Despite not closing above Thursday’s high, the setup is constructive.
Trend: Bullish
Key Levels: Support at 36.30, resistance at 38.00
Position: Long, stop below Friday’s low at 36.30. New entries still valid.
⚪️Platinum
Similar structure to silver. Friday’s reversal candle signals potential continuation of the bullish move.
Trend: Bullish
Key Levels: Support at 1280, resistance at 1480
Position: Long, with stop below Friday’s low. Valid setup for new positions.
🔘Palladium
Strong technical picture even without a test of the 50-day MA. Remember — these MAs are not entry signals, but trend indicators. Entry is based on confluence, not location alone. And it would be nice to finally see parity with platinum.
Trend: Bullish
Key Levels: Support at 1185, resistance at 1260, 1310, 1340, 1370
Position: Planning to enter long at Monday’s open if the market is supportive. No entry if risk-off sentiment dominates.
🟠Copper
Copper is one of the most compelling setups this week. After a sharp 25% decline, it remains in an overall uptrend. Friday’s bullish candle on the daily chart is promising. A potential new rally may start from here.
Trend: Bullish
Key Levels: Support at 4.35, resistance at 5.15
Position: Planning to enter at Monday’s open, stop below Friday’s low.
3. Energy Markets
🛢️Crude Oil
I'm leaning toward a long setup, but Friday’s red candle on the daily chart signals the need for caution. Waiting for a clear reversal candle before entry.
Trend: Bullish
Key Levels: Support at 68.30, resistance at 72.68, 75.00, 77.70
Position: Waiting for lower volatility and confirmation from daily chart structure.
🔥Natural Gas
The asset has reached a strong support zone. Daily candles are starting to form a potential bottoming pattern, but we need to break through resistance at 3.20 to gain confidence.
Trend: Bearish (medium-term)
Key Levels: Support at 3.00, resistance at 3.20, 3.35, 3.65
Position: Cautious long, small size. Stop-loss is wide, so risk management is key.
4. S&P 500
📉I believe we are entering a major downtrend in the stock market. This is not just a correction — it's likely the beginning of a more sustained decline. I’m shifting my bias to short.
Trend: Bearish
Key Levels: Support at 6150; resistance at 6430
Position: Waiting for short opportunity.
5. Bitcoin
₿Bitcoin followed the equity market lower. The trend is still technically bullish, but the recent risk-off tone in equities warrants caution. Crypto is not a defensive asset and tends to experience sharper drawdowns.
That said, I do not expect another prolonged "crypto winter." Institutional involvement has improved market depth and liquidity, reducing the severity of future crashes — though volatility will remain elevated.
Trend: Bullish
Key Levels: Support at 112.000; resistance at 117.000, 121.000, 123.300
Position: Long, stop below Friday’s low. Act with caution.

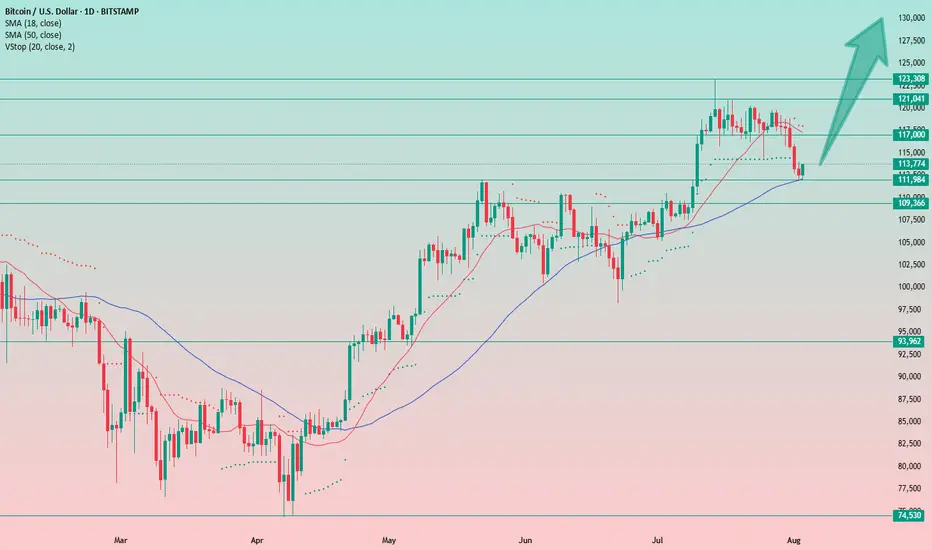
Bitcoin at Key Support: A Strategic Long OpportunityBitcoin has reached a significant support level, coinciding with the 50-day moving average around 112,000. The recent correction appears to have been absorbed by the market, and the broader uptrend remains intact.
This area presents an attractive opportunity for long entries, with a recommended stop-loss placed just below Friday’s low.
Target levels for the upward movement are projected at 117,000, 121,000, 123,300, and potentially higher.
Traders should monitor price action closely around this zone to confirm bullish momentum and manage risk accordingly.
NZDJPY – Bearish Momentum BuildingPair: NZDJPY
Timeframe: 4H
Bias: Bearish
🔍 Technical Setup:
NZDJPY has broken sharply from its recent consolidation and is now testing a critical 4H support zone near 87.00. A decisive break below this zone would open the path toward lower support levels.
📍 Entry Trigger: Break and close below 86.95
🎯 Target 1: 85.95
🛑 Stop Loss: Above 87.35
📉 RSI: Near oversold, confirming strong bearish pressure
This setup reflects a classic bearish continuation with momentum and structure aligned.
🧠 Fundamental + Macro Confluence:
🔻 New Zealand (NZD):
RBNZ cut rates to 3.25% citing weak inflation, growth slowdown, and spare capacity.
Employment data remains fragile; upcoming releases add downside risk.
NZD is under pressure due to falling export demand amid global trade tensions.
CFTC positioning shows longs reducing, net positioning weakening — sentiment turning bearish.
🔺 Japan (JPY):
Bank of Japan is gradually tightening — while still accommodative, the bias is shifting hawkish.
JPY benefits as risk-off sentiment grows — fueled by weak equity markets and rising VIX (20.42).
CFTC shows a massive drop in NNCs, aligning with institutional flows favoring JPY strength.
🌐 Risk Sentiment:
VIX > 20 confirms risk-off sentiment, bolstering safe-haven demand for JPY.
NZD, being a high-beta risk currency, weakens as global risk appetite fades.
Seasonal bias also aligns with weakness in NZD and strength in JPY.
📌 Final Take:
Macro, sentiment, and technicals all align for further downside in NZDJPY. Watch for a clean H4 close below 86.95 to confirm entry. This pair offers strong confluence — from central bank divergence to institutional flows and global volatility.

GBPJPY – Bearish Continuation Setup AheadPair: GBPJPY
Timeframe: 4H
Bias: Bearish
🔍 Technical Overview:
GBPJPY has broken down with high momentum and is now hovering at a 4H support zone (195.30). A clean break and close below this level opens the door for a deeper move toward the next support areas:
Entry Trigger: Break below 195.30
🎯 Target 1: 194.05
🎯 Target 2: 192.50
🛑 Stop Loss: Above 195.95 (previous resistance-turned-supply zone)
📉 RSI: 27.63 (Oversold but momentum-driven selloff suggests more downside)
🧠 Macro + Fundamental Confluence:
🏦 Central Bank Policy:
BOE (Bank of England) cut rates by 25bps (to 4.25%) in a hawkish tone, with internal disagreement (7–2 vote), signaling uncertainty and potential for further divergence.
Despite the “hawkish cut,” the market interpreted it cautiously, especially with falling UK economic momentum and weak retail data.
💴 Bank of Japan:
BoJ is slowly tightening policy — signaling an eventual exit from ultra-loose conditions.
Real interest rates remain negative, but the direction is now incrementally hawkish, strengthening the JPY across the board.
💡 Market Sentiment:
VIX at 20.42 = Risk-Off Environment → capital flows into safe-haven JPY, out of GBP.
With Nasdaq bullish, but volatility ticking up, JPY benefits from its safe-haven role.
📊 CFTC Positioning:
GBP: Longs decreasing, shorts rising, NNCs decreasing → Bearish bias
JPY: Longs flat, but massive drop in NNCs → institutional positioning is turning defensive
🧾 Economic Weakness:
UK Services PMI showing signs of stagnation
CPI and Retail Sales remain weak, suggesting limited scope for further GBP upside
Japan's latest Household Spending and Economy Watchers Survey show stabilizing conditions, supporting yen strength
📌 Final Take:
Fundamentals support the breakdown as monetary divergence and global sentiment drive capital into the JPY. Watch for confirmation via H4 close below 195.30 before entering the trade.
🧭 Trade idea aligns with macro, technicals, seasonality, and institutional flows.

Gold Weekly Outlook. 03.08.2025, SundayCOMEX:GC1!
Expecting a run up to daily BPR. Previous weekly closure suggesting bullish price action on Gold. Paytience is the key

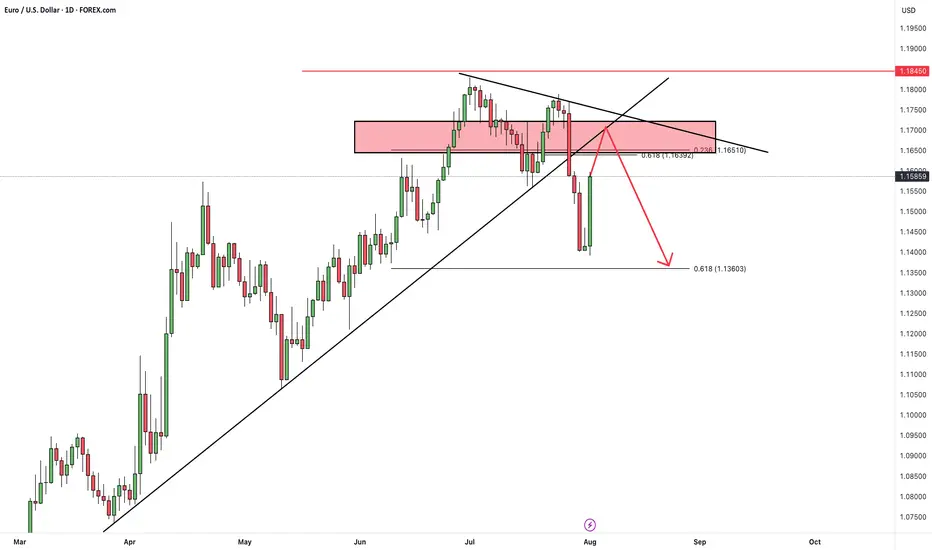
EURUSDHello Traders! 👋
What are your thoughts on EURUSD?
After last week's sharp decline, EUR/USD rebounded slightly on Friday, initiating a corrective move to the upside.
We anticipate this retracement to extend over the next few days, likely reaching the broken trendline and former support zone, which now acts as resistance.
As long as the pair remains below this resistance area, the bearish outlook remains valid.
Once the pullback is complete, we expect renewed downside pressure toward the next support levels.
💬 Is this just a corrective move before another leg down? Let us know your thoughts below! 👇
Don’t forget to like and share your thoughts in the comments! ❤️
XAUUSD Weekly Outlook – August 4–8, 2025New Month. New Week. New Questions.
Will the market reward hesitation — or bold reaction?
Will POTUS pump price with policy noise, or will smart money fade the manipulation?
August is historically a quieter month for hedge funds — but don’t mistake silence for safety. It's also the time when the Fed retreats to Jackson Hole, reflecting and recalibrating. Will September bring another rate cut… or another twist?
Stay sharp. This isn’t a month to sleep on.
"Last week's game plan played out nearly to perfection — well, almost! Let’s dive in and break down where gold could be headed next week."
Gold kicks off August with a strong breakout above $3360, powered by a weakening U.S. dollar, rising global risk appetite, and persistent institutional demand. With Jackson Hole on the horizon and shifting Fed expectations, volatility is set to spike. The big question: will gold extend above premium, or retrace to rebalance?
After the last rejection near 3440, price broke cleanly below its ascending channel. Now, gold appears to be forming a potential lower high around the broken trendline — a rejection here could trigger a drop toward the key $3250 support zone.
🟡 XAUUSD – August Macro Outlook
💰 Price: $3362
📅 Date: August 3, 2025
📈 Bias: Bullish but extended — high in premium
🔸 Monthly Overview
📊 Trend: Bullish continuation (CHoCH April 2023)
🧱 Supply Zone: 3350–3439 → monthly wick trap
⚠️ RSI 80+, price nearing 100% Fib extension
🔮 Breakout above 3439 → 3505 / 3610 next
🔻 Rejection → pullback to 3270 / 3180
🔸 Weekly Outlook
💥 Structure: Strong bullish, EMA stack intact
🟥 Final HTF Supply: 3350–3439 (currently testing)
🟦 Demand Below: 3270 → 3215 → 3070
🎯 Targets if breakout: 3505 → 3560 → 3610
🔸 Daily Structure
⚔️ Now testing: 3355–3375 → last valid supply
🎭 Above that → internal trap at 3398–3412
🧨 Final ceiling at 3430–3439 — breakout or reversal?
🔸 H4 / H1 Key Zones
🟥 Supply: 3360–3375 / 3385–3398 / 3430–3439
🟫 Flip Long Zone: 3322–3310
🟦 Bullish Demand: 3285–3260 → 3222–3205
⚠️ RSI elevated, watch for reaction not breakout
🔹 Execution Plan
✅ Above 3439 → Expansion to 3505 / 3610
🔁 Pullback to 3325 / 3285 → Sniper long zones
🔻 Rejection from 3375 → Short scalp → Target 3320
📌 3439 = Key Monthly Pivot
🟢 Hold above → New expansion wave
🔴 Fail below → Retrace toward value
Extended:
🔸 Scenario 1: Breakout and Expansion
If bulls push through 3375 with conviction and break above 3439, gold enters a fresh leg of macro price discovery. This would activate a clean expansion path toward:
3405 (short-term extension)
3505 → 3560 → 3610 (Fibonacci projections)
3740 (full trend extension if momentum persists)
This scenario requires solid bullish confirmation, especially on H4 or D1 structure. Traders should look for LTF OB re-entries or bullish flags above 3350 to join the trend safely.
🔸 Scenario 2: Rejection and Retrace
If gold rejects from the 3360–3375 zone and fails to hold above it, a controlled retracement is likely. Key downside targets include:
3325 → first flip zone for re-entry
3285 → origin of the latest rally (strong buy zone)
3215–3180 → high-timeframe demand and imbalance fill
Only a breakdown below 3260 would threaten the bullish structure and shift bias toward neutral or bearish.
🔸 Conclusion
Gold is approaching its inflection point. The macro trend is intact, but momentum is stretched, and the market now demands clear validation.
📌 3439 remains the weekly pivot:
Above → Expansion toward 3500+
Below → Retracement to reclaim value
For next week, the most probable path is early consolidation inside 3360–3375, followed by a decisive reaction — either continuation toward 3405+, or a corrective drop toward 3325/3285 to reset structure.
Disclaimer: For educational context only.
#XAUUSD #Gold #SmartMoney #TradingAnalysis #SMC #USD #GoldOutlook

A lose Cycle! Sell The Bottom, Buy The Hype!? Why Do You Buy When Everyone Else Is Terrified?
What drives us to make the exact opposite of a rational decision?
Is a crashing market truly a buying opportunity or just a trap?
Hello✌️
Spend 2 minutes ⏰ reading this educational material.
🎯 Analytical Insight on Bitcoin :
BINANCE:BTCUSDT has created strong liquidity with this recent pullback 📉 and is now testing a key daily support level. I’m looking for a potential bounce of at least 5%, targeting around $119,000, near a significant daily resistance 🚀.
Now , let's dive into the educational section,
🌀 Retail Traders: Victims of Hype, Fear, and Noise
Most casual traders sell during a dip, not because of a plan but because of panic. As soon as they see red candles flooding the chart, they react emotionally, not logically. Then, when prices rally and social media is buzzing, they jump back in, usually at the worst possible time. This cycle of buying tops and selling bottoms isn’t random. It is driven by crowd psychology, and unless you recognize it, you’ll keep falling for the same trap again and again.
🧭 No Strategy or Stop Loss Means You’re Gambling
If you enter a trade without knowing where you'll exit, you’re not trading. You’re guessing. A strategy is not optional. It is your foundation. Proper take-profit and stop-loss levels are what keep emotions out of the equation. Traders without a plan either take profits too early or hold onto losses too long, hoping they’ll bounce back. This isn’t trading. This is gambling with extra steps.
🔍 Technical and Fundamental Analysis Work Best Together
Only reading charts without understanding the asset means you're blind to context. Only studying the fundamentals without watching price action means you’re missing timing. Technical analysis helps you pinpoint when to act. Fundamental analysis tells you why to act. The best traders blend both. You find the "what" through fundamentals, and the "when" and "how" through technicals.
⚠️ Buying the Hype and Selling the Panic Hurts
Markets swing between extremes. When your favorite coin is pumping and influencers are screaming 🚀🚀 it might be too late. That is often when smart money exits and retail rushes in. On the flip side, when everyone is doom-posting and charts are dripping red, that is when opportunity quietly appears. But only if you’ve done your homework. It’s not about being a contrarian. It’s about being informed.
🛠 Useful TradingView Tools to Avoid Getting Tricked
To avoid emotional decisions, there are a few essential tools in TradingView that every trader should get familiar with:
Volume Profile
Shows you where the highest buying and selling activity has occurred. It helps reveal the zones where whales might have entered the market.
Fear & Greed Indicator
Gives you a quick sense of the market’s emotional state. When everyone’s afraid, it might just be the right time to start thinking about buying.
Divergence Scanner
Helps you spot potential price reversals before they happen by detecting divergences between price and momentum.
Alerts
Stop checking the charts 24/7. Set alerts on key resistance and support levels so you only react when it actually matters.
Multi-Timeframe Analysis
Don’t stay locked into the 15-minute chart. Use daily and weekly timeframes to understand the bigger picture and avoid short-term noise.
🎯 Final Thought and Recommendation
In this market, the winners aren’t the fastest. They are the most prepared. Build your strategy, manage risk with stop losses, blend technical with fundamentals, and most importantly, don’t let the crowd think for you.
✨ Need a little love!
We pour love into every post your support keeps us inspired! 💛 Don’t be shy, we’d love to hear from you on comments. Big thanks , Mad Whale 🐋
📜Please make sure to do your own research before investing, and review the disclaimer provided at the end of each post.

TSLA Weekly Bearish Play — August 2, 2025
🔻 **TSLA Weekly Bearish Play — August 2, 2025** 🔻
🚨 **Multi-Model Consensus Signals a Tactical Put Opportunity**
### 🔍 Market Snapshot:
* **Daily RSI:** 39.9 (Bearish)
* **Weekly RSI:** 53.2 → Falling
* **Volume:** Weak (0.8x last week)
* **Options Flow:** Neutral (C/P Ratio \~1.04)
* **VIX:** 20.38 → Favorable for Options Plays
* **Institutional Support:** Weak
---
### 🔮 Model Consensus:
📉 **All major models (xAI, Google, Claude, Meta, DeepSeek)** confirm:
* Bearish momentum on both daily + weekly RSI
* Weak volume = cautious institutional behavior
* Volatility setup perfect for short-dated puts
---
### 🎯 Viral Trade Setup:
**💥 Trade Type:** PUT (Short TSLA)
**🔻 Strike:** \$300
**📆 Expiry:** 2025-08-08
**💰 Entry Price:** \$6.65
**🎯 Target Exit:** \$10.64 – \$13.30 (60%-100% gain)
**🛑 Stop Loss:** \$3.99
**📊 Confidence:** 65%
**📍 Entry Timing:** Monday open
**🕒 Signal Timestamp:** 2025-08-03 01:33:56 EDT
---
### ⚠️ Key Levels:
* Support to watch: **\$297.82**
* News/event risks: Stay alert ⚡
* Use tight risk controls for weekly plays!
---
🔥 **If you trade TSLA — don’t sleep on this one.**
Bearish consensus + clean setup = **high-probability weekly play.**

Ethena Bullish Momentum Builds, Eyes 30% Rally to $0.85Hello✌
Let’s analyze Ethena’s upcoming price potential 📈.
BINANCE:ENAUSDT has demonstrated strong bullish momentum recently, supported by positive fundamental developments 📈. The price is currently near key daily and Fibonacci support levels. If these hold, a potential 30% upside targeting $0.85 looks likely 🚀.
✨We put love into every post!
Your support inspires us 💛 Drop a comment we’d love to hear from you! Thanks , Mad Whale

Watch Uniswap’s $10 Defense For 16% Breakout Toward $12.5Hello✌
Let’s analyze Uniswap ’s upcoming price potential 📈.
BINANCE:UNIUSDT is currently trading near a key confluence zone that includes the psychological round number of 10, a daily timeframe support level, and a Fibonacci retracement area. If this zone holds, there is potential for a 16% upside move toward the 12.5 level , making it a setup worth monitoring in the coming sessions. 📊🔍
✨We put love into every post!
Your support inspires us 💛 Drop a comment we’d love to hear from you! Thanks , Mad Whale

The Great Trap: How Billionaires Are Winning, and You're Not!The Great Crypto Trap: How Billionaires Are Winning—And You're Not
The ETFs, Saylor, and all of Trump's billionaire friends are getting richer—thanks to crypto.
Meanwhile, most retail traders are just trying to stay above water. Leverage trades are wiped out, charts feel rigged, and the market makes you feel like you're swimming against a riptide.
Why?
Because these rich guys have a plan: manipulate you and take your money. That’s how they stay rich.
Understanding their strategy is the first step to stop being their exit liquidity.
🧠 The New Battlefield
Crypto is no longer a playground for cypherpunks and tech rebels. It’s fully institutional now. We're not just trading against whales—we're fighting the same entities that own the media, control Wall Street, and write the rules.
So forget the old ways of thinking. The tables have turned.
🗓 The Sunday Rekt Routine
To maximize destruction, they need to avoid friendly fire. So they pump on the weekend when retail is free and optimistic, then dump on Monday to close the CME gap—like clockwork.
The playbook:
Weekend: Pump. Trap your long.
Monday: Dump. “Fill the gap.” Liquidate everyone.
Response:
Don’t fall for weekend FOMO. Exit Sunday afternoon. Wait until Tuesday to re-enter, once Monday’s high and low are set. Trade smart, not emotional.
📈 Top-of-the-Market FOMO
You’ve seen it before. Just before the crash, the media frenzy begins. Influencers say “Don’t miss this pump!” or “99% will miss the next big move!” The ETF gods hint at new inflows. It's a setup.
They're not hyping it for your benefit—they're offloading their bags in your face.
Just look at the charts:
BlackRock bought billions to drive BTC to 121K.
Then, in 72 hours, they dumped billions.
Saylor? Silent. No new buys. That’s not coincidence—it’s coordination.
Response:
Check the MACD, RSI, and Stochastic RSI on daily or weekly timeframes. If they're maxed out and the influencers are screaming green—it’s probably too late.
When they stop buying, the dump is already planned.
🧰 How to Outsmart Them
Watch the MACD for crossovers and divergence.
Monitor RSI zones—don’t long into extreme overbought conditions.
Use Stoch RSI to anticipate momentum shifts.
Rule: When everything is overheated, and FOMO is peaking—step back. Let them dump into each other. You’ll get your entry later, cleaner and cheaper.
⚔️ This Is War
Make no mistake: this is a war for your money.
They want yours. You want theirs.
Only the smart survive.
To be continued.
DYOR.

mBos 15mWe came to 4h OB, swiped some liquidity and received a reaction. Expectations for the price to return back to the wick and continue up to take the liquidity there. As there is no break on the HTF, it is a trade with higher risk.
Entry on the test of 15m wick. Stop below wick. Take on the swim of EQH

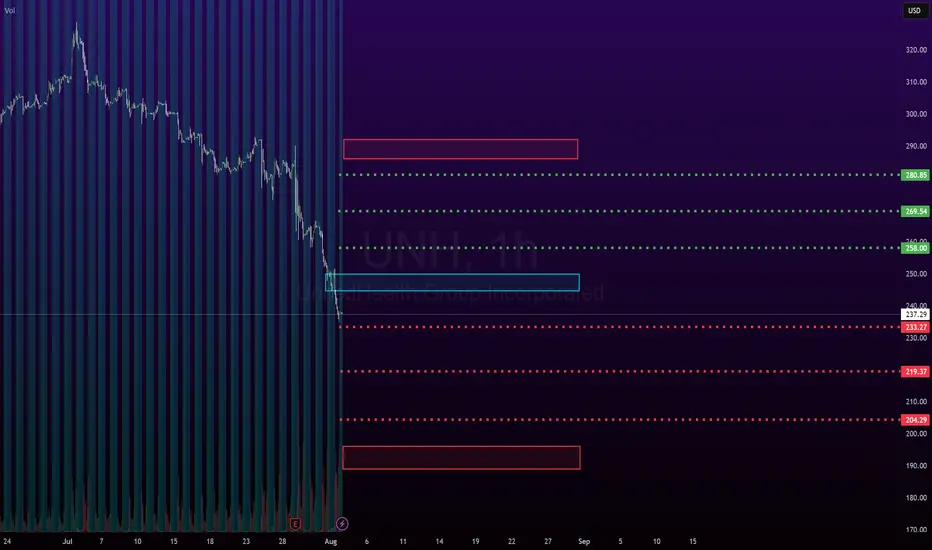
UNH: Monthly outlook UNH is an interesting case study, fundamentals vs technicals vs math.
If you were sleeping, here are the cliff notes on UNH:
UNH is alleged to have commited the following violations/criminal offences
Medicare Overbilling: The U.S. Department of Justice has accused UNH of overcharging Medicare by more than $2.1 billion, allegedly by manipulating diagnosis codes to inflate payments.
Securities Fraud: A class action lawsuit claims UNH misled investors by denying coverage to boost profits, which allegedly contributed to a sharp drop in stock value.
Undisclosed Payments: Reports suggest UNH made secret payments to nursing homes to reduce hospital transfers, potentially compromising patient care.
How did it come to light, you ask?
From whistleblowers, investigative journalists and a DOJ probe (department of justice).
While the investigation is ongoing, if they are found guilty of any or all of these allegations, the penalties could be:
Billions in fines
Civil damages
Criminal charges
Sanctions that can fundamentally interfere with how they do/conduct business
With that out of the way, ask yourself: Am I buying this while there is an ongoing criminal investigation that could very well result in the insolvency of an organization?
I know a lot of people think the charts tell the news, but something this serious unfortunately can't be foretold by a chart, in my opinion.
But let's humour the fallacy that these traders have, and entertain whether or not UNH could theoretically be a buy.
Technicals:
Oversold, obviously.
No clear bottom pattern.
No clear chart pattern at all.
Massive investor exodus, with the current selling volume being almost as much as the flash crash we had the beginning of this year and the third highest in UNH's long, long life on the NYSE.
Math:
While UNH is below is quadratic mean, it has not triggered a bullish mean reversion signal yet.
Forecast into next week is bullish with some upside bouncing expected.
Mid term forecast (over the next month) has it coming down to 220.
The math levels are posted in the chart and 220 is actually the second low target on the month, so that's interesting.
This will go lower obviously if guilt is found or damming evidence comes forth in the media over the next days. I say this because UNH popped up on my sweep alerts. Four (4) very large option orders have popped up on my order flow screener for UNH, totaling over 7 million in short premiums (puts).
First is the 480 put strike expiry 08-15 of this year with 4.2 million in premiums bought.
Second is the 530 put strike, expiry 09-19 of this year with 634 k in premiums bought.
Third is the 540 put strike, expiry 09-19 with 815 k of premiums bought.
Last is the 600 put strike, expiry 01-16-2026 with 554 k of premiums bought.
This obviously has me interested that someone knows something about stuff.
But this is not advice, just reporting what I see.
Safe trades everyone!
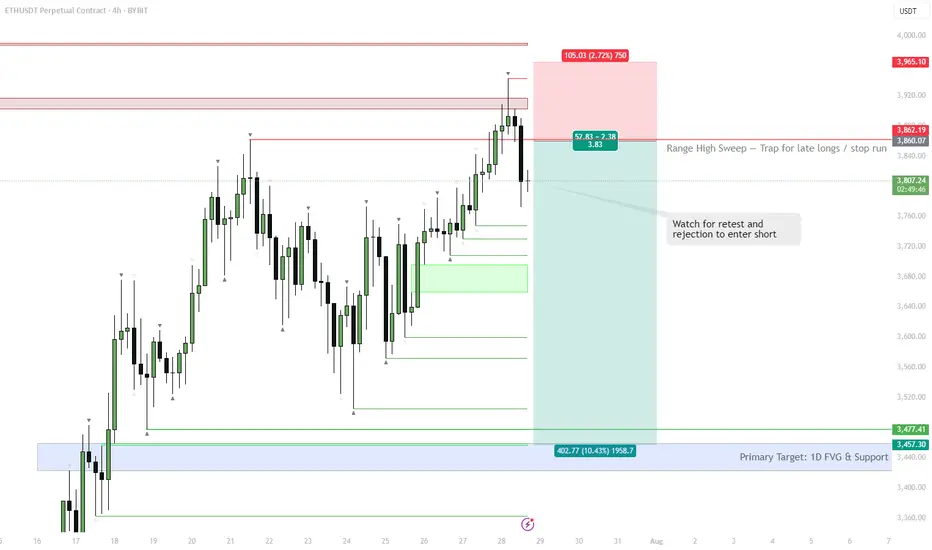
ETH | #4h #short — Range High Sweep & Short SetupScenario:
ETH swept the range high at $3,860, trapping late buyers and triggering stops. Watching for a retest of this level — if it holds as resistance and we see rejection, that’s a short trigger.
Target:
Main target is the 1D FVG at $3,457–$3,477. Possible extension: sweep of range low if selling accelerates.
Why:
Failed breakout setups are classic mean reversion triggers, especially when supported by a visible liquidity pool (FVG) below.
Plan:
Wait for a retest and rejection to confirm short. Partial TP at the FVG zone, manage risk above the sweep high.