XAUUSD Daily Outlook – August 4, 2025We’re not in breakout. We’re deep in premium — and supply is stacked.
—
Gold is now trading at 3362, sitting right inside the first valid daily supply zone — the same block between 3355 and 3375 that caused the last rejection. The bullish rally from 3272 was clean: liquidity sweep, CHoCH, imbalance filled, HL confirmed. Bulls did their job. Now they’re walking straight into pressure.
Above this zone, things don’t get easier — they get trickier.
Just a bit higher, we have an internal supply trap between 3398 and 3412. It’s a reaction zone built from imbalance and inducement — not strong enough to hold a reversal on its own, but perfect to fake out breakout buyers. If price pushes through 3375 and enters this pocket, snipers should be watching carefully for early signs of weakness.
And finally, at the top of the current structure sits the HTF supply trap at 3430–3439 — the last weekly wick, the macro reversal zone. That level is sacred. If price makes it there, either we’ll see full-blown expansion… or a violent reversal born from overconfidence.
So what do we do now?
We wait.
If price starts to reject from this 3355–3375 supply with bearish intent, we target the flip reentry zone at 3318–3328 — the previous CHoCH break and dynamic EMA cluster. That’s your first intraday long trigger if bulls want to come back strong.
If that breaks, next is the demand base at 3287–3267, the origin of this entire bullish move. Below that? Imbalance support near 3225 — the final line before structure shifts.
—
🟥 Valid Supply Zone → 3355–3375
🟥 Internal Supply Trap → 3398–3412
🟥 HTF Supply Trap → 3430–3439
🟫 Flip Reentry Zone → 3318–3328
🟦 Demand Base → 3287–3267
🟦 Imbalance Support → 3225–3205
—
This isn’t a breakout. It’s a build-up inside premium.
The smartest move today might be no move — until structure speaks.
—
Are you watching for the rejection? Or the breakout trap?
Let us know your bias below 👇🏼
Tap that ❤️ if this gave clarity, and follow GoldFxMinds to stay ahead of every key level — no noise, just structure.
—
With sniper calm and strategic clarity,
GoldFxMinds 💙
Disclosure: Analysis based on Trade Nation TradingView chart feed.
Beyond Technical Analysis

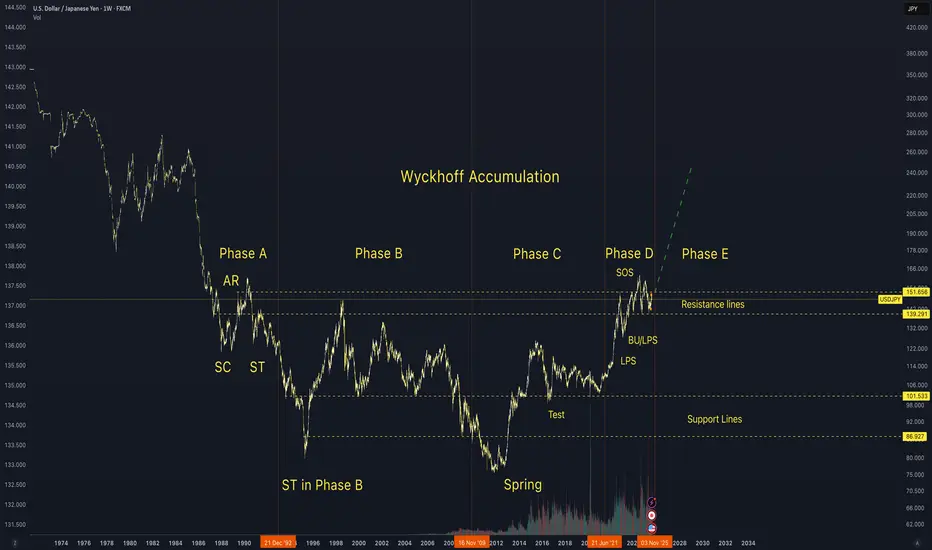
USD/JPY Wyckhoff Accumulation on weekly Chart Looks like a fairly textbook Wyckhoff accumulation on the USD/JPY Pair and looking ready to move up and to the right soon.
Continued recovery, positive after NFP news✍️ NOVA hello everyone, Let's comment on gold price next week from 08/04/2025 - 08/8/2025
⭐️GOLDEN INFORMATION:
Gold prices surged over 1.5% on Friday, climbing toward $3,350, as a weaker-than-expected U.S. Nonfarm Payrolls (NFP) report signaled a faster-than-anticipated slowdown in the labor market. Heightened geopolitical tensions between the U.S. and Russia further boosted safe-haven demand for the precious metal.
Following the disappointing July jobs data, markets began pricing in a potential interest rate cut by the Federal Reserve. While the Unemployment Rate held relatively steady, signs of labor market softness supported recent comments from Fed officials Michelle Bowman and Christopher Waller, who advocated for a 25-basis-point rate cut at the July 29–30 meeting.
Additional data added to the cautious sentiment: the ISM’s July report confirmed that U.S. manufacturing activity remains in contraction territory, while consumer confidence took a hit, according to the University of Michigan’s latest survey.
⭐️Personal comments NOVA:
Gold prices continue to be positively affected after last week's NFP news, market expectations of an early rate cut are rising
🔥 Technically:
Based on the resistance and support areas of the gold price according to the H4 frame, NOVA identifies the important key areas as follows:
Resistance: $3384, $3434
Support: $3331, $3307, $3268
🔥 NOTE:
Note: Nova wishes traders to manage their capital well
- take the number of lots that match your capital
- Takeprofit equal to 4-6% of capital account
- Stoplose equal to 2-3% of capital account
- The winner is the one who sticks with the market the longest

XAUUSD Weekly Outlook – August 4–8, 2025
The question isn’t whether gold is strong. The question is — will price expand, or rebalance?
🔸 Macro Overview
Gold begins the week consolidating just below its final HTF supply zone (3439), while USD weakens amid mixed macro data and growing speculation of future rate cuts. Markets await fresh catalysts, and gold’s recent impulsive rally is now facing the big test: break the wick, or pull back?
🔸 Weekly Structure & Bias
Element Observation
🔹 Trend Bullish continuation — clean structure
🔹 Last BOS March 2025 — impulsive, with imbalance below
🔹 Price Action Top wick rejection forming near 3439
🔹 Bias Still bullish, but entering exhaustion zone
🔹 RSI Above 70 — overheated
🔹 EMAs EMA5 > EMA21 > EMA50 > EMA100 — perfect trend
🔸 Key Weekly Levels (Zones + Confluences)
Zone Type Price Range Confluences
🔴 Supply 3350 – 3439 HTF wick supply + FVG + RSI 70+ + liquidity trap
🔵 Demand 3270 – 3215 Weekly OB + FVG + EMA21 support
🔵 Demand 3120 – 3070 Old BOS + deep FVG + psychological level
🟢 Support 3000 zone EMA50 + historical consolidation
🔸 Fibonacci Extensions (Above 3439)
Extension Level Price Target Confluences
1.0 (Swing Full) 3439 Supply wick high
1.272 3505 Next psychological milestone
1.414 3560 Mid-extension + liquidity
1.618 3610 Golden expansion target
2.0 3740 Full trend extension (max)
🔺 These levels serve as potential breakout targets ONLY if we get a confirmed weekly close above 3439 with clean BOS on LTF.
🔸 Weekly Scenarios
🟢 Scenario 1 – Break and Expand
If gold breaks 3439:
Expect clean continuation to 3505 → 3560 → 3610
Best entries come from new OBs on H4/D1 around 3350–3370
Follow momentum — but don’t chase without retrace confirmation
🔻 Scenario 2 – Rejection + Retracement
If price holds below:
Pullback toward 3270 – 3215 expected
EMA21 acts as dynamic support
If selloff gains strength, next demand = 3120 – 3070
🎯 This zone aligns with macro OB + re-entry for long-term bulls.
🔸 Conclusion & Gameplan
Gold is pressing against its final weekly ceiling.
Structure remains bullish, but every sniper knows — at the edge of premium, timing is everything.
✅ Above 3439 → expansion opens to 3505 → 3560 → 3610
🟦 Below 3439 → retracement into 3270 → 3215 → 3070
The best setups will be born from confirmation, not prediction. Let the market decide.
—
What would you do if 3439 rejects hard this week?
Comment your plan, tag your sniper level, and let’s stay ahead together 💬
—
With clarity, confidence, and perfect timing,
GoldFxMinds 💙
Disclosure: Analysis based on Trade Nation (TradingView) chart feed.
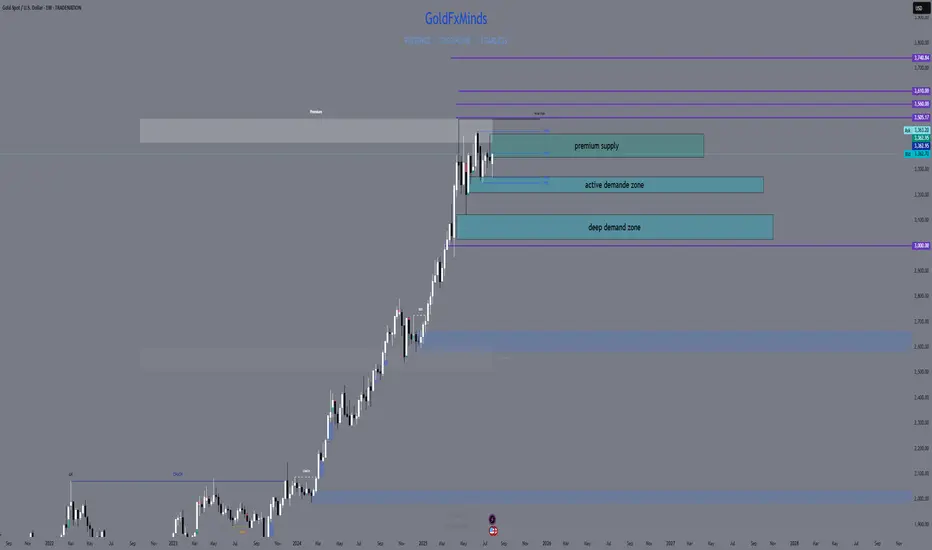
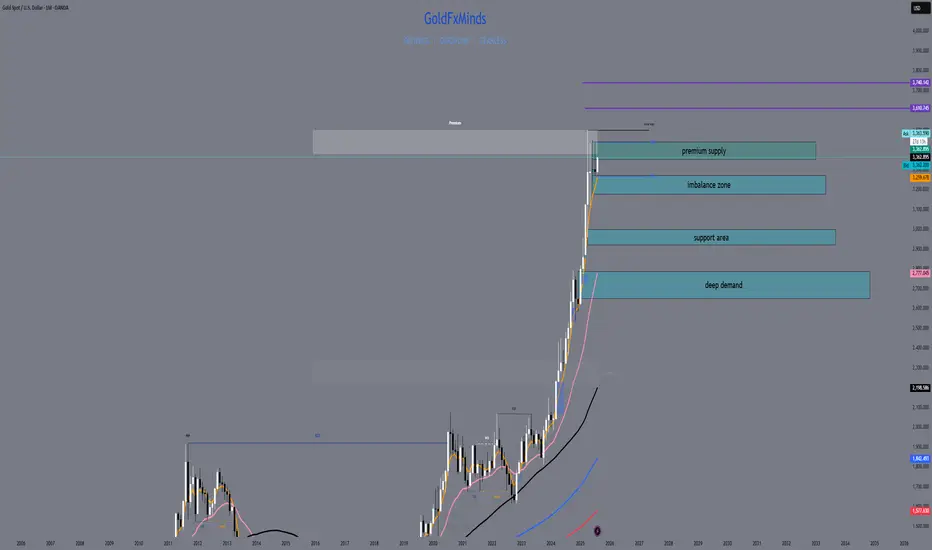
XAUUSD August 2025 Monthly OutlookWelcome to August — and welcome to the top of the macro ladder. Gold is not just rising. It’s rewriting structure.
🔸 Macro & Fundamentals
Gold opens August with a fresh impulsive breakout above $3360, fuelled by a weaker USD, rising global risk sentiment, and continued speculative positioning from institutional buyers. The upcoming Jackson Hole meeting and shifting Federal Reserve expectations create the perfect climate for volatility. All eyes are now on the premium structure top — but will gold expand beyond it or retrace to refill?
🔸 Monthly Trend & Bias (HTF Overview)
🔹 Structure: Clean bullish BOS, continuation leg in progress
🔹 Last CHoCH: April 2023 → Confirmed full trend shift bullish
🔹 Current Monthly Candle: Explosive push into supply with top wick rejection beginning to show
🔹 Bias: Still bullish but in extreme premium — watch for cooling/rebalancing
🔸 EMA Structure
| EMA Type | Status | Signal |
| ----------- | -------------- | ------------------------------------- |
| EMA 5 / 21 | Strong Bullish | Dynamic expansion, steep angle upward
| EMA 50 | Below | Clean breakout from range
| EMA 100/200 | Far below | Long-term uptrend deeply intact
🔸 Key HTF Levels (Wick-to-Wick Mapping)
Zone Type Price Range Confluences
🔴 Premium Supply 3350 – 3439 Monthly FVG + Wick exhaustion + RSI 80+
🔵 Bullish Imbalance 3180 – 3270 Monthly FVG + old BOS + EMA5 baseline
🔵 Mid-Level Support 2920 – 3000 Monthly OB + FVG + structure base
🔵 Deep Demand 2670 – 2780 HTF equilibrium zone + RSI support
✅ The current candle has pierced into the final wick supply, but with clear signs of loss in momentum.
⚠️ If 3439 breaks cleanly, next expansion zone opens toward 3505 → 3610 (Fibonacci projection). Otherwise, expect cooling to 3270–3180 first.
🔸 Fibonacci Context
🔻 Swing Low: 1810
🔺 Swing High: 3439
🎯 Current price ($3363) sits just below the 100% Fibonacci projection, with the 1.272 and 1.618 extensions at 3610 and 3740.
This confirms we are in a macro premium, and any long positions from here forward must be built only on strong LTF confirmation or clean pullbacks into value.
🔸 August Scenarios
🟢 Scenario 1 – Breakout + Price Discovery
If bulls break 3439 with strong volume and close:
New leg toward 3505 → 3610 opens
Watch for LTF continuation on H4–D1 with bullish OB reentry
Only valid if 3350 holds as new support
🔻 Scenario 2 – Rejection + Healthy Pullback
If price holds below 3439 and monthly wick exhausts:
Clean retracement toward 3270 → 3180 expected
EMA5/21 rebalancing will support bullish structure
Deeper rejection could retest 3070 zone if volatility spikes
🔸 Conclusion & Action Plan
We open August fully inside the last monthly supply zone. Trend is still bullish, but RSI, FVGs, and EMA distance warn us: this is not the time to chase — it’s time to wait for structure to speak.
📌 Key pivot = 3439.
Above it → Expansion.
Below it → Retracement.
Let August unfold — but stay sharp. The next big move will be born from this compression.
—
What’s your take — are we just getting started or about to cool off?
Drop your thoughts, chart it out, and stay ready for what August brings. ⚔️
—
❤️ Like if you enjoy clean, actionable updates🚀🚀🚀
🔁 Share with traders who love structure over noise
With clarity, confidence, and control,
GoldFxMinds
ETH Approaching Major Resistance – Expecting Pullback Hello guys!
Ethereum has been rallying strongly within a well-respected ascending channel, pushing past key levels and now approaching a major resistance zone around $3,900–$4,000.
According to the chart structure, it looks like price could soon react from this resistance, leading to a pullback into the $3,000–$3,200 demand zone, which aligns with the midline of the channel.
This would be a healthy correction before potentially continuing the bullish trend and attempting a clean breakout toward new highs.
ETH is still bullish, but it may need to retest support before continuation.
Watch for a bounce from the $3,000–$3,200 zone for a high-probability long opportunity.

why not eh doodling on the chart, I can change my mind depends on how price moves
key levels and 4 trendlines to gauge the stenght of the waves

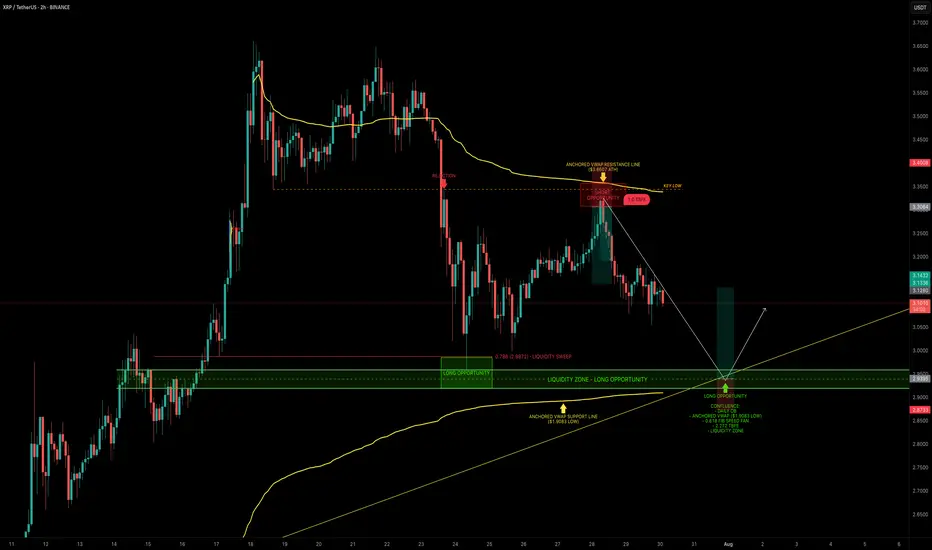
XRP — Mapping Out the Next High-Probability Long SetupXRP continues to respect key levels, delivering clean setups and strong technical reactions.
📉 Recent Price Action Recap
After the flush from $3.65 into the $3.00 support zone, XRP printed a solid bounce back toward the $3.30 resistance area, forming a clean short setup between $3.30–$3.35.
Price is now trading mid-range within the 6-day consolidation.
🟢 Next High-Probability Long Setup
A prime long opportunity lies between $2.96 and $2.9175 sitting within a key daily order block.
Confluence at this zone includes:
Liquidity pool just below the $2.9555 swing low
Anchored VWAP from the $1.9083 swing low resting just under the block
0.618 Fib Speed Fan lining up as dynamic support (July 30 – Aug 2)
2.272 Trend-Based Fib Extension at $2.9297
📈 Long Trade Setup
Entry Zone: $2.96 – $2.9175
Stop Loss: Below anchored VWAP (clear invalidation)
Target: $3.1/$3.13+
R:R: ~1:3+
💡 Educational Insight
This setup is a great example of how multiple tools layered together (like Fibonacci levels, VWAPs, order blocks and liquidity zones) can significantly increase the probability of a trade playing out.
When structure, volume-based tools and time alignment all point to the same area, it creates a high-confluence trade zone. These are the areas where risk is most defined and reward is most favourable, a principle every technical trader should anchor their strategy around.
_________________________________
💬 If you found this helpful, drop a like and comment!
Want breakdowns of other charts? Leave your requests below.

XAUUSD Live Trade with 11,641 USD ProfitsI managed to ride the momentum last night on XAUUSD and made over 11,641 usd profit on a live trading account. Gold usually create a range. It will create a top and a bottom then it will spend most of its time inside that range. That is pretty much how XAUUSD moves. If you can identify the top and the bottom then you can short it from the top and do a long trade on the bottom. The price will just travel from bottom to top and top to bottom. You can scalp your way to profits on this move if you can time it properly. Once in a while, a break from the top or the bottom happens. This is where you switch from trading the range to trading breakouts.
When you trade breakouts, you must trade it with the knowledge that less than 15 percent of breakouts are successful. Failed breakouts are very common. You need to have some form of stoploss below your breakout levels. You will know that the breakout fails once your stoploss is hit. If the breakout is successful then ride it. Do not put some TP (target price or take profit price) rather just trail your profits. Move your stops a few pips behind the price. Just enough distance to let the price breathe. If the price reverses then it will hit your stops. If the breakout is strong then you will ride it for a while until it reverses.
It will form another top and bottom again and move inside that range. Switch your approach again in trading long trades near the bottom and short trades near the top.
Just remember to always have some stoploss on every trade and never try to predict what the market will do or how the price will move. Let the market do its thing and just react to its movements.
Goodluck on your trades.
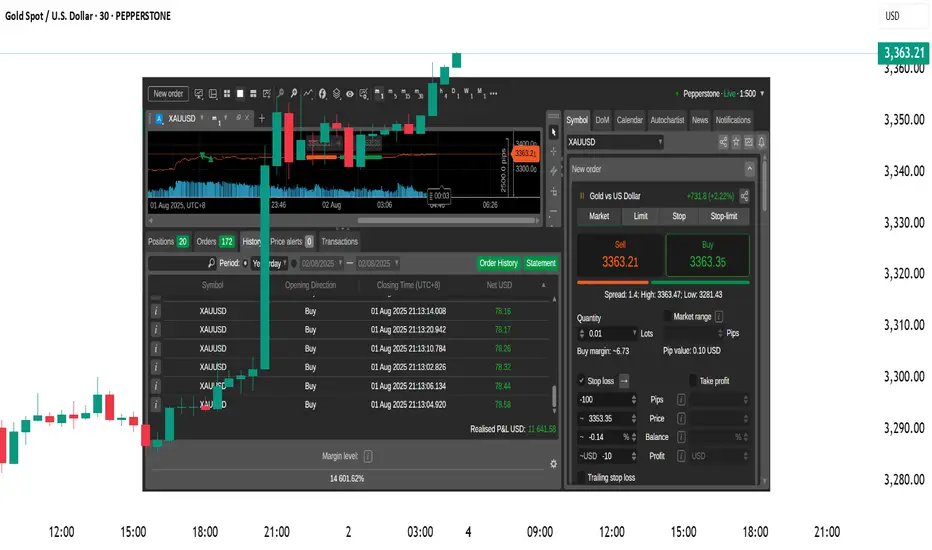
XAUUSD Live Trade Last Night (Killed it with 11,641 USD Profits)I managed to ride the momentum last night on XAUUSD and made over 11,641 usd profit on a live trading account. Gold usually create a range. It will create a top and a bottom then it will spend most of its time inside that range. That is pretty much how XAUUSD moves. If you can identify the top and the bottom then you can short it from the top and do a long trade on the bottom. The price will just travel from bottom to top and top to bottom. You can scalp your way to profits on this move if you can time it properly. Once in a while, a break from the top or the bottom happens. This is where you switch from trading the range to trading breakouts.

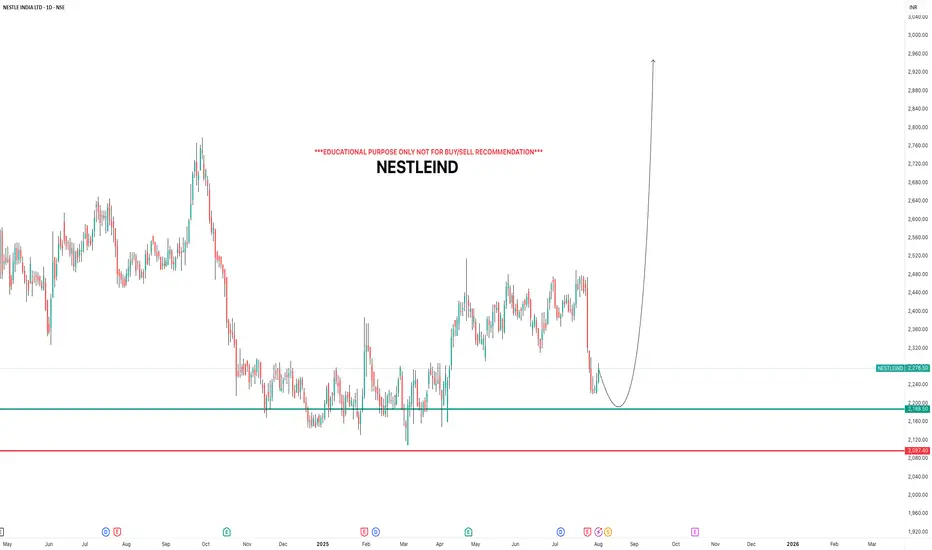
NESTLEINDIAi Observed these Levels based on Price Action and Demand & Supply which is my own Concept "PENDAM CONCEPTS"... Please don't take any trades based on this chart/post... Because this chart is for educational purpose only not for Buy or Sell Recommendation... Thank Q
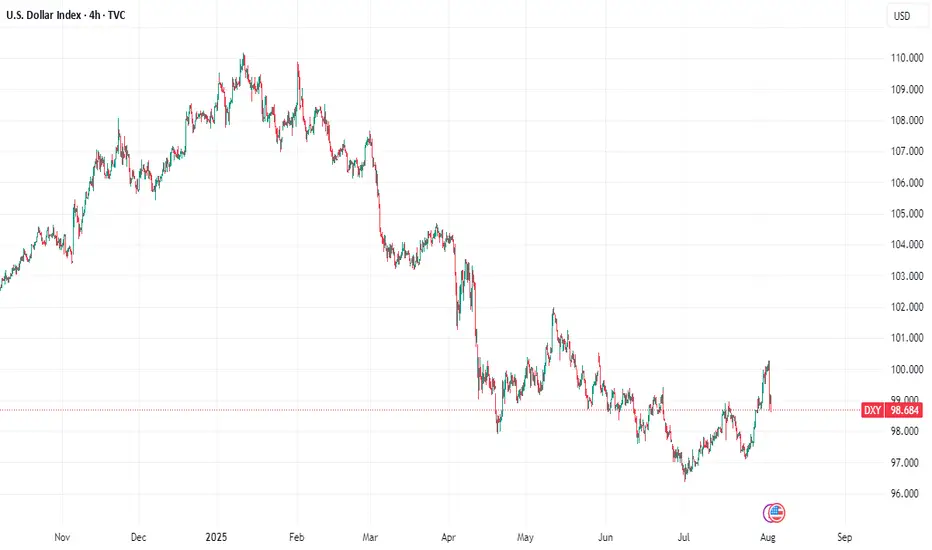
Dollar Falls as Traders Price In Two 2025 Rate Cuts on Weak JobsDollar Falls as Traders Price In Two 2025 Rate Cuts on Weak Jobs Data
Introduction
In a significant turn of events for the global currency markets, the U.S. dollar has taken a sharp tumble as traders brace for a more dovish Federal Reserve. A weaker-than-expected U.S. employment report for July 2025 has prompted market participants to price in two interest-rate cuts by the Fed before the end of the year. This shift in monetary policy expectations comes during a time of heightened global uncertainty, much of it triggered by President Donald Trump's aggressive trade policies, which have already disrupted the $7.5 trillion-a-day foreign exchange market.
The Bloomberg Dollar Spot Index, a key gauge of the dollar’s strength against major currencies, plunged as much as 1%—marking its worst single-day performance since April 21, 2025. The greenback’s decline was mirrored by strong gains in rival currencies, with the Japanese yen appreciating 2.2% and the euro climbing more than 1% against the dollar.
This article delves into the recent developments surrounding the U.S. dollar, the implications of weak jobs data, the Federal Reserve’s likely response, and how Trump’s trade policies are shaping the broader economic landscape.
________________________________________
Weak Jobs Data Sparks Policy Shift
The July 2025 employment report came in well below expectations. Non-farm payrolls growth fell short, and revisions for May and June showed fewer jobs were added than previously reported. These figures suggest that the U.S. labor market is cooling more rapidly than anticipated, raising concerns about the sustainability of the post-pandemic economic recovery.
According to Helen Given, a foreign exchange trader at Monex Inc., “It’s now clear that the U.S. labor market is cooling fairly sharply. There’s a good chance that Trump’s crusade against Chair Powell ratchets up further in the coming days, and there could be further losses for the dollar to come as a result.”
The disappointing employment data has led traders to adjust their expectations for U.S. monetary policy. Futures markets are now pricing in two 25-basis-point rate cuts by the end of 2025, a stark reversal from the earlier outlook that suggested the Fed would remain on hold or even consider tightening if inflation remained sticky.
________________________________________
The Federal Reserve’s Dilemma
The Federal Reserve now finds itself in a precarious position. On one hand, inflation has moderated in recent months, giving the central bank more room to maneuver. On the other hand, a weakening labor market could indicate a broader slowdown that might require immediate action to prevent a recession.
Fed Chair Jerome Powell has come under increasing political pressure from President Trump, who has publicly criticized the Fed for keeping rates too high. Trump argues that rate cuts are necessary to support U.S. exporters and counteract the negative effects of his own tariffs and trade restrictions.
Historically, the Fed has maintained its independence from political influence, but in an election year, the pressure to act can become intense. If the Fed moves to cut rates, it will be seen as responding to both economic data and political dynamics—a delicate balancing act.
________________________________________
The Global Currency Market Reacts
The ripple effects of the dollar’s decline are being felt across the globe. The $7.5 trillion-a-day foreign exchange market, already under strain from geopolitical uncertainty and shifting central bank policies, has seen increased volatility in recent weeks.
The Japanese yen, often viewed as a safe-haven currency, surged 2.2% against the dollar following the release of the jobs data. Meanwhile, the euro gained over 1%, reflecting investor sentiment that the greenback’s era of dominance may be waning—at least for now.
Emerging market currencies also found some relief, as a weaker dollar generally eases pressure on countries with large dollar-denominated debts. However, the overall picture remains complex, as trade tensions and capital flow volatility continue to weigh on risk sentiment.
________________________________________
Trump’s Trade Policies: A Double-Edged Sword
President Trump’s trade strategies have been a central feature of his second term in office. From imposing tariffs on Chinese imports to renegotiating trade agreements with the European Union and Canada, Trump has sought to reshape the global trading system in favor of American manufacturers.
Yet these policies have produced mixed results. While some sectors have benefited from protectionist measures, others—particularly those reliant on global supply chains—have suffered from rising costs and retaliatory tariffs. The uncertainty generated by these policies has also dampened business investment, slowed global trade, and disrupted financial markets.
“The dollar had tumbled this year as Trump’s aggressive trade policies rocked the $7.5 trillion-a-day currency market, weighing on global growth outlook,” Bloomberg reported.
Investors are increasingly concerned that continued trade friction, combined with growing political pressure on the Fed, could lead to policy missteps that undermine the U.S. economy and erode confidence in the dollar.
________________________________________
Market Implications
The dollar’s recent decline has far-reaching implications for various asset classes:
1. Equities
U.S. equities have shown mixed reactions. While lower interest rates are typically supportive of stock prices, the underlying reason—economic weakness—has investors on edge. Sectors such as technology and consumer discretionary are expected to benefit from cheaper borrowing costs, but cyclical sectors may struggle if growth slows further.
2. Bonds
Treasury yields have fallen sharply as traders anticipate rate cuts. The 10-year yield dropped below 3.8%, its lowest level in months. The yield curve has also flattened, a potential warning sign of slowing economic momentum.
3. Commodities
A weaker dollar typically supports commodity prices, as most are priced in dollars. Gold, oil, and industrial metals all saw gains in the wake of the jobs report. However, demand-side concerns stemming from a global slowdown could limit the upside.
4. Emerging Markets
For emerging markets, a softer dollar offers both relief and risk. On the positive side, it reduces debt servicing costs and can attract capital flows. On the negative side, if the dollar’s weakness reflects a broader global slowdown, risk appetite could remain subdued.
________________________________________
Looking Ahead: What to Watch
As markets digest the latest economic data and policy signals, several key developments will be closely monitored:
1. Upcoming Fed Meetings
The Federal Open Market Committee (FOMC) will meet again in September. Markets will be keenly watching for any changes in tone or new forward guidance. A rate cut in September now appears increasingly likely, especially if subsequent data confirms a labor market slowdown.
2. Inflation Trends
While inflation has moderated, it remains a key concern for policymakers. If inflation rebounds unexpectedly, it could complicate the Fed’s ability to cut rates without stoking price pressures.
3. Geopolitical Risks
Trade tensions, particularly with China and the EU, remain unresolved. Any escalation could further destabilize markets and weigh on the dollar. Additionally, developments in the Middle East, Eastern Europe, and Southeast Asia could add to the uncertainty.
4. U.S. Presidential Politics
With the 2026 presidential election campaign already underway, Trump’s rhetoric and policy decisions will continue to influence market sentiment. His ongoing criticism of the Fed could erode confidence in U.S. institutions, particularly if it leads to perceived politicization of monetary policy.
________________________________________
Conclusion
The sharp fall in the U.S. dollar following weak July jobs data marks a pivotal moment in 2025’s economic narrative. With traders now pricing in two Federal Reserve rate cuts by year-end, the stakes have never been higher for policymakers, investors, and political leaders.
While a softer dollar can provide some temporary relief to exporters and boost inflation expectations, it also reflects deeper concerns about the strength of the U.S. economy and the unintended consequences of aggressive trade policies. President Trump’s confrontational approach to global trade, combined with mounting pressure on the Fed, is creating a complex and potentially volatile environment for markets.
As the year progresses, all eyes will be on the Federal Reserve’s response, the resilience of the U.S. labor market, and the evolving political landscape. In a world where headlines can move markets in seconds, clarity, stability, and sound policy have never been more critical.
________________________________________
Disclaimer: This article is for informational purposes only and does not constitute financial or investment advice.
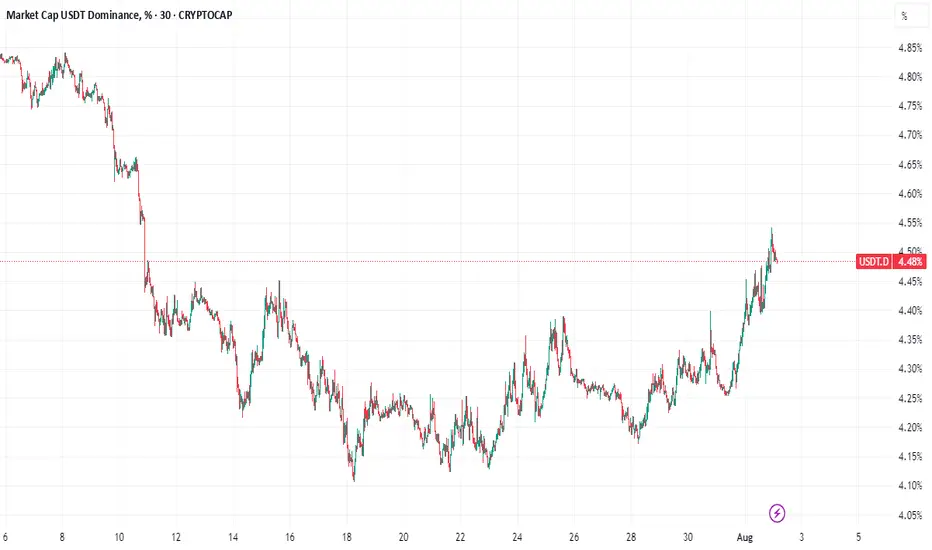
Tether Rakes in $4.9B Q2 Profit, Cementing Its Reign as Crypto’sTether Q2 Net Profit Hits $4.9 Billion, Pushing Total Earnings to $5.7 Billion: What It Means for the Crypto Industry
Tether Holdings Ltd., the issuer of the world’s largest stablecoin USDT, has once again made headlines with its Q2 2025 earnings report, revealing a staggering net profit of $4.96 billion. This brings the company’s total profits for the first half of the year to $5.7 billion—a record-breaking milestone for both the company and the broader stablecoin ecosystem.
This article explores the implications of Tether’s Q2 performance, the sources of its revenue, its impact on the crypto markets, and the growing significance of stablecoins in the evolving financial landscape.
________________________________________
A Record-Setting Quarter for Tether
Tether’s Q2 2025 results have astonished even seasoned analysts. The company’s reported $4.96 billion in net profit in a single quarter represents one of the most profitable periods in the history of any fintech or crypto-native company. What’s even more remarkable is that this profit was not driven by speculative trading or token sales, but by conservative, yield-generating strategies rooted in traditional finance.
The company’s Q1 earnings were already impressive at $0.76 billion, but Q2’s results eclipse those numbers entirely. Tether’s cumulative profit year-to-date now stands at $5.72 billion, putting it on track to potentially exceed $10 billion in earnings for the full year if current trends continue.
________________________________________
What’s Driving Tether’s Massive Profit?
Tether’s incredible profitability is primarily fueled by one key factor: the interest earned on its reserves. As the issuer of USDT, Tether is responsible for maintaining a 1:1 backing of every token in circulation. These reserves are primarily held in short-term U.S. Treasury Bills (T-Bills), reverse repos, and cash equivalents.
Here’s a breakdown of the main profit drivers:
1. High Interest Rates on U.S. Treasuries
With the U.S. Federal Reserve maintaining elevated interest rates to combat inflation, short-term T-Bills have become highly lucrative. Tether holds tens of billions of dollars in these instruments, generating billions in annual interest income.
For example, the yield on a 3-month Treasury bill in Q2 2025 averaged around 5.2%, and Tether’s reserve base has hovered near $90 billion to $100 billion. Even a conservative allocation can earn several billion dollars in annual yield.
2. Reverse Repurchase Agreements (Reverse Repos)
Tether has also expanded its use of reverse repos, which allow it to lend cash to counterparties in exchange for securities, earning a premium on the transaction. This has contributed significantly to its earnings, especially in a high-yield environment.
3. Gold Holdings and Bitcoin Exposure
Tether has acknowledged that a small portion of its reserves includes gold and Bitcoin holdings. These assets appreciated in Q2, contributing to the overall profit. While not the primary revenue source, their performance added notable value during the quarter.
4. Equity Investments
The company has begun investing in infrastructure and technology firms related to blockchain and AI. While these investments are not liquid, mark-to-market gains may have also contributed to the net profit figure.
________________________________________
A Closer Look at Tether’s Reserve Report
Tether’s Q2 attestation report, published alongside its earnings update, provides transparency into how its assets are allocated. Here are some highlights:
• Over 85% of reserves are held in U.S. Treasury instruments
• $5.4 billion in excess reserves—a buffer above the value of circulating USDT
• $3.3 billion in gold and Bitcoin holdings
• Minimal exposure to unsecured commercial paper or riskier debt instruments
Tether has continuously emphasized its commitment to transparency and risk management. Unlike in its early years, when it faced criticism over opaque reserve practices, the company now releases quarterly attestations audited by third-party firms such as BDO Italia.
________________________________________
USDT’s Growing Dominance
Tether’s profits are closely tied to the growth of its flagship product: USDT, the world’s largest stablecoin by market cap. As of August 2025, USDT has a circulating supply exceeding $110 billion, giving it a dominant share of the stablecoin market.
This growth can be attributed to several factors:
1. Increased Adoption in Emerging Markets
USDT is widely used in countries with unstable fiat currencies, such as Argentina, Nigeria, and Turkey. For many users, USDT represents a dollar-denominated safe haven in environments plagued by inflation and capital controls.
2. DeFi and Cross-border Payments
USDT continues to be a core asset in decentralized finance (DeFi) protocols, serving as a stable medium of exchange and collateral. It's also a preferred tool for cross-border remittances, given its speed and low transaction costs compared to traditional banking systems.
3. Institutional Integration
Major crypto exchanges, custodians, and payment processors have incorporated USDT into their platforms, driving further liquidity and utility. In many cases, USDT is preferred over fiat due to its 24/7 availability and blockchain-native nature.
________________________________________
What Does This Mean for the Crypto Industry?
Tether’s Q2 performance is more than just a corporate milestone—it’s a bellwether moment for the crypto industry. It signifies the maturation and institutionalization of digital assets and stablecoins. Here’s what it means for the broader ecosystem:
1. Stablecoins as Profitable Financial Products
Tether’s profitability proves that stablecoins are no longer just “crypto plumbing.” They are now financial products generating billions in yield, much like money market funds. This is reshaping how investors and regulators think about stablecoins—not as speculative tools, but as interest-bearing assets backed by real-world securities.
2. Regulatory Scrutiny Will Intensify
With Tether generating profits that rival traditional banks, expect regulators to increase oversight. Stablecoins have long been in the crosshairs of the U.S. Treasury, SEC, and global central banks, and Tether’s dominant market share will likely place it under further examination.
However, Tether’s transparency efforts, including quarterly attestations and reserve disclosures, may help it navigate these regulatory waters more effectively than in the past.
3. Competition Will Escalate
Tether’s extraordinary profits will likely attract new entrants and existing competitors to the stablecoin arena. Circle’s USDC, PayPal’s PYUSD, and even central bank digital currencies (CBDCs) are all vying for market share.
Tether’s early-mover advantage, global reach, and deep liquidity make it hard to displace, but increased competition could pressure margins in the long term.
4. Decentralized Alternatives Will Seek Market Share
Decentralized stablecoins like DAI, FRAX, and USDD aim to offer alternatives to centralized issuers like Tether. While they remain relatively small, the ethos of decentralization might gain appeal, especially in regulatory-heavy environments.
Still, decentralized stablecoins have struggled to maintain pegs during market stress, giving Tether an edge in terms of trust and resilience.
________________________________________
The Road Ahead for Tether
As Tether moves into the second half of 2025, several strategic themes will define its trajectory:
Continued Profitability
If interest rates remain elevated and USDT circulation continues to grow, Tether’s annual profit could reach or exceed $10 billion—putting it in league with the most profitable fintech firms globally. This surplus could be reinvested in:
• Infrastructure expansion
• Strategic acquisitions
• Reserve diversification
• R&D for stablecoin innovation
Expansion into Emerging Markets
Tether has hinted at expanding its presence in Latin America, Africa, and Southeast Asia, where demand for dollar-denominated assets is high and banking infrastructure is limited. Expect to see more localized partnerships and on-ramp/off-ramp solutions.
Embracing Blockchain Innovation
Tether is already deployed on multiple blockchains—Ethereum, Tron, Solana, and more. The company is likely to support new Layer 1s and Layer 2s to enhance speed, reduce costs, and maintain competitiveness in the DeFi space.
There are also rumors that Tether may be exploring tokenized asset offerings and programmable money features, allowing USDT to integrate more deeply with smart contracts and enterprise use cases.
________________________________________
Criticisms and Controversies: Still Lingering?
Despite its success, Tether continues to face criticism from parts of the crypto community and regulatory world. Concerns include:
• Lack of full audits (attestations are not the same as full financial audits)
• Opaque ownership structure
• Past legal issues, including settlements with the New York Attorney General and the U.S. CFTC
However, it’s worth noting that Tether has addressed many of these concerns over the past two years. Its transparency has improved, and its operations have become more conservative and professional.
Still, its scale and impact on the crypto market mean that any misstep could have systemic consequences. Investors and regulators alike will continue to scrutinize its activities.
________________________________________
Final Thoughts: Tether’s Moment of Ascendance
Tether’s Q2 2025 net profit of $4.96 billion doesn’t just reflect a successful quarter—it marks a paradigm shift in crypto finance. What began as a controversial stablecoin project has evolved into a global financial powerhouse, rivaling traditional banks and asset managers in profitability.
More than just a win for Tether, this moment signals the growing legitimacy of stablecoins in the global financial system. It shows that crypto-native firms can not only survive but thrive in traditional financial environments, leveraging yield, transparency, and blockchain infrastructure to create sustainable business models.
As the world watches, Tether’s next chapters will likely be shaped by innovation, regulation, and global expansion. But for now, with $5.7 billion in profits in just six months, one thing is clear:
Tether is no longer just a stablecoin issuer—it’s one of the most powerful financial entities
in the digital age.
________________________________________
Disclaimer: This article is for informational purposes only. It does not constitute financial advice. Always conduct your own research before making investment decisions.
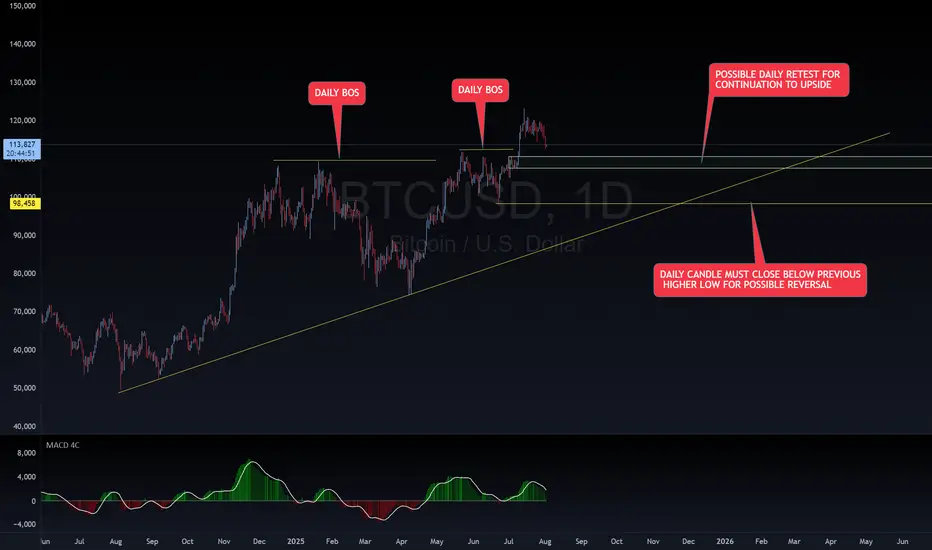
BTC BUY SET UPBTC is on an overall DAILY uptrend with a DAILY BOS. Waiting on a DAILY retest for continuation upward. If DAILY candle breaks and closes below last DAILY HL, it could potentially cause a reversal to downside. Happy trading!
~~~~I want everyone to succeed!
Why Pay $250K for a $115K Bitcoin? Welcome to Strategy (MSTR)This is already the third article I’ve written about Strategy (formerly MicroStrategy), and for good reason.
You don’t need to be a financial expert to ask: why buy a stock that simply mirrors Bitcoin’s price — but at a massive premium?
No matter how sophisticated the explanations may sound, or how many times you’re told that “if you don’t understand it, it must be brilliant,” the reality is much simpler — and much more absurd.
Buying Strategy today is like paying $250,000 for Bitcoin while the actual market price is $115,000.
It’s not about complexity. It’s about common sense.
I won’t dive too deep into it — no need to fight “financial sophistication” with even more sophisticated words.
The point is simple: buying Strategy is like paying me $10,000 just so I can hold your $10,000 and call it an “innovative capital deployment strategy.”
Sounds smart, right? Until you think about it for more than five seconds.
Now let’s look at the posted charts — simple and visual.
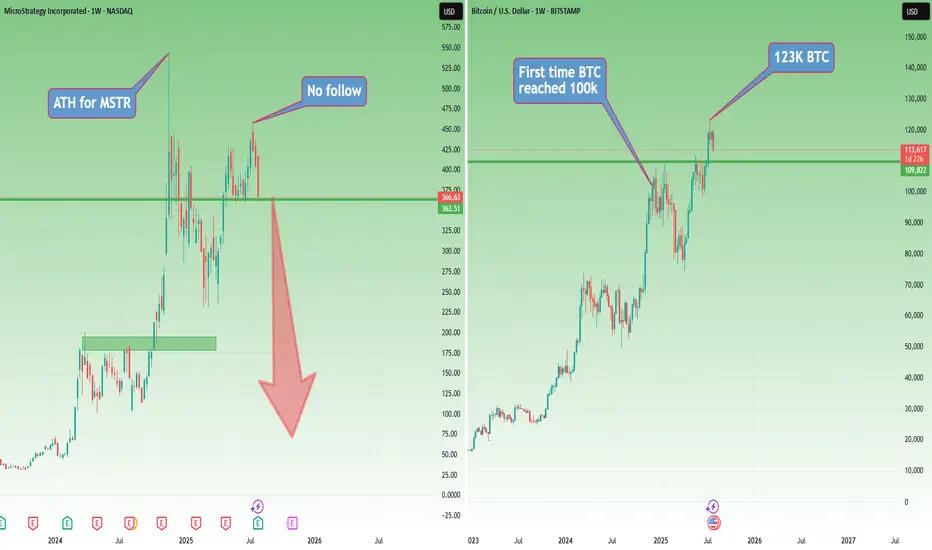
Strategy (MSTR) hit its all-time high in November 2024, right when Bitcoin first reached $100,000.
Then came a sharp correction of more than 50% for the stock.
Fast forward: even though Bitcoin went on to make new all-time highs, Strategy didn’t follow, it seems like people were finally starting to wake up.
When BTC peaked again in mid-July 2025, Strategy only managed to reach $455 — well below its November ATH.
Since then, BTC has pulled back about 10%, while Strategy dropped around 20%.
So much for the “outperformance” argument.
And here’s where things get even harder to justify:
In the past, some institutions bought MicroStrategy because they couldn’t hold Bitcoin directly. Fair enough.
But now? Spot Bitcoin ETFs are live, regulated, widely available, and charge tiny fees — without the leverage, dilution risk, or premium baked into Strategy.
So what’s the excuse now?
Where are we now?
At this moment, even though I’m not too happy about this week’s Bitcoin weakness, I remain cautiously bullish — emphasis on cautiously.
But let’s entertain a scenario.
If Bitcoin continues to correct, Strategy is sitting right on support. And if BTC breaks lower, Strategy will almost certainly follow — breaking support and heading toward the next level.
That next support? Somewhere around $240–250, depending on how deep the Bitcoin pullback goes.
But here’s the real question:
What happens if Bitcoin enters a true bear market?
Will Strategy — which just recently rebranded from MicroStrategy — be forced to rebrand again as…
NanoStrategy?
Just a Saturday thought.
Third Quarter 2025 Nigerian share picks Update....Percentage Up!Here's a summary and update on the third quarter 2025 Nigeria stock picks based on the price comparison between July and August - 1month:
Q3 2025 Trading View: Nigerian Stock Picks Update
Strong Performers with Significant Gains:
BUACEMENT: Up 48%, showing strong momentum as a cement sector leader.
DANGSUGAR: Increased by nearly 37%, notable growth in the sugar sector.
ELLAHLAKES: Shares rose over 36%, a promising performer.
DANGCEM: Cement stock up about 20%, continuing solid growth.
ETRANZACT: Up 24%, showing steady improvement in the tech/payment sector.
MULTIVERSE: Grew by 24%, indicating healthy gains in diversified tech.
NB: +28.8%, good growth for the banking/finance sector.
Moderate or no Growth:
ARADEL: Small increase of about 1%, steady but minimal movement.
HMCALL: Stable with a minor 1.4% increase, remaining consistent.
TRANSPOWER: No price change, holding steady for now.
Overall Market Sentiment:
Average gain across all picks is approximately +22%, a strong positive trend overall.
Indicates a bullish sentiment on these carefully selected third-quarter stocks.
Opportunity exists to take advantage of higher momentum sectors like cement, sugar, and tech/payment companies.
Trading Takeaway:
The Q3 2025 picks demonstrate robust growth potential, especially in key sectors like construction materials and tech/payments. Conservative performers provide portfolio stability while high growth stocks offer upside. Continual monitoring for volume and market news is recommended to capitalize on gains and manage risks moving forward.

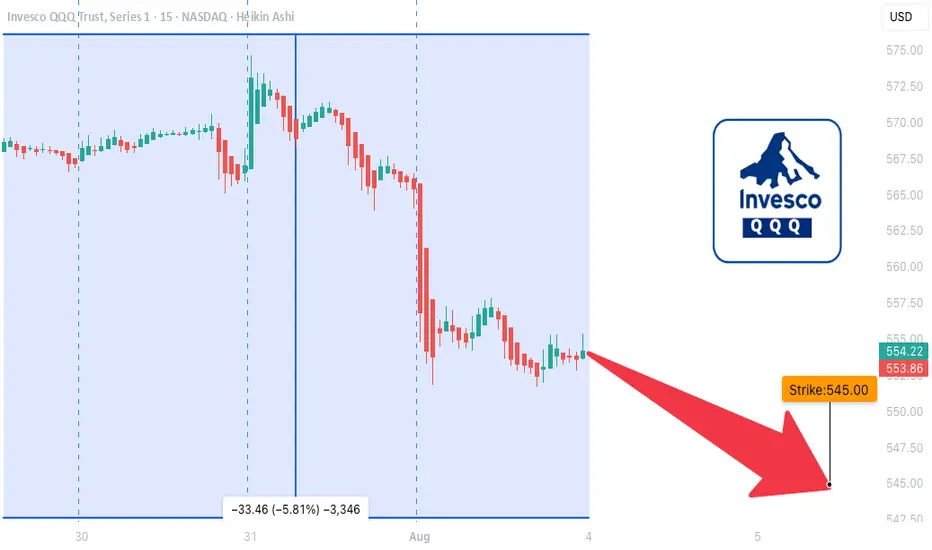
QQQ LEAP Trade Thesis – Aug 1, 2025
🧠 **QQQ LEAP Trade Thesis – Aug 1, 2025**
🎯 **Setup**: High-conviction LEAP PUT
📉 **Bias**: 🔻 *Moderate Bearish*
📆 Horizon: Long-Term (12+ months)
---
📊 **Multi-Model Intelligence Summary**
🧪 **Grok (xAI)**
• Monthly RSI = bearish 📉
• Trading near 52W highs = overvalued 💥
• Suggests: \$545 PUT
🧠 **Gemini (Google)**
• High conviction bearish
• Suggests: \$590 PUT (expensive premium)
🧬 **Claude (Anthropic)**
• RSI breakdown = confirmed weakness
• Recommends: \$530 PUT for max downside
🦾 **Meta (LLaMA)**
• Moving averages turning over
• Suggests: \$555 PUT – moderate confidence
🛰️ **DeepSeek**
• Long-term RSI confirms bearish drift
• Volatility ideal for LEAP entries
• Recommends: \$545 PUT
---
📍**MODEL CONSENSUS**
✅ Bearish trend across all models
✅ Favorable volatility (VIX ✅)
✅ Overvaluation = downside pressure
⚠️ Strike variance across models → we anchor at **\$545** for balance
---
💼 **TRADE SETUP (LEAP PUT)**
• 🔻 Direction: PUT (Short)
• 🎯 Strike: **\$545**
• 📆 Expiry: **2026-09-18** (413 days)
• 💰 Entry Price: **\$38.33**
• 🎯 Target: **\$76.66**
• 🛑 Stop: **\$24.91**
• ✅ Confidence: **75%**
• ⏰ Entry: Monday Open
• 📏 Size: 1 contract
---
📌 **Narrative**:
Every model says the same thing: RSI rollover, inflated price, and perfect LEAP conditions. Institutions are neutral → retail can front-run the decay. You don’t often get long-dated PUTs this clean.
🎯 Asymmetric risk/reward.
📉 Macro setup aligns.
🎯 Strong long-term positioning play.
---
🧠 Stay smart. Position early. Ride the macro shift.
🔔 Like + Follow for more AI-driven trade setups.
BTC | Swing Plan UpdatePrice failed to break out above 1D supply and sharply rejected, losing key 4H demand at $117,300.
HTF demand at $109,000 (1D FVG + BOS + S/R) is the next major area of interest—this is where I’ll look for fresh swing setups if the market flushes further.
No need to rush new positions until a clean setup prints or levels are reclaimed.
Plan:
Wait for price to test $109,000 zone before considering a swing long.
Only consider LTF scalp longs if we reclaim the 4H BOS at $118,300.
Stay flat until high-probability entry, let the market show its hand.

$UNH BEARISH SETUP – WEEK OF AUG 1
🔻 **\ NYSE:UNH BEARISH SETUP – WEEK OF AUG 1** 🔻
**UnitedHealth Group (UNH)** is showing classic breakdown signs. Here’s what the data says:
📉 **RSI Breakdown**
• Daily RSI: **20.6**
• Weekly RSI: **19.3**
→ Deeply oversold + no bounce = 🚨 momentum flush risk
📊 **Volume Surge**
• Weekly Volume: **145M** (1.9x avg)
→ Heavy **institutional selling**, NOT dip buying
🧠 **Options Insight**
• Call/Put Ratio: **1.17** = Slight bullish noise
• But... Expiry Gamma is 🚨HIGH = IV Crush incoming
• VIX: **20.7** = Volatility tailwinds intact
💣 **TRADE IDEA (PUT PLAY)**
• Direction: **BUY PUTS**
• Strike: **\$230**
• Expiry: **08/08/2025**
• Entry: **Monday Open**
• Target Premium: **\$0.10**
• 🎯 PT: \$0.30 | 🛑 SL: \$0.03
• Confidence: **70%**
📌 **Narrative**:
Oversold + High Volume Dump + No support bounce = Perfect storm for continuation dump. This is a high gamma play, time-sensitive, low-cost lotto setup. Risk small. Aim big.
---
💥 **Watchlist Tag**: ` NYSE:UNH AMEX:SPY AMEX:XLV `
🧠 **Strategy Tag**: #OversoldFlush #PutPlay #0DTETrap
🚀 Follow for more weekly earnings & options breakdowns!

CADCHF bullish expectations for next period
OANDA:CADCHF interesting chart, bearish trend last 5M, i am have bullish expectations on 10.June, but price is make one more strong bearish push.
Currently nice structure created, price pushing bullish, from here expectations are bullish trend to see.
SUP zone: 0.58050
RES zone: 0.59000, 0.59450

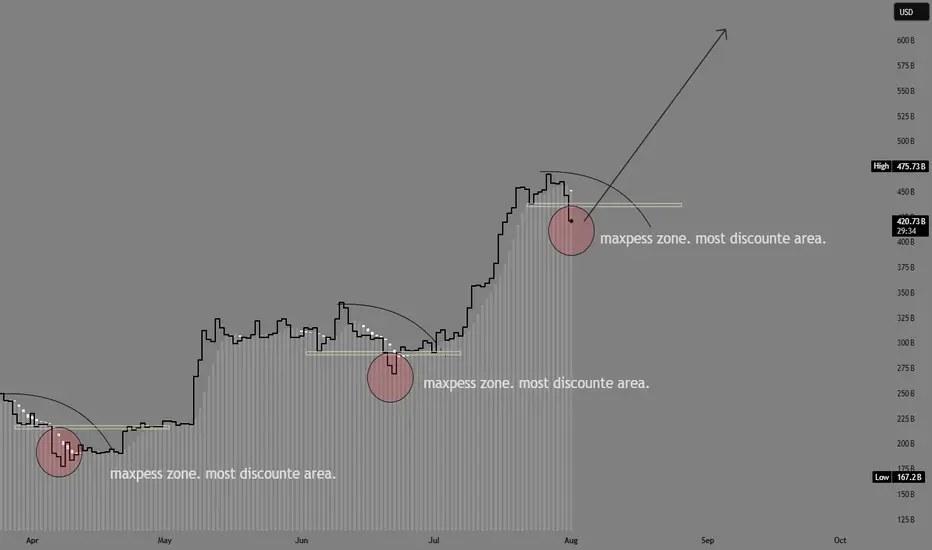
ETH accumulation season 3 has begun at 3.4k. Start loading up!!!ETH has seen impressive price growth for the past few weeks from our original spot at 2.4k -- and it run as high as 3.9k -- almost at our target of 4k.
Now, as with any parabolic moves, eth has to hibernate a bit for that well deserved recharge. This healthy correction at current levels is warranted. 23.6%, 38.2% FIB taps are usually ETHs favorite zone area. This is where most buyers converge as far the most bargain area to position. And we are now at that elusive zone.
A seed from this area is ideal. From our current diagram, you can see we are now on season no.3. This has been doin the same behavior since 160B mcap, and for this next phase, ETH is eyeing 600B mcap from here.
This is in line with our original forecast.
We are now on Month no. 3 as we entered August, my predicted cycle duration would be 17 bullish months till December 2026.
-----------
STONG BUY HOLD at this area. We got a rare elusive season of accumulation that doesnt come very often.
Happy profiting everyone
See you up there.
Spotted at 3.4k
Mid target 5k.
Long term target. 10k.
TAYOR.
Trade safely.
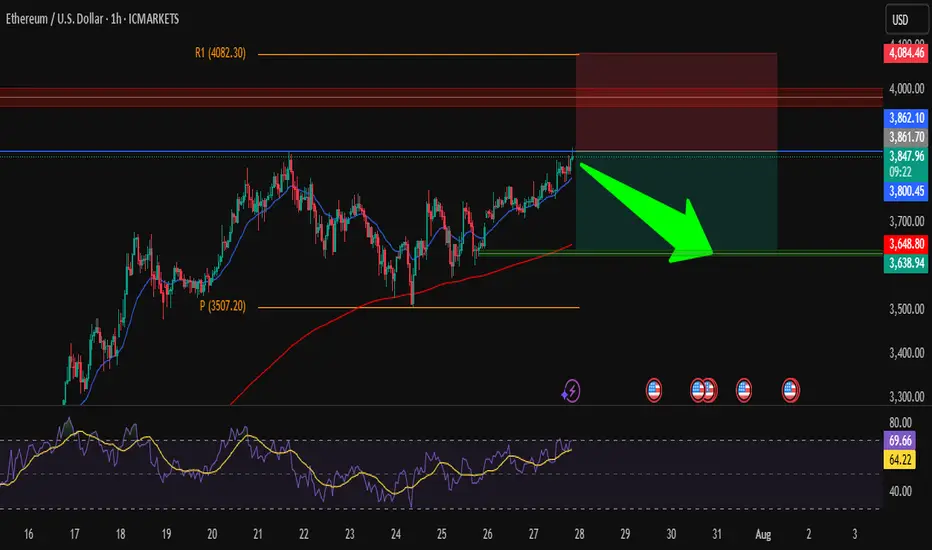
ETH/USD – Short from ResistanceHi traders ! , I opened a short position on ETH/USD as price is hitting a strong resistance zone.
Entry: 3850
SL: 4084.46
TP: 3638.94
📌 Why I took this trade:
Price is testing a strong resistance zone around 3860, RSI is overbought, and we could see a pullback toward the support area around 3640.
Nice risk/reward setup, keeping it simple.
This is just my analysis, not financial advice.
What’s your view — drop or breakout?