GBPUSD 11.08.2025~+ BoE Hawkish cut; upward revisions, concerns about Infl., not in a hurry to cut
~+ More Fed members turn dovish; temporary Fed head (Miran) is dovish; expectations that the new appointee is more politically aligned with Trump (dovish)
Beyond Technical Analysis

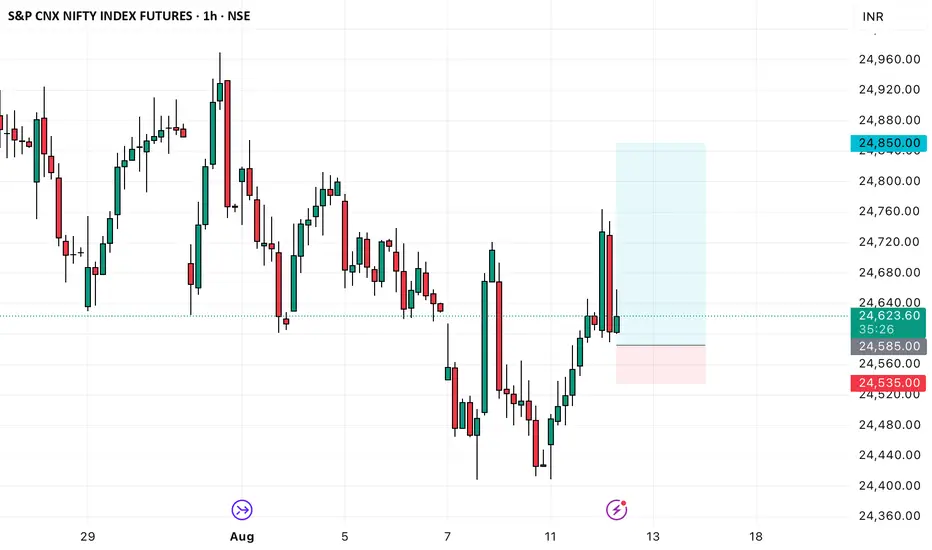
NF FUT long setupNF FUT long setup
Entry - 24585
Stop loss - 24529
Target - 24942
Risk Reward - 1:6.3
GBPUSD DAILY TIMEFRAME ANALYSIS, POSSIBLE LIQUIDITIES,STOP HUNTSLooking at the GBPUSD daily chart, here’s the detailed breakdown with possible liquidity zones and stop hunts areas
---
1. Trend Analysis
Macro Structure:
Price has been making lower highs and lower lows since peaking around mid-June 2025 (~1.3790 area), indicating a medium-term bearish trend.
Recent Move:
After bottoming near 1.3150 in late July 2025, price is currently in a corrective bullish retracement towards prior supply zones.
Overall Bias:
Still bearish until price can break and close convincingly above the 1.3550–1.3600 supply area.
---
2. Key Liquidity Zones & Stop Hunt Areas
I’ve identified potential liquidity pools where traders’ stop-loss orders are likely resting:
Above Price (Buy-side Liquidity / Stops above highs)
1.3440 – 1.3460:
Cluster of prior swing highs and your sell limit entries — attractive for stop hunts before a drop.
1.3550 – 1.3600:
Significant supply zone and swing high area from early July. Break above this will likely sweep buy stops before a possible reversal.
1.3790:
The macro swing high from mid-June — a major liquidity target if bulls dominate.
Below Price (Sell-side Liquidity / Stops below lows)
1.3320 – 1.3300:
Previous short-term low — resting sell stops likely here.
1.3150 – 1.3130:
July’s lowest point — a key liquidity pool if price resumes bearish momentum.
1.3000 psychological level:
Strong round number, deeper liquidity magnet.
Red zones (above) → Buy-side liquidity targets at 1.3440–1.3460 and 1.3550–1.3600.
Blue zones (below) → Sell-side liquidity targets at 1.3320–1.3300 and 1.3150–1.3130.
3. Possible Stop Hunt Scenarios
Bullish Trap Scenario (Most probable short-term):
Price could spike above 1.3440–1.3460 to take out stops and fill sell orders before heading back down.
Bearish Trap Scenario:
A sudden drop below 1.3320 could trigger stops, only for price to reverse higher into the 1.3550 zone.
---
4. Summary
Trend: Medium-term bearish, short-term bullish retracement.
Current Zone: Price is testing sell-side patience near a liquidity cluster around 1.3440.
GBPUSD D1 chart marked with the key liquidity pools and potential stop hunt zones:
Red zones (above) → Buy-side liquidity targets at 1.3440–1.3460 and 1.3550–1.3600.
Blue zones (below) → Sell-side liquidity targets at 1.3320–1.3300 and 1.3150–1.3130.
Next Key Reaction Zones:
Upside: 1.3460, 1.3550–1.3600.
Downside: 1.3320, 1.3150.


EURNZD Is About to Explode — Here’s My Exact TriggerHey, it’s Skeptic — quick breakdown on EURNZD . We’re stuck in a clean consolidation box on both daily & 4H. I’ll show you the exact long and short triggers to watch, plus how I’m planning entries.

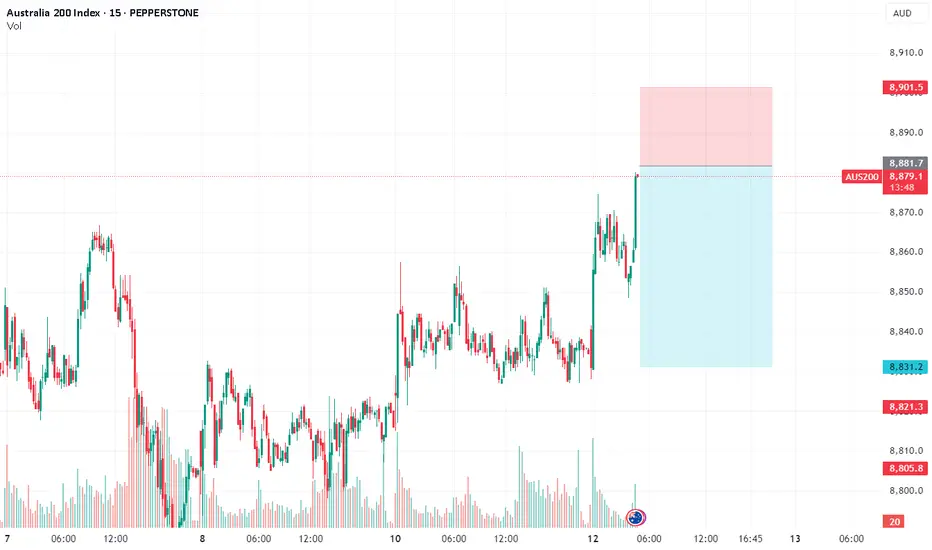
AUS200/ASX200Team, time to SHORT AUS200 at the current level 8878-8882
rate just cut 25 points
Tomorrow CBA report comes out and major dividend come out
target 1 at 8855 - take 50% and bring stop loss to BE
Target 2 at 8843-8836
LET'S GO
OUST Ouster Options Ahead of EarningsAnalyzing the options chain and the chart patterns of OUST Ouster prior to the earnings report this week,
I would consider purchasing the 20usd strike price Calls with
an expiration date of 2026-1-16,
for a premium of approximately $0.75.
If these options prove to be profitable prior to the earnings release, I would sell at least half of them.


Daily Analysis- XAUUSD (Tuesday, 12th August 2025)Bias: No Bias
Notes:
- Strong pullback on market open
- Looking for price to retest 0.618 fib level
- Potential BUY if there's
confirmation on lower timeframe
- Pivot point: 3340
Disclaimer:
This analysis is from a personal point of view, always conduct on your own research before making any trading decisions as the analysis do not guarantee complete accuracy.

AMD stock up over 20% off the lows- outperform NVidia?AMD is still cheap relative to its growth and still way down from all time highs.
Seeking alpha analysts expect 25-30% annual growth in earnings yearly. The stock is still in the low 20s PE. Stock can double and still be a good business worth owning for the long term and let compounding earnings work.
Low rsi and bollinger bands gave us the signal to buy, we bought with leverage, now we are in the shares unlevered.
Target would be all time highs over the next 2-3 years.


NBIS Nebius Group Among My Top 10 Picks for 2025 | Price TargetNebius Group N.V. (NBIS) presents a compelling bullish case for a potential doubling of its stock price by the end of 2025, driven by several fundamental factors that highlight its growth trajectory within the rapidly expanding AI infrastructure market.
NVIDIA Corporation (NVDA) has made a significant investment in Nebius Group N.V. (NBIS), contributing to a $700 million funding round aimed at expanding Nebius's AI infrastructure capabilities. This investment aligns with NVIDIA's strategic focus on enhancing its presence in the rapidly growing AI market.
Explosive Revenue Growth:
Nebius Group has demonstrated remarkable revenue growth, with Q3 2024 revenues reaching $43.3 million, representing a 1.7-fold increase compared to the previous quarter and a staggering 766% year-over-year increase. This surge is primarily driven by the company's core AI infrastructure business, which grew 2.7 times quarter-over-quarter and 6.5 times year-over-year. Analysts expect this momentum to continue, projecting annual revenues of approximately $731.96 million for 2025, reflecting a robust demand for AI-centric services and solutions.
Strategic Investments in AI Infrastructure:
The company is heavily investing in expanding its GPU cluster capabilities and data center capacity, with plans to allocate over $1 billion towards these initiatives. This strategic focus on enhancing AI infrastructure positions Nebius to capture significant market share as the global demand for AI technologies continues to rise. The annualized run-rate for its cloud revenue has already surpassed $120 million, indicating strong customer adoption and a growing client base that includes Fortune 500 companies.
Strong Market Position and Competitive Advantage:
Nebius Group is uniquely positioned within the AI infrastructure landscape, specializing in full-stack solutions that cater to developers and enterprises looking to leverage AI technologies. As businesses increasingly prioritize AI integration into their operations, Nebius's comprehensive offerings make it an attractive partner for organizations seeking to enhance their technological capabilities. The company’s ability to provide scalable solutions will be crucial as the demand for AI services expands.
Healthy Financials and Cash Reserves:
As of September 30, 2024, Nebius reported cash and cash equivalents totaling approximately $2.29 billion, providing a solid financial foundation to support its growth initiatives without excessive reliance on debt. This strong liquidity position allows Nebius to invest aggressively in technology and infrastructure while maintaining operational flexibility 14. Additionally, with gross margins projected to remain robust at around 55% in 2025, the company is well-positioned to improve profitability as revenues grow.

BTC Bitcoin Among My Top 10 Picks for 2025 | Price TargetIf you haven`t bought BTC Bitcoin before the recent breakout:
My price target for BTC in 2025 is $125K, driven by the following fundamental factors:
Regulatory Developments Favoring Adoption:
The anticipated regulatory shifts in the United States are expected to create a more favorable environment for cryptocurrencies. With the potential for pro-crypto policies under a new administration, including the establishment of Bitcoin as a strategic reserve asset by major nations, investor confidence is likely to increase significantly. Analysts suggest that such developments could drive the total cryptocurrency market capitalization from approximately $3.3 trillion to around $8 trillion by 2025, with Bitcoin poised to capture a substantial share of this growth.
Increased Institutional Demand through ETFs:
The launch of Bitcoin exchange-traded funds (ETFs) has already begun to transform the investment landscape for Bitcoin, making it more accessible to institutional and retail investors alike. Following the successful introduction of multiple Bitcoin ETFs in 2024, analysts project that inflows could exceed $15 billion in 2025, further boosting demand for Bitcoin. This increased accessibility is expected to drive prices higher as more investors seek exposure to the asset class.
Supply Constraints from Halving Events:
Bitcoin's supply dynamics are fundamentally bullish due to its halving events, which occur approximately every four years and reduce the rate at which new Bitcoins are created. The most recent halving in April 2024 has led to a significant reduction in supply inflation, creating scarcity that historically correlates with price increases. As demand continues to rise while supply becomes more constrained, this fundamental imbalance is likely to support higher prices.
Growing Adoption as a Store of Value"
As macroeconomic conditions evolve, including persistent inflationary pressures and potential monetary policy easing, Bitcoin is increasingly viewed as a viable store of value akin to gold. This perception is bolstered by its finite supply and decentralized nature, making it an attractive hedge against inflation. Analysts suggest that as more investors turn to Bitcoin for wealth preservation, its price could see substantial appreciation

BTC Weekly ChartI see a bearish divergence on BTC Weekly chart, price correction to the mean and continue .
not a financial advice.

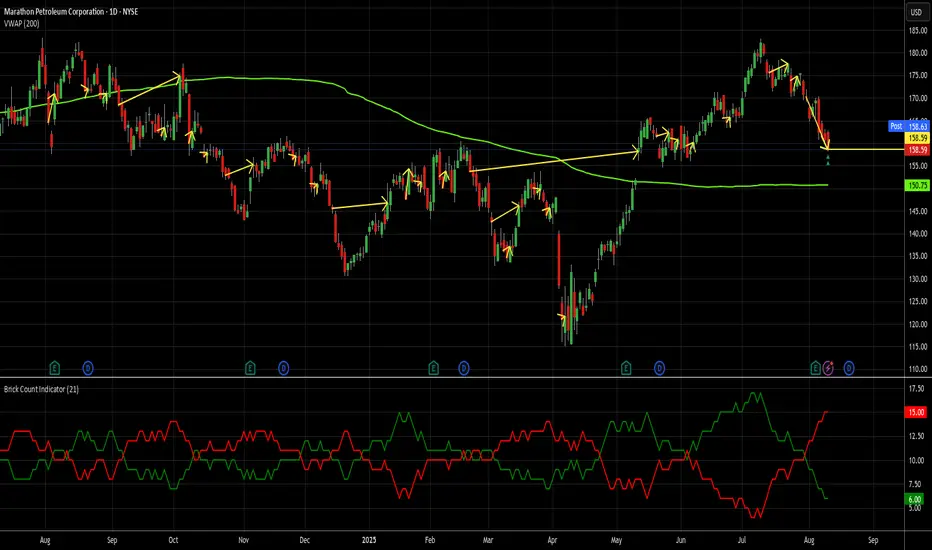
It's a Marathon AND a sprint - it's quick flipping time!The last year or so has not been all that great to MPC. While the markets have chugged higher, MPC has been left behind. Its price appreciation and total return have been negative since the beginning of August of last year. But one of the reasons that I love trading the way I do is that you can make a lot of money without having to "pick stocks" that effectively. Had it run up 20 or 30%, I'd have probably made more money on it, but plenty was made even though it's slightly down over the last 12 months.
Since the beginning of August, 2024, my signals have had a 24-2* record (the 2 current losers are trades that were opened in the past 7 trading days). Those 2 losers, if history is any indication, will become winners sooner rather than later.
Overall, including the losers' returns so far, these trades have lasted an average of 5.7 trading days and returned an average of about 1% each in that span. That's a return of about .17%/day held = 4x the long term average daily return of SPY = 43% annualized. if you only factor in closed trades, the returns are about 6x SPY (+62% annualized). 17 of the 24 closed trades closed in 1 or 2 trading days and all 24 beat the long term avg. market daily return.
The market feels weak below the surface to me, so this will be a FPC trade (as were the others here). If there are more signals before the original lot is closed, I will add up to 2 more lots. In theory, I could hold out until both of the currently losing signals become profitable, but I'm not that patient. But that first one was at 170, so that would be a full 7% return. So I'm going long at 158.59 and planning on being out by the weekend.
As always - this is intended as "edutainment" and my perspective on what I am or would be doing, not a recommendation for you to buy or sell. Act accordingly and invest at your own risk. DYOR and only make investments that make good financial sense for you in your current situation.
P.S. -- sorry for the multiple post and deletes here. My computer was acting up and I was impatient and clicking while it was "thinking" and screwing things up.
Why CSX Corporation CSX Could Reach $37.50 by the End of 2025If you haven`t bought CSX ahead of the previous earnings:
Now CSX Corporation CSX, a leading North American rail freight operator, is positioned for a meaningful upside in 2025, with a realistic price target of $37.50. This target is supported not only by strong fundamentals and industry tailwinds but also by recent options market activity showing significant call option interest at the $37 strike price, indicating growing investor conviction around this level.
1. Strong Options Market Signals at $37.50
Recent options data reveals a notable concentration of call open interest and volume at the $37 strike price in the CSX options chain, especially for near- and mid-term expirations.
This elevated activity suggests that institutional and retail investors are positioning for a rally toward $37–$38, reflecting confidence that the stock will surpass $35 and approach $37.50 by year-end.
The options market’s pricing and demand at this level provide a real-time, market-driven validation of the $37.50 target, adding weight to the fundamental bullish case.
2. Analyst Price Targets and Upward Revisions Support $37.50+
Several analysts have price targets ranging from $35 up to $38–$39, with recent upward revisions reflecting improving operational metrics and resilient demand.
Bank of America and Goldman Sachs, among others, have raised targets closer to or above $35, and the options market activity suggests investors expect further upside beyond these levels.
3. Operational Improvements and Network Optimization
CSX continues to address past network challenges, improving service reliability and operational efficiency, which are expected to drive volume growth in key sectors such as agriculture, minerals, and intermodal freight.
These improvements are critical for margin expansion and revenue growth, underpinning the stock’s appreciation potential.
4. Favorable Macroeconomic and Industry Tailwinds
The resilient U.S. economy and ongoing federal infrastructure investments support sustained freight demand.
Rail’s environmental advantages and cost efficiency over trucking position CSX to capture increased market share as companies seek sustainable logistics solutions.
5. Financial Strength and Shareholder Returns
CSX boasts strong free cash flow generation, enabling consistent dividend growth and share repurchases.
The company’s valuation remains attractive relative to peers, with a P/E around 15.5 and a dividend yield near 1.4%, making it appealing for both growth and income investors.
6. Technical Support and Market Sentiment
The stock has held solid support near $30–$31 and is trading near $34.60 as of mid-June 2025, showing resilience amid market volatility.
Positive sentiment from institutional investors and steady trading volumes reinforce the potential for a breakout toward $37.50.
Disclosure: I am part of Trade Nation's Influencer program and receive a monthly fee for using their TradingView charts in my analysis.

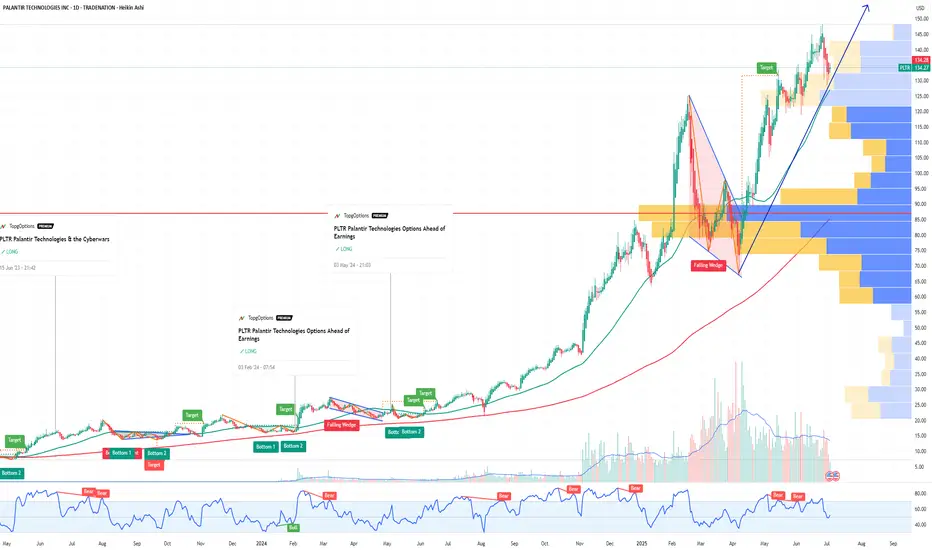
Why Palantir (PLTR) Could Be the NVDA of Government AI If you haven`t bought PLTR before the massive rally:
Palantir Technologies (PLTR) is proving it’s more than just another AI hype play — it’s becoming a core piece of the secure AI infrastructure for governments and large enterprises worldwide.
Key Bullish Arguments
1) Strong Government Moat
PLTR’s deep relationship with the U.S. government, NATO, and allies provides sticky, long-term revenue streams. In an age of geopolitical tension, this is exactly the type of mission-critical AI spending that stays funded.
2) Expanding Commercial Footprint
The commercial segment is no longer a side project. Palantir’s Foundry and Apollo platforms help enterprises deploy AI at scale — securely, in-house, and without sending sensitive data to open systems. Recent deals in healthcare, energy, and critical infrastructure show they’re broadening their customer base.
3) Profitability & Balance Sheet
Palantir is GAAP profitable for six consecutive quarters, with strong free cash flow and zero debt. For a growth stock in AI, this gives it rare staying power if macro conditions tighten.
4) Technical Strength
The stock broke out above ~$125–$130 support and is now testing key resistance in the $140–$148 range. Weekly momentum remains bullish, and institutional accumulation (A/D line) remains strong.
5) AI Tailwinds Remain
While the general AI trade has cooled for some names, PLTR’s unique moat in secure and domain-specific AI makes it more defensible than generic “AI SaaS” stocks. New contracts or AI platform updates could reignite momentum this summer.
Possible Summer Catalysts
New multi-year government deals — especially in defense and cybersecurity.
Major commercial partnerships — especially in healthcare or energy.
AI platform upgrades — more integrations with LLMs or domain-specific AI.
Inclusion in AI-focused ETFs — or further index rebalancing inflows.
Disclosure: I am part of Trade Nation's Influencer program and receive a monthly fee for using their TradingView charts in my analysis.
VKTX: Unusual Options Flow & a Breakthrough Weight-Loss DrugIf you haven`t bought CKTX before the recent rally:
Now you need to know that Viking Therapeutics (VKTX) is a speculative biotech stock in the GLP-1/GIP agonist space, aiming to challenge market leaders like Eli Lilly and Novo Nordisk. Recently, I noticed unusual options flow — specifically, Jan 16, 2026 $60 strike calls
Key Bullish Points
1) Riding the Obesity Drug Boom
VK2735 is Viking’s dual agonist candidate showing promising early weight-loss efficacy, with potential overlap benefits in NASH (liver disease). The obesity treatment space is expected to exceed $100B by 2030—huge upside if their trials continue positively.
2) Options Flow Tells a Story
Those Jan 2026 $60 calls caught my attention precisely because the stock currently trades in the mid-$60s. These aren’t cheap lottery plays—they’re strategically timed wrt trial readouts, partnerships, or acquisition interest. Essentially, someone anticipates meaningful upside in the near future.
3) Descending Wedge — Chart Looks Bullish
VKTX peaked near $100, then pulled back into a well-defined descending wedge. If it breaks out above $70–$72 with volume, that could kick off a classic reversal trade.
Smart Money Options Flow — Near-Term Bet:
Recently, I spotted unusual open interest in $60 strike calls expiring Jan 16, 2026 — that’s only about 7 months away.
This means someone is positioning for a big upside move relatively soon, likely betting on positive Phase 2b/3 data, a partnership deal, or even buyout chatter within the next few quarters.
Short-dated, out-of-the-money call flow like this often hints at near-term news — not just a long-dated hedge.

META Meta Platforms Options Ahead Of EarningsIf you haven`t bought META before the rally:
Now analyzing the options chain and the chart patterns of META Platforms prior to the earnings report this week,
I would consider purchasing the 710usd strike price in the money Calls with
an expiration date of 2026-6-18,
for a premium of approximately $89.30.
If these options prove to be profitable prior to the earnings release, I would sell at least half of them.
Disclosure: I am part of Trade Nation's Influencer program and receive a monthly fee for using their TradingView charts in my analysis.

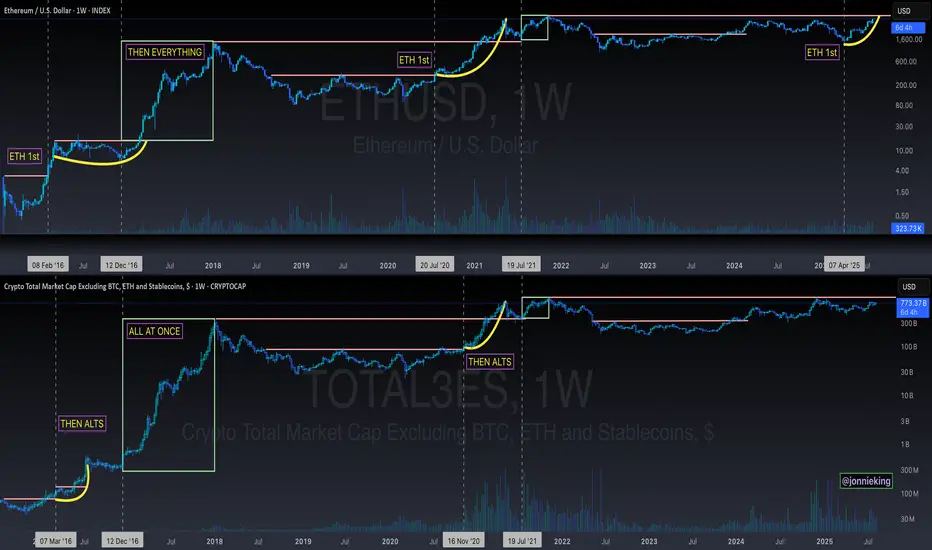
ETH > Alt Season Historical LookTHE STAGES OF ALT SEASON
ETH > Alts > market collectively corrects > Everything All Together
Alts are gonna absolutely rip your face off once ETH convincingly breaks its ATH.
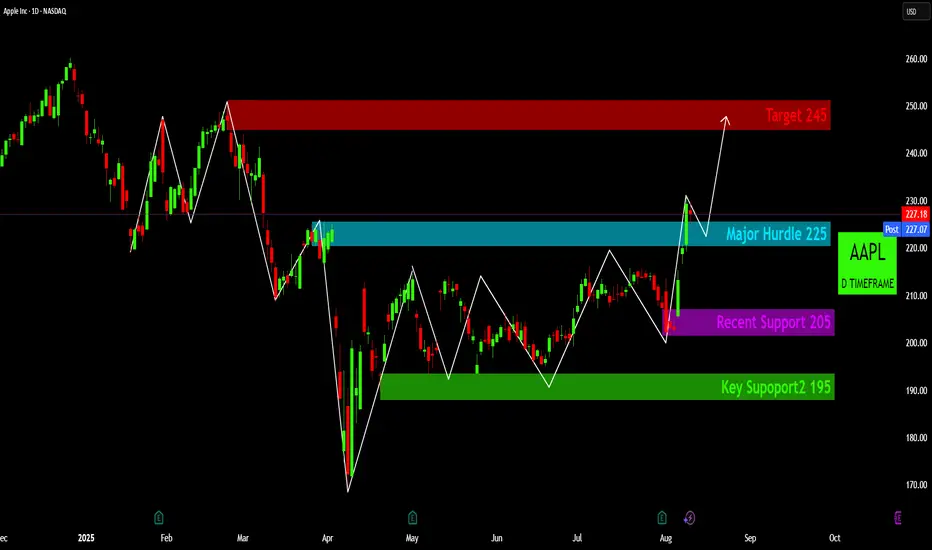
Apple's Ascent: Breaking Barriers, Targeting $245!AAPL: Preparing for Potential New Highs
Apple Inc. (AAPL) demonstrates a constructive bullish outlook on the daily timeframe, marked by a clear reversal pattern and a decisive breakout above a key resistance level. Recent price action indicates a notable shift in market sentiment, suggesting considerable upward potential.
Technical Foundation: Over recent months, AAPL has developed a solid bottoming formation originating from its April lows, anchored by consistent demand near $195 (Key Support) and further supported by a rebound from $205 (Recent Support). These levels highlight growing confidence among buyers, as well as effective accumulation at lower prices. 🛡️
Breakout Confirmation: A significant technical event occurred when price broke convincingly through the $225 (Major Hurdle) zone, which previously served as a substantial resistance area. This successful breakout provides confirmation of renewed bullish momentum and points to evolving market dynamics. 💥
Consolidation Phase: At present, AAPL is consolidating above the newly established support at $225. This consolidation is integral for digesting recent gains and validating the breakout level. Should $225 hold as support, it will reinforce the foundation for continued advancement. ✨
Upside Outlook: With the $225 barrier now surpassed and ongoing buying interest, the primary upside target is identified near the $245 level. This resistance aligns with prior highs and represents a logical short-term objective for price appreciation. 🎯
Risk Management Considerations: Despite the positive outlook, disciplined risk management requires close attention to key support areas. The $225 level (now support) is immediately relevant, followed by $205 and the critical $195 zone. Any breach of these supports should prompt a re-assessment of the prevailing bullish view. ✅
www.tradingview.com
www.tradingview.com
Disclaimer:
The information provided in this chart is for educational and informational purposes only and should not be considered as investment advice. Trading and investing involve substantial risk and are not suitable for every investor. You should carefully consider your financial situation and consult with a financial advisor before making any investment decisions. The creator of this chart does not guarantee any specific outcome or profit and is not responsible for any losses incurred as a result of using this information. Past performance is not indicative of future results. Use this information at your own risk. This chart has been created for my own improvement in Trading and Investment Analysis. Please do your own analysis before any investments.
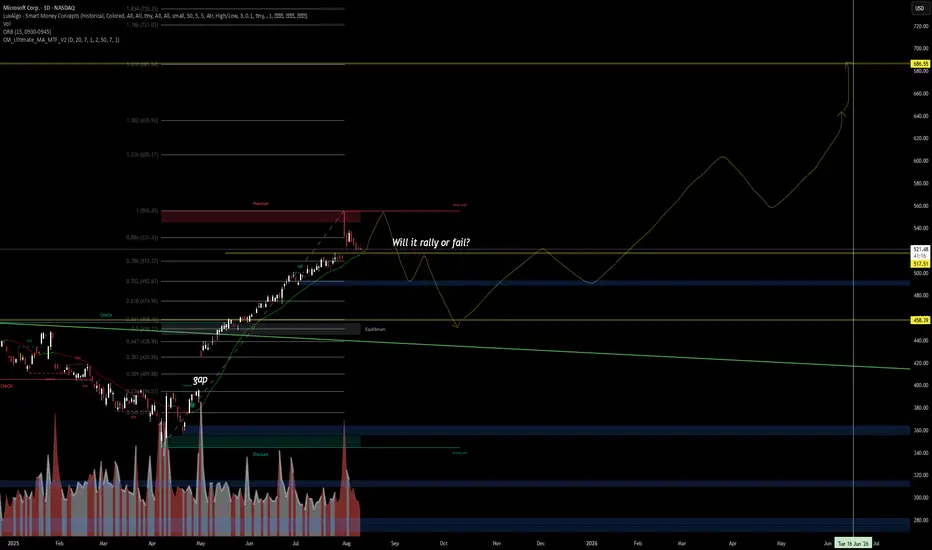
MSFT: My view on the chartNASDAQ:MSFT | Will It Rally or Fail?
WaverVanir International LLC – VolanX Macro/Technical Outlook
Microsoft ( NASDAQ:MSFT ) is at a key inflection point after testing the premium zone near $555. The rejection here raises the classic question — is this a healthy pullback or the start of a deeper retracement?
Technical Highlights:
Price currently hovering around $521, with immediate support at $517.51.
Fibonacci retracement levels show potential retrace targets at $492 (0.702) and $458 (Equilibrium Zone).
Previous market structure shift (CHoCH) remains intact — bulls still control the macro trend.
Gap from April remains a historical liquidity zone.
Volume analysis shows tapering interest post-peak, signaling possible short-term weakness.
VolanX Scenario Projections:
Bullish Case: Strong defense at $517–$500, leading to a wave structure breakout towards $686.55 by mid-2026.
Bearish Case: Failure to hold $500 could drive a liquidity sweep toward $458 before a possible long-term continuation higher.
Macro View:
While fundamentals remain strong, the broader NASDAQ environment and AI sector momentum will dictate if Microsoft can rally without retesting deeper supports. Watch for liquidity grabs in discount zones as potential institutional entries.
📊 VolanX Bias: Neutral-Bullish, but we remain patient for an optimal risk-entry confirmation.
Disclaimer: This is not financial advice. For educational purposes only. VolanX models are probabilistic, not predictive.
EURGBP higher bearish for expect
OANDA:EURGBP trend line breaked, DESCENDING TRIANGL also breaked, +after BOE event from last week here having higher bearish expectations
SUP zone: 0.86700
RES zone: 0.85900, 0.85600
