EUR/USD Triangle Breakout (15.05.2025)The EUR/USD Pair on the M30 timeframe presents a Potential Selling Opportunity due to a recent Formation of a Triangle Breakout Pattern. This suggests a shift in momentum towards the downside in the coming hours.
Possible Short Trade:
Entry: Consider Entering A Short Position around Trendline Of The Pattern.
Target Levels:
1st Support – 1.1085
2nd Support – 1.1030
🎁 Please hit the like button and
🎁 Leave a comment to support for My Post !
Your likes and comments are incredibly motivating and will encourage me to share more analysis with you.
Best Regards, KABHI_TA_TRADING
Thank you.
Beyondtechnicalanalysis

EUR/USD - Triangle Formation (16.05.2025)The EUR/USD pair on the M30 timeframe presents a Potential Buying Opportunity due to a recent Formation of a Triangle Pattern. This suggests a shift in momentum towards the upside and a higher likelihood of further advances in the coming hours.
Possible Long Trade:
Entry: Consider Entering A Long Position around Trendline Of The Pattern.
Target Levels:
1st Resistance – 1.1321
2nd Resistance – 1.1376
🎁 Please hit the like button and
🎁 Leave a comment to support for My Post !
Your likes and comments are incredibly motivating and will encourage me to share more analysis with you.
Best Regards, KABHI_TA_TRADING
Thank you.

Bitcoin is nearing a critical breakout zone at $86,000Bitcoin is nearing a critical breakout zone at $86,000.
If this level breaks with strong momentum, we could see a rapid bullish continuation toward the major resistance area around $105,000. The ascending channel remains intact, and aggressive buying near support points to a strong upside setup.
From a fundamental view, Bitcoin is gaining strength as global uncertainty rises. The latest escalation of trade tariffs has disrupted traditional markets, pushing more investors toward alternative assets like Bitcoin. Historically, Bitcoin has performed strongly during times of economic instability.
Tightening monetary policies worldwide are fueling recession fears, making Bitcoin even more attractive as a hedge — the new "digital gold." With institutional interest growing, Bitcoin is well-positioned for a significant capital inflow.
Stay ready — the next big move is close! 🚀

GBP/USD - Triangle Breakout (16.05.2025)The GBP/USD pair on the M30 timeframe presents a Potential Buying Opportunity due to a recent Formation of a Triangle Breakout Pattern. This suggests a shift in momentum towards the upside and a higher likelihood of further advances in the coming hours.
Possible Long Trade:
Entry: Consider Entering A Long Position around Trendline Of The Pattern.
Target Levels:
1st Resistance – 1.3389
2nd Resistance – 1.3441
🎁 Please hit the like button and
🎁 Leave a comment to support for My Post !
Your likes and comments are incredibly motivating and will encourage me to share more analysis with you.
Best Regards, KABHI_TA_TRADING
Thank you.

AUD/CHF - Trendline Breakout (15.05.2025)The AUD/CHF Pair on the M30 timeframe presents a Potential Selling Opportunity due to a recent Formation of a Trendline Breakout Pattern. This suggests a shift in momentum towards the downside in the coming hours.
Possible Short Trade:
Entry: Consider Entering A Short Position around Trendline Of The Pattern.
Target Levels:
1st Support – 0.5338
2nd Support – 0.5308
🎁 Please hit the like button and
🎁 Leave a comment to support for My Post !
Your likes and comments are incredibly motivating and will encourage me to share more analysis with you.
Best Regards, KABHI_TA_TRADING
Thank you.

USD/JPY - Trendline Breakout (14.05.2025)The USD/JPY Pair on the M30 timeframe presents a Potential Selling Opportunity due to a recent Formation of a Trendline Breakout Pattern. This suggests a shift in momentum towards the downside in the coming hours.
Possible Short Trade:
Entry: Consider Entering A Short Position around Trendline Of The Pattern.
Target Levels:
1st Support – 145.34
2nd Support – 143.81
🎁 Please hit the like button and
🎁 Leave a comment to support for My Post !
Your likes and comments are incredibly motivating and will encourage me to share more analysis with you.
Best Regards, KABHI_TA_TRADING
Thank you.

XAU/USD - Trendline Breakout (14.05.2025)The XAU/USD pair on the M30 timeframe presents a Potential Buying Opportunity due to a recent Formation of a Breakout Pattern. This suggests a shift in momentum towards the upside and a higher likelihood of further advances in the coming hours.
Possible Long Trade:
Entry: Consider Entering A Long Position around Trendline Of The Pattern.
Target Levels:
1st Resistance – 3321
2nd Resistance – 3364
🎁 Please hit the like button and
🎁 Leave a comment to support for My Post !
Your likes and comments are incredibly motivating and will encourage me to share more analysis with you.
Best Regards, KABHI_TA_TRADING
Thank you.

XAU/USD - Fed warns of Economic UncertaintyThe XAU/USD pair on the M30 timeframe presents a Potential Buying Opportunity due to a recent Formation of a Bullish Flag Pattern. This suggests a shift in momentum towards the upside and a higher likelihood of further advances in the coming hours.
Possible Long Trade:
Entry: Consider Entering A Long Position around Trendline Of The Pattern.
Target Levels:
1st Resistance – 3473
2nd Resistance – 3519
🎁 Please hit the like button and
🎁 Leave a comment to support for My Post !
Your likes and comments are incredibly motivating and will encourage me to share more analysis with you.
Best Regards, KABHI_TA_TRADING
Thank you.

EUR/GBP Wedge Breakout (06.05.2025)The EUR/GBP Pair on the M30 timeframe presents a Potential Selling Opportunity due to a recent Formation of a Wedge Breakout Pattern. This suggests a shift in momentum towards the downside in the coming hours.
Possible Short Trade:
Entry: Consider Entering A Short Position around Trendline Of The Pattern.
Target Levels:
1st Support – 0.8476
2nd Support – 0.8463
🎁 Please hit the like button and
🎁 Leave a comment to support for My Post !
Your likes and comments are incredibly motivating and will encourage me to share more analysis with you.
Best Regards, KABHI_TA_TRADING
Thank you.

USD/CAD - Wedge Breakout (06.05.2025)The USD/CAD pair on the M30 timeframe presents a Potential Buying Opportunity due to a recent Formation of a Wedge Breakout Pattern. This suggests a shift in momentum towards the upside and a higher likelihood of further advances in the coming hours.
Possible Long Trade:
Entry: Consider Entering A Long Position around Trendline Of The Pattern.
Target Levels:
1st Resistance – 1.3893
2nd Resistance – 1.3928
🎁 Please hit the like button and
🎁 Leave a comment to support for My Post !
Your likes and comments are incredibly motivating and will encourage me to share more analysis with you.
Best Regards, KABHI_TA_TRADING
Thank you.

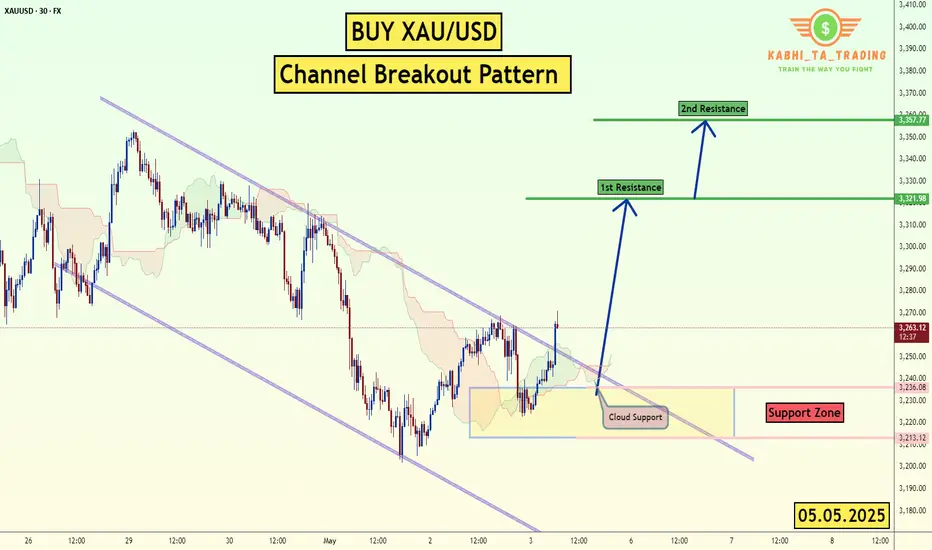
XAU/USD - Channel Breakout (05.05.2025)The XAU/USD pair on the M30 timeframe presents a Potential Buying Opportunity due to a recent Formation of a Channel Breakout Pattern. This suggests a shift in momentum towards the upside and a higher likelihood of further advances in the coming hours.
Possible Long Trade:
Entry: Consider Entering A Long Position around Trendline Of The Pattern.
Target Levels:
1st Resistance – 3321
2nd Resistance – 3357
🎁 Please hit the like button and
🎁 Leave a comment to support for My Post !
Your likes and comments are incredibly motivating and will encourage me to share more analysis with you.
Best Regards, KABHI_TA_TRADING
Thank you.
A Bitcoin Prediction (2025)In this chart, we continue the journey of testing whether Bitcoin can live up to the expectations as published in my previous Bitcoin prediction chart (2024). Since we had technically hit my ATH cycle top for 2024–25, we are now gambling with the possibility that we might not have hit the highest cycle top targets and may just extend that little bit more. I think 2025 has most people asking, "Are we done yet?" or are we on the verge of something else? We'll just have to wait and see....
Upside:
As you can see in ATHs, there are several targets, and I've mentioned this in my previous chart. Ultimately, the high side of what this chart can expect from a cycle high is a 2-week close of $131k. Wicks can extend beyond this price, but I expect a close below (according to this chart). A close above will invalidate this chart. All prices within the lows and highs are acceptable.
Downside:
In my previous chart, I hadn't posted any projected targets during a bear market; I only highlighted the lows, as generally that is what most may consider important enough to know—when can we resume the bull market again? Well, in this chart, I have labeled two additional downside targets. Although these do not follow the same pattern as other targets, they do have a significant similarity to previous cycle lows. Expect bounces from these levels, but if the pattern holds true, they will fail and continue to lower prices. In the short term, resistance sits at $98,511, and again this is on a 2-week close. So this next week, we can wick above, which might be the path we are on.
Summary: I'll be posting updates close to each 2 week close, if I see something I'll be sure to post and update.
2024 Chart linked below.

EUR/USD - Channel Breakout (02.05.2025) FX:EURUSD The EUR/USD pair on the M30 timeframe presents a Potential Buying Opportunity due to a recent Formation of a Breakout Pattern. This suggests a shift in momentum towards the upside and a higher likelihood of further advances in the coming hours.
Possible Long Trade:
Entry: Consider Entering A Long Position around Trendline Of The Pattern.
Target Levels:
1st Resistance – 1.1387
2nd Resistance – 1.1430
🎁 Please hit the like button and
🎁 Leave a comment to support for My Post !
Your likes and comments are incredibly motivating and will encourage me to share more analysis with you.
TVC:DXY
Best Regards, KABHI_TA_TRADING
Thank you.

XAU/USD (Gold) H1 Breakout (29.04.2025)The XAU/USD Pair on the H1 timeframe presents a Potential Selling Opportunity due to a recent Formation of a Breakout Pattern. This suggests a shift in momentum towards the downside in the coming hours.
Possible Short Trade:
Entry: Consider Entering A Short Position around Trendline Of The Pattern.
Target Levels:
1st Support – 3158
2nd Support – 3025
🎁 Please hit the like button and
🎁 Leave a comment to support for My Post !
Your likes and comments are incredibly motivating and will encourage me to share more analysis with you.
Best Regards, KABHI_TA_TRADING
Thank you.

EGX30 Upward TrendEGX30 stock shifted to a higher zone, between 32,191 resistance line and 32,006 support line, reflecting the buyers' dominance over the sellers'. It is expected to not breach the resistance line at 32,191 points since that there is no historical trend, but in case of falling it's expected to reach the support line 32,147 then 32,094 then 32,006 points.

Buy Fear, Not Euphoria: The Trader's EdgeWhen you look back at the greatest trading opportunities in history, they all seem to share a common element: fear. Yet, when you're in the moment, it feels almost impossible to pull the trigger. Why? Because fear paralyzes, while euphoria seduces. If you want to truly evolve as a trader, you need to master this fundamental shift: buy fear, not euphoria.
Let's break it down together.
________________________________________
What Fear and Euphoria Really Mean in Markets
In simple terms, fear shows up when prices are falling sharply, when bad news dominates the headlines, and when people around you are saying "it's all over."
Euphoria, on the other hand, is everywhere when prices are skyrocketing, when everyone on social media is celebrating, and when it feels like "this can only go higher."
In those moments:
• Fear tells you to run away.
• Euphoria tells you to throw caution to the wind.
Both emotions are signals. But they are inverted signals. When fear is extreme, value appears. When euphoria is extreme, danger hides.
________________________________________
Why Buying Fear Works
Markets are pricing machines. They constantly adjust prices based on emotions, news, and expectations. When fear hits, selling pressure often goes beyond what is rational. People dump assets for emotional reasons, not fundamental ones.
Here’s why buying fear works:
• Overreaction: Bad news usually causes exaggerated moves.
• Liquidity Vacuums: Everyone sells, no one buys, creating sharp discounts.
• Reversion to Mean: Extreme moves tend to revert once emotions stabilize.
Buying into fear is not about being reckless. It’s about recognizing that the best deals are available when others are too scared to see them.
________________________________________
Why Chasing Euphoria Fails
At the peak of euphoria, risks are often invisible to the crowd. Valuations are stretched. Expectations are unrealistic. Everyone "knows" it's going higher — which ironically means there's no one left to buy.
Chasing euphoria often leads to:
• Buying high, selling low.
• Getting trapped at tops.
• Emotional regret and revenge trading.
You’re not just buying an asset — you're buying into a mass illusion.
________________________________________
How to Train Yourself to Buy Fear
It's not enough to "know" this. In the heat of the moment, you will still feel the fear. Here's how you build the right habit:
1. Pre-plan your entries: Before panic strikes, have a plan. Know where you want to buy.
2. Focus on strong assets: Not everything that falls is worth buying. Choose assets with strong fundamentals or clear technical setups.
3. Scale in: Don’t try to catch the bottom perfectly. Build positions gradually as fear peaks.
4. Use alerts, not emotions: Set price alerts. When they trigger, act mechanically.
5. Remember past patterns: Study previous fear-driven crashes. See how they recovered over time.
Trading is a game of memory. The more you internalize past patterns, the easier it is to act when everyone else panics.
________________________________________
A Recent Example: April 2025 Tariff Panic
Very recently, at the start of April, Trump’s new tariff announcements sent shockwaves through the market. Panic took over. Headlines screamed. Social media was flooded with fear.
But if you looked beyond the noise, charts like SP500 and US30 told a different story: the drops took price right into strong support zones.
At the time, I even posted this : support zones were being tested under emotional pressure.
If you had price alerts set and reacted mechanically, not emotionally , you could have bought into that fear — and potentially benefited from the rebound that followed just days later.
This is the essence of buying fear.
________________________________________
Final Thoughts
In trading, you are paid for doing the hard things. Buying when it feels terrible. Selling when it feels amazing.
Remember:
Fear offers you discounts. Euphoria offers you traps.
The next time the market feels like it's crashing, ask yourself:
• Is this fear real, or exaggerated?
• Is this an opportunity hiding under an emotional fog?
If you can answer that with clarity, you're already ahead of 90% of traders.
Stay rational. Stay prepared. And above all: buy fear, not euphoria.
Disclosure: I am part of Trade Nation's Influencer program and receive a monthly fee for using their TradingView charts in my analyses and educational articles.
GBPAUD / 1H / BULLHey There;
My GBPAUD target level is 2.10269
My target may come a bit late because this trade is a swing trade.
I would appreciate it very much if you do not miss your likes within the framework of Respect for Labor Thank you very much in advance

GBP/JPY Bullish Flag (29.04.2025)The GBP/JPY pair on the M30 timeframe presents a Potential Buying Opportunity due to a recent Formation of a Breakout Pattern. This suggests a shift in momentum towards the upside and a higher likelihood of further advances in the coming hours.
Possible Long Trade:
Entry: Consider Entering A Long Position around Trendline Of The Pattern.
Target Levels:
1st Resistance – 192.18
2nd Resistance – 192.70
🎁 Please hit the like button and
🎁 Leave a comment to support for My Post !
Your likes and comments are incredibly motivating and will encourage me to share more analysis with you.
Best Regards, KABHI_TA_TRADING
Thank you.

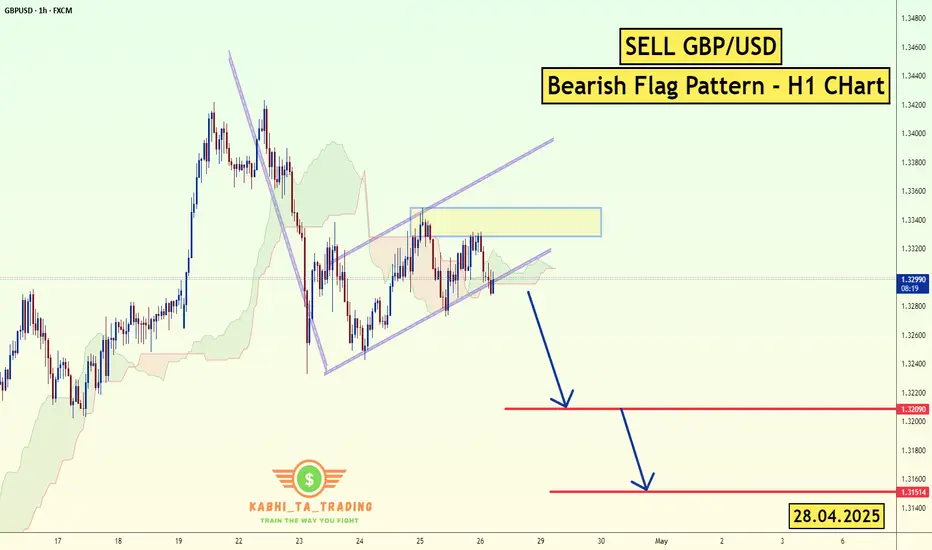
GBP/USD - H1 - Bearish Flag (28.04.2025)FX:GBPUSD The GBP/USD Pair on the H1 timeframe presents a Potential Selling Opportunity due to a recent Formation of a Bearish Flag Pattern. This suggests a shift in momentum towards the downside in the coming hours.
Possible Short Trade:
Entry: Consider Entering A Short Position around Trendline Of The Pattern.
Target Levels:
1st Support – 1.3209
2nd Support – 1.3151
🎁 Please hit the like button and
🎁 Leave a comment to support for My Post !
Your likes and comments are incredibly motivating and will encourage me to share more analysis with you.
Best Regards, KABHI_TA_TRADING
Thank you.
Fundamental Update :
on Monday as the trade tensions between the U.S. and China provided some relief to investors, while a stronger dollar further weighed on prices.
The U.S. dollar TVC:DXY rose 0.2% against a basket of currencies, making bullion more expensive for overseas buyers. TVC:DJI SP:SPX NASDAQ:IXIC also rising .
Bitcoin has broken above the $86,000 zone, just as we anticipateBitcoin has broken above the $86,000 zone, just as we anticipated.
🔹 On-Chain Insights:
• Long-Term Holders: Mild distribution — profit-taking phase
• Network Activity: Steady — strong and healthy
• Sentiment: Bullish — weak USD and rising institutional inflows
🔹 Macro Overview:
• U.S.–China tensions and Fed uncertainty boost Bitcoin’s safe-haven appeal
• Institutions are steadily increasing exposure — a strong positive signal
Stay tuned with megvipofficial for more accurate updates and premium crypto signals!

FET/USDT - Trendline Breakout (22.04.2025)The FET/USDT Pair on the M30 timeframe presents a Potential Selling Opportunity due to a recent Formation of a Breakout Pattern. This suggests a shift in momentum towards the downside in the coming hours.
Possible Short Trade:
Entry: Consider Entering A Short Position around Trendline Of The Pattern.
Target Levels:
1st Support – 0.553
2nd Support – 0.516
🎁 Please hit the like button and
🎁 Leave a comment to support for My Post !
Your likes and comments are incredibly motivating and will encourage me to share more analysis with you.
Best Regards, KABHI_TA_TRADING
Thank you.

USD/CAD - Channel Pattern (22.04.2025)The USD/CAD Pair on the M30 timeframe presents a Potential Selling Opportunity due to a recent Formation of a Channel Pattern. This suggests a shift in momentum towards the downside in the coming hours.
Possible Short Trade:
Entry: Consider Entering A Short Position around Trendline Of The Pattern.
Target Levels:
1st Support – 1.3771
2nd Support – 1.3745
🎁 Please hit the like button and
🎁 Leave a comment to support for My Post !
Your likes and comments are incredibly motivating and will encourage me to share more analysis with you.
Best Regards, KABHI_TA_TRADING
Thank you.

ENA/USDT Breakout Pattern (18.04.2025)The ENA/USDT pair on the M30 timeframe presents a Potential Buying Opportunity due to a recent Formation of a Breakout Pattern. This suggests a shift in momentum towards the upside and a higher likelihood of further advances in the coming hours.
Possible Long Trade:
Entry: Consider Entering A Long Position around Trendline Of The Pattern.
Target Levels:
1st Resistance – 0.3015
2nd Resistance – 0.3217
🎁 Please hit the like button and
🎁 Leave a comment to support for My Post !
Your likes and comments are incredibly motivating and will encourage me to share more analysis with you.
Best Regards, KABHI_TA_TRADING
Thank you.

LEAP: GBPUSD Week 17 Swing Zone/LevelsLast week saw a good pinch on market pips. Aim to continue as always.
Price swing levels are set; either a or b, price action directs.
Levels/zones are calculated based on previous week H/L
