BIGTIMEUSDT — Descending Triangle Nearing Breakout or Breakdown?Full Analysis
The BIGTIME/USDT chart on the 4D timeframe (OKX) shows a prolonged downtrend with consistent lower highs, capped by a strong descending trendline (yellow). At the same time, price has been holding within a major support zone between 0.038 – 0.055 USDT (yellow box).
This structure forms a Descending Triangle — a classic pattern that often signals bearish continuation, but in some cases, it can also mark the final stage before a strong bullish reversal. Price is now approaching the apex of the triangle, meaning a major breakout (up or down) could happen soon.
---
🔹 Bullish Scenario (Breakout Reversal)
If buyers manage to break the descending trendline with a strong 4D close and higher volume, momentum could quickly shift to the upside. Key resistance levels to watch:
0.0655 USDT → First breakout confirmation.
0.0879 USDT → Next target.
0.1073 USDT → Critical mid-term resistance.
With enough momentum, BIGTIME could extend toward 0.2213 USDT or even 0.3196 USDT in the longer run.
📌 Note: A valid breakout usually comes with a volume spike and a successful retest above the broken trendline.
---
🔻 Bearish Scenario (Breakdown Continuation)
If selling pressure dominates and price loses the major support box 0.038 – 0.055 USDT, the downtrend is likely to extend.
Breakdown below 0.038 USDT on strong volume → clear bearish confirmation.
Next support area: 0.028 – 0.030 USDT.
Extreme target: retesting the historical low at 0.0145 USDT.
📌 Note: Statistically, descending triangles have a higher probability of breaking down, but confirmation is key.
---
⚖️ Technical Summary
Critical Zone: 0.038 – 0.055 USDT (main support).
Bullish confirmation: Break and close above trendline + 0.0655 USDT.
Bearish confirmation: Breakdown and close below 0.038 USDT.
Current pattern: Descending Triangle nearing its apex → Expect a decisive move soon.
BIGTIME is entering a high-pressure zone. In the coming weeks, the market will reveal whether this is the bottom before a reversal, or the continuation of a deeper downtrend.
---
#BIGTIME #BIGTIMEUSDT #CryptoAnalysis #Altcoin #TechnicalAnalysis #DescendingTriangle #CryptoBreakout #SupportResistance #ChartPattern
Bigtimeanalysis

BIGTIME/USDT Ready to Explode! End of a Long Downtrend? Breakout🧠 Chart Pattern & Technical Structure:
✅ Main Pattern: Descending Triangle Breakout Setup
A Descending Triangle has formed from the 2023 high to mid-2025, indicating consolidation after a strong downtrend.
Strong horizontal support between $0.05266 – $0.06550 has been tested multiple times, showing strong accumulation in this zone.
The downtrend resistance line is being squeezed, suggesting a potential breakout is imminent if price closes strongly above it.
📈 Bullish Scenario:
If the price successfully breaks above the diagonal resistance:
1. Breakout confirmation would be a strong 4D candle close above $0.08788.
2. Bullish price targets based on historical resistance zones and Fibonacci levels:
🎯 $0.10728 (initial resistance)
🎯 $0.22137 – $0.25000 (strong psychological and technical resistance)
🎯 $0.31966 (former consolidation zone)
🎯 $0.52908 – $0.73257 (major supply zone)
🎯 Ultimate Target: $0.99500
🟢 A rise in volume and a clear higher high would further confirm the bullish trend continuation.
📉 Bearish Scenario:
If price fails to break out and falls below the strong support zone:
1. A breakdown below $0.05266 could lead to:
🔻 $0.04000
🔻 $0.02800
🔻 $0.02000 – $0.01450 (extreme support zone)
⚠️ This bearish case becomes more likely if volume weakens and market sentiment turns risk-off, especially if BTC or broader crypto trends turn bearish.
🧱 Key Support & Resistance Levels:
Strong Support: $0.06550 – $0.05266
Key Resistance: $0.08788 – $0.10728
Next Bullish Targets: $0.22137 / $0.31966 / $0.52908 / $0.73257
🧭 Conclusion:
BIGTIME/USDT is at a critical turning point. A bullish breakout from the descending triangle could trigger a significant upside move. However, caution is advised if the price fails to hold support. Wait for confirmation of breakout before entering heavy positions.
#BIGTIME #BIGTIMEUSDT #CryptoBreakout #AltcoinSeason #DescendingTriangle #CryptoAnalysis #TradingView #BullishCrypto #CryptoSignal #TechnicalAnalysis #CryptoBreakoutAlert

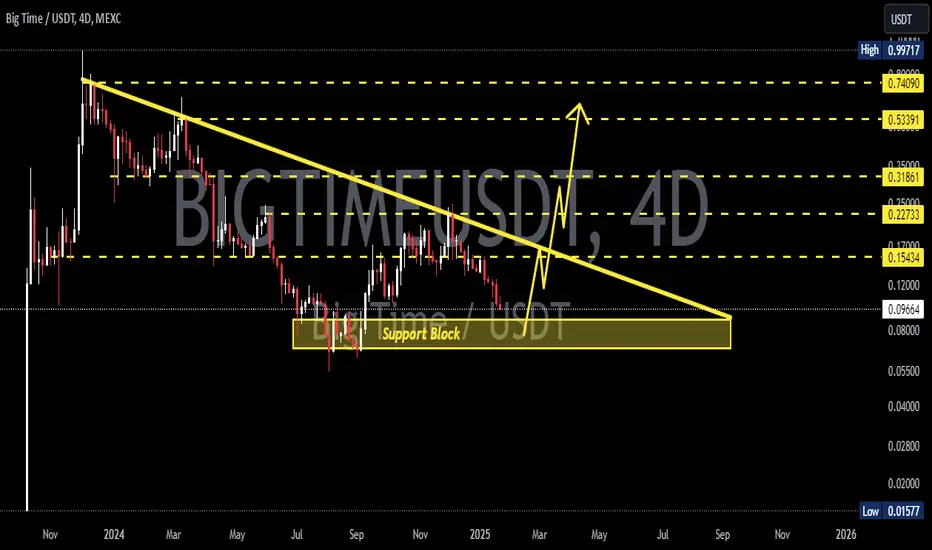
BIGTIMEUSDT 4DBIGTIME ~ 4D
#BIGTIME If you still have Conviction on this coin, buy it gradually from here with a minimum target of 20%++
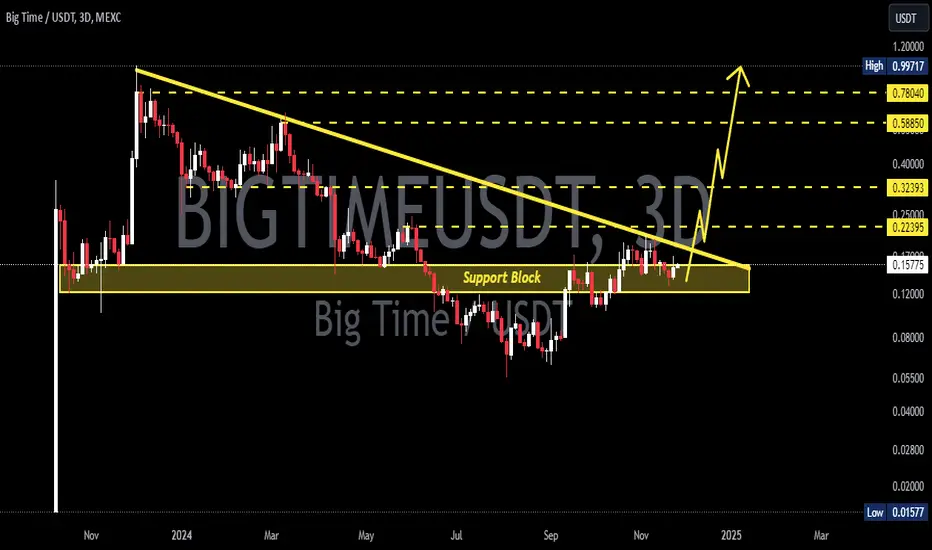
BIGTIMEUSDTBIGTIME ~ 3D
#BIGTIME If you still have Conviction on this coin,. This support block would be a very good buy spot for now,. Buy in stages with a minimum target of 20%++
📈 $Bigtime/Usdt is showing robust strength and potential. BIGTIME/USDT is showing promising signs. It looks like it's gearing up for a bullish move, and I anticipate the price to increase by 15-30% in the coming days. However, it's important to note that this is not financial advice, so please do your own research (DYOR) before making any decisions."

BIGTIME target 1.324h time frame
-
BIGTIME is creating a triangle structure since December 6th, and volume is decreasing gradually, which means BIGTIME is approaching to the end of consolidation. Also, there is a structural support around 0.5, that make SL be clear to set up.
TP: 1.32
SL: 0.4477

BIGTIME will have a big pump againConsidering the time correction we had, it looks like there is still BIGTIME upside potential.
If the SW H is broken in the daily time and there is a consolidation on it, we can see a much stronger rise.
We had a strong bullish movement, which was marked by the SHARP white box.
Then we have made a correction, which we have marked with a white CORRECTION box.
As you can see, these falling and corrective candles could not cover the recent upward SHARP move.
From the green range of OB we can move towards ATH or even beyond ATH.
This analysis is violated when a candle on the daily time frame stabilizes below the green range
For risk management, please don't forget stop loss and capital management
Comment if you have any questions
Thank You
