BIGTIMEUSDT — Descending Triangle Nearing Breakout or Breakdown?Full Analysis
The BIGTIME/USDT chart on the 4D timeframe (OKX) shows a prolonged downtrend with consistent lower highs, capped by a strong descending trendline (yellow). At the same time, price has been holding within a major support zone between 0.038 – 0.055 USDT (yellow box).
This structure forms a Descending Triangle — a classic pattern that often signals bearish continuation, but in some cases, it can also mark the final stage before a strong bullish reversal. Price is now approaching the apex of the triangle, meaning a major breakout (up or down) could happen soon.
---
🔹 Bullish Scenario (Breakout Reversal)
If buyers manage to break the descending trendline with a strong 4D close and higher volume, momentum could quickly shift to the upside. Key resistance levels to watch:
0.0655 USDT → First breakout confirmation.
0.0879 USDT → Next target.
0.1073 USDT → Critical mid-term resistance.
With enough momentum, BIGTIME could extend toward 0.2213 USDT or even 0.3196 USDT in the longer run.
📌 Note: A valid breakout usually comes with a volume spike and a successful retest above the broken trendline.
---
🔻 Bearish Scenario (Breakdown Continuation)
If selling pressure dominates and price loses the major support box 0.038 – 0.055 USDT, the downtrend is likely to extend.
Breakdown below 0.038 USDT on strong volume → clear bearish confirmation.
Next support area: 0.028 – 0.030 USDT.
Extreme target: retesting the historical low at 0.0145 USDT.
📌 Note: Statistically, descending triangles have a higher probability of breaking down, but confirmation is key.
---
⚖️ Technical Summary
Critical Zone: 0.038 – 0.055 USDT (main support).
Bullish confirmation: Break and close above trendline + 0.0655 USDT.
Bearish confirmation: Breakdown and close below 0.038 USDT.
Current pattern: Descending Triangle nearing its apex → Expect a decisive move soon.
BIGTIME is entering a high-pressure zone. In the coming weeks, the market will reveal whether this is the bottom before a reversal, or the continuation of a deeper downtrend.
---
#BIGTIME #BIGTIMEUSDT #CryptoAnalysis #Altcoin #TechnicalAnalysis #DescendingTriangle #CryptoBreakout #SupportResistance #ChartPattern
Bigtimetoken

BIGTIME/USDT Ready to Explode! End of a Long Downtrend? Breakout🧠 Chart Pattern & Technical Structure:
✅ Main Pattern: Descending Triangle Breakout Setup
A Descending Triangle has formed from the 2023 high to mid-2025, indicating consolidation after a strong downtrend.
Strong horizontal support between $0.05266 – $0.06550 has been tested multiple times, showing strong accumulation in this zone.
The downtrend resistance line is being squeezed, suggesting a potential breakout is imminent if price closes strongly above it.
📈 Bullish Scenario:
If the price successfully breaks above the diagonal resistance:
1. Breakout confirmation would be a strong 4D candle close above $0.08788.
2. Bullish price targets based on historical resistance zones and Fibonacci levels:
🎯 $0.10728 (initial resistance)
🎯 $0.22137 – $0.25000 (strong psychological and technical resistance)
🎯 $0.31966 (former consolidation zone)
🎯 $0.52908 – $0.73257 (major supply zone)
🎯 Ultimate Target: $0.99500
🟢 A rise in volume and a clear higher high would further confirm the bullish trend continuation.
📉 Bearish Scenario:
If price fails to break out and falls below the strong support zone:
1. A breakdown below $0.05266 could lead to:
🔻 $0.04000
🔻 $0.02800
🔻 $0.02000 – $0.01450 (extreme support zone)
⚠️ This bearish case becomes more likely if volume weakens and market sentiment turns risk-off, especially if BTC or broader crypto trends turn bearish.
🧱 Key Support & Resistance Levels:
Strong Support: $0.06550 – $0.05266
Key Resistance: $0.08788 – $0.10728
Next Bullish Targets: $0.22137 / $0.31966 / $0.52908 / $0.73257
🧭 Conclusion:
BIGTIME/USDT is at a critical turning point. A bullish breakout from the descending triangle could trigger a significant upside move. However, caution is advised if the price fails to hold support. Wait for confirmation of breakout before entering heavy positions.
#BIGTIME #BIGTIMEUSDT #CryptoBreakout #AltcoinSeason #DescendingTriangle #CryptoAnalysis #TradingView #BullishCrypto #CryptoSignal #TechnicalAnalysis #CryptoBreakoutAlert

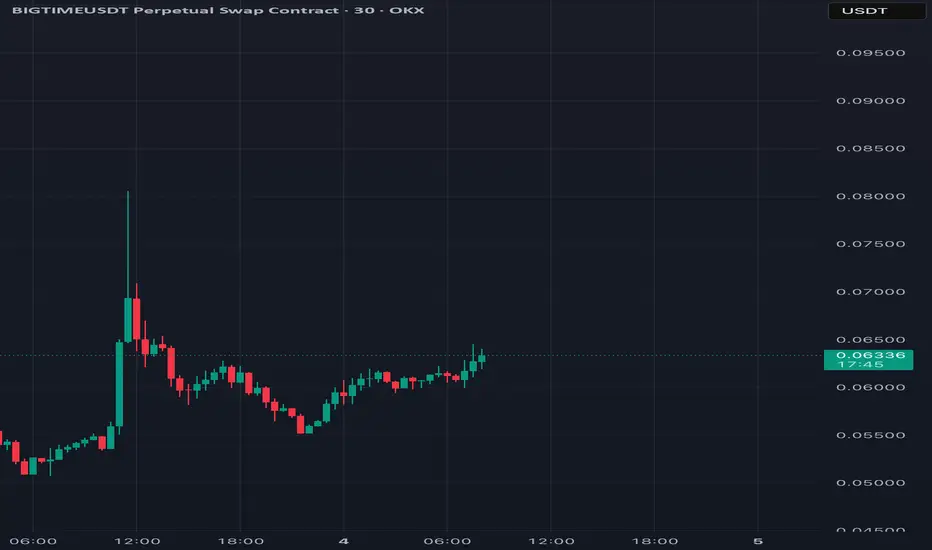
BIGTIME/USDT Analysis – 30-Minute Chart (OKX)BIGTIME/USDT Analysis – 30-Minute Chart (OKX)
Key Support Levels:
Immediate support: 0.06043 USDT
Stronger support: 0.05960 – 0.05515 USDT (Potential entry zone)
Stop-loss (SL): Below 0.04916 USDT (-12.19% risk)
Key Resistance Levels:
First resistance: 0.06485 USDT (Take Profit 1)
Next resistance: 0.06902 – 0.07002 USDT (Major supply zone)
Higher targets: 0.07511 – 0.08055 USDT
Indicators & Market Structure:
Stochastic RSI is in an overbought zone, suggesting a possible short-term pullback.
EMA 20, 50, 100, 200 show bullish momentum, with the price above EMA 20 and EMA 50.
Bearish pressure is decreasing, as buy signals and TP targets are being triggered.
Trade Plan:
Bullish case: If BIGTIME/USDT holds 0.06043 USDT, it may continue towards 0.06485 – 0.07002 USDT.
Bearish case: If price falls below 0.05960 USDT, a deeper correction to 0.05515 USDT is likely.
📌 Summary:
BIGTIME is in a short-term uptrend, but Stochastic RSI suggests a possible pullback before continuation. Holding 0.06043 USDT is key for further upside toward 0.07002 USDT. If price loses support, a retest of 0.05515 USDT is possible. 🚀
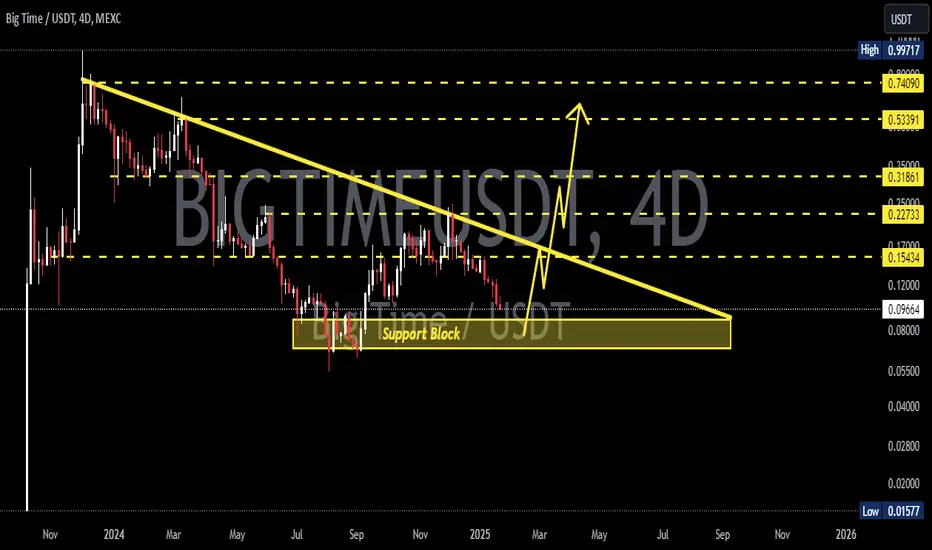
BIGTIMEUSDT 4DBIGTIME ~ 4D
#BIGTIME If you still have Conviction on this coin, buy it gradually from here with a minimum target of 20%++
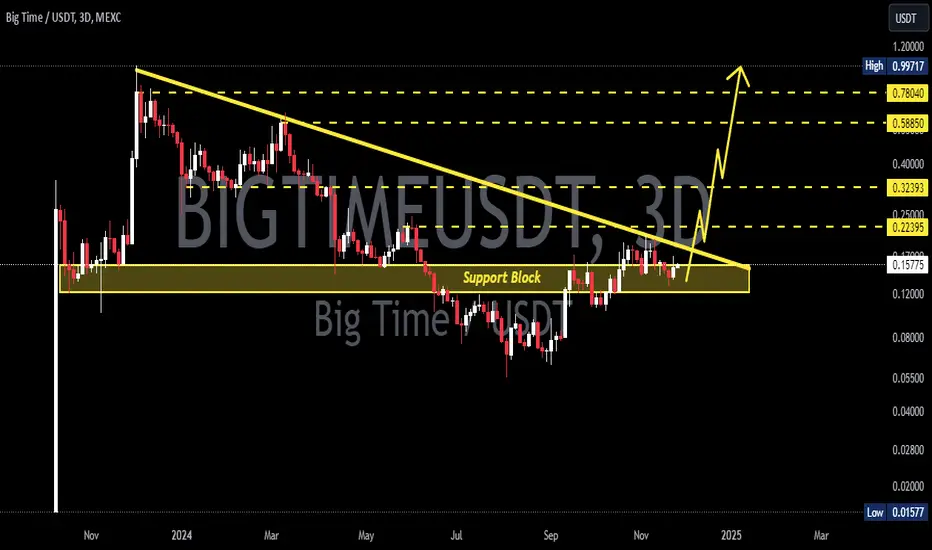
BIGTIMEUSDTBIGTIME ~ 3D
#BIGTIME If you still have Conviction on this coin,. This support block would be a very good buy spot for now,. Buy in stages with a minimum target of 20%++
BIGTIMEUSDT Forms Bullish Flag PatternBIGTIMEUSDT technical analysis update
BIGTIME has formed a bullish flag pattern on the 4H chart, and the price is now moving toward the flag's resistance line for a potential breakout. Once the breakout occurs, we can expect a strong bullish move in BIGTIME. The price is currently trading above both the 100 and 200 EMA. We recommend placing a stop loss just below the 100 and 200 EMA.
Stop Loss: $0.115
Target: 30-90%
Regards
Hexa

ASM or XRP who hits $0.90 first??XRP your favorite(crypto experts only) or some shizz coin that's misspelled on golf bags sent from China??
I actually would bet this hits $0.90 before BIG TIME token also.
What y'all Hedgies and wild cats calling?
NOT FINANCIAL ADVICE!!!
Also come and pick your mom up because this isn't financially feasible for her to spend the night every night.

BIGTIMEBIGTIME / USDT
Price is finally out from the giant falling wedge after trading almost 1 year inside it "bullish pattern"
This coin can make a surprise wild movement
So keep your eyes on it
In a coin like that i prefer the risk managements over anything else

Bigtime is back on my mind and bags are packedWave one is complete?? Retraced to 61.8, sitting at a 50% retracement at the moment!!
.53 is my first target and I repacked my bags.
We might see something like what Sushi just had happen.
Polkadot could see a huge pump also but has already seen this wave 3 and possible last pump for dot is a squeeze? Bigtime could also see a squeeze. I am prepared for a bounce!!
I also think the gaming hype is about to start back up!
NOT FINANCIAL ADVICE!!

Bigtime/USDT Analysis: Looking Good
I have been closely observing the Bigtime/USDT chart, Currently, we await a breakout, which could lead to a strong bullish move in the short term. However, please note that this is my personal opinion and not financial advice. I encourage you to conduct your own research before making any trading decisions.

Bigtime/usdt 1$ Again 📈 Bigtime/USDT Analysis: 🚀
📈 Bigtime/USDT has been exhibiting an intriguing ascending pattern, and it appears that a breakout is on the horizon. Should a breakout occur, there is a strong likelihood that the price will surge towards the $1 level once again. Please note, this is not financial advice.
💡 Stay tuned for potential trading opportunities! 🚀

Bigtime intraday setupBigtime reach fibonacci resistance inside channel down.
Trading plan :
Short at fibonacci or wait at channel down resistance
target 250 pips at 0.5200
good luck

BIGTIME target 1.324h time frame
-
BIGTIME is creating a triangle structure since December 6th, and volume is decreasing gradually, which means BIGTIME is approaching to the end of consolidation. Also, there is a structural support around 0.5, that make SL be clear to set up.
TP: 1.32
SL: 0.4477

Bigtime longIf you love to take risk and more action, you should take a look at #BIGTIME... Ready to go when confirmed...
#trading
@playbigtime
#play2earn

Bigtime bounceWe've seen multiple others get their bounce today and some are lagging behind I believe this is one of them. I see it getting up near the 100% retracement

BIGTIME Caught by Time Correction!From what we have identified, the Bigtime bullish branch seems to have ended and this symbol has entered a correction pattern.
3 ABC waves can be seen on the chart. It seems that wave B is ending and we are entering the bearish branch for wave C.
These symbols have a small volume, I suggest not to enter the position without capital management and stop setting

Bigtime again bigtime Bigtime/usdt
Buyer's are looking strong again, We can expect a good bullsh mive soon, let's see
Not financial advice (DYOR)

BIGTIME/USDT Risky Long Position IdeaBigtime is making a nice formation and if it stays about that red box support and breaks that resistance line then we can open a long position at 0.6433
Good luck ;)

BIGTIME/USDT PERP. 30min ChartThis graph according to my research shows that it is moving in similar pattern to bitcoin and if we see a good volume in Btc, Bigtime can also pump as well. If there's a good volume it break its resistance easily but if the volume leaves we can see it near 0.5100. People can scalp and take short profits according to the low accumulation zone and retests. A good news regarding btc or bigtime can effect it too much as it is one of the trending coin at the moment.
Note: This is not a financial advice.

BIGTIME PAID OUTLet us take a moment to take profits.
Thank our gods, dogs and cats for being this up in profits.
Thank your girlfriend for not helping also if she was like mine.
It has been great!!
Swing trading is good for me I am in cash and like the quick trades... I'M not holding more bags again. Some PolkaDOT, ADA and small amounts of random things.
Have some NEO from 18'.
This is a dynamic market and the easiest part is over.
Protect the wealth you have gained and trust not in your instincts as the programming is in place.
Follow the green candles
NONE OF THIS IS FINANCIAL ADVICE IT CAN GO TO ZERO AND YOUR GIRL WILL BOUNCE ON YOU POSSIBLY bigtime!!

BIG TIME VOLUME INCREASINGThank you for taking the time to review our update. It's essential to emphasize that the following information is not intended as trading advice.
BIG TIME is currently demonstrating significant changes in trading volume, representing a new cryptocurrency with inherent high-risk potential. It's worth noting that when trading below $0.16, the risk factor may escalate. However, if BIG TIME manages to sustain a value of $0.18 or higher, there is the potential for upward momentum and a potential breakout. Please approach this information with caution and conduct your own research and risk assessment before making any trading decisions.

BIG TIMES ahead for BIG TIME!!Is a good risk to reward but I want a little pull back first.
38, 27, 20 are my current levels.
10, 16 cents are also my lower targets.
I do have skin in the game.
NOT FINANCIAL ADVICE!! IT CAN GO TO ZERO!!!

Break rengr for 2-leg*-Technical Analysis 📈
REVERSE-ZONE : start bear-trend so back to breakeven last trend .
*Trade (Buy/Sell) 📊
0.1562$
*-Stop Loss 🔴
0.1506$
*-Take Profit 🎯
1-0.1631$ / 2-0.1711$ / 0.1798$
*-Risk Management 🚧
3%
👨🎓 Experience and Education: Our trading team has five years of experience in financial markets, especially cryptocurrencie
