Bitcoin Hits PRZ — Is This the Perfect Short Entry?Bitcoin ( BINANCE:BTCUSDT ) has entered the Potential Reversal Zone (PRZ) after a strong bullish impulse , testing the confluence of Daily Resistance(3) .
In terms of Elliott Wave analysis , the market seems to have completed a complex WXY corrective structure , with the recent rally likely representing the final wave Y . This makes the current zone highly reactive for potential reversal .
I expect Bitcoin to retrace toward the CME Gap($105,075-$105,055) and possibly continue downward toward the Support zone($104,380-$103,060) and Cumulative Long Liquidation levels if the sellers regain momentum .
Cumulative Short Liquidation Leverage: $107,568-$106,601
Cumulative Long Liquidation Leverage: $105,360-$104,784
Cumulative Long Liquidation Leverage: $103,937-$103,217
Note: It is better to look for short positions at the Potential Reversal Zone (PRZ) or if Bitcoin touches $104,780 before reaching PRZ. That is why I chose to label this analysis as ''Short".
Note: If Bitcoin can touch $107,620 , there is a possibility of breaking the resistance lines and increasing further.
Please respect each other's ideas and express them politely if you agree or disagree.
Bitcoin Analyze (BTCUSDT), 1-hour time frame.
Be sure to follow the updated ideas.
Do not forget to put a Stop loss for your positions (For every position you want to open).
Please follow your strategy and updates; this is just my Idea, and I will gladly see your ideas in this post.
Please do not forget the ✅' like '✅ button 🙏😊 & Share it with your friends; thanks, and Trade safe.
Bitcoin (Cryptocurrency)

Bitcoin Short-Term Recovery Confirmed Bulls Win!Ranging markets/sideways markets is when traders lose the most money. Always keep this in mind.
» Short-term signals are pointing to a recovery right away.
» Bitcoin's drop wicked below the 13-June low but the RSI produced a higher low and thus we have a bullish divergence.
» Bitcoin's current drop went lower yet the chart reveals lower volume now compared to 13-June. This reveals weakness on the bear camp. This means a recovery will happen next, right away.
These are just a few signals but taken together with the altcoins analysis that I showed you and the bigger picture; Ha ha! The bulls win again.
Namaste.

Bitcoin Crash Predicted! Here are the next targets! Bitcoin is crashing as predicted, and here I am showing you the next targets, and the changes in market structure that would make me take profits earlier!
Enjoy and feel free to smash the rocket button if you feel the bearish vibe!

Become Rich Trading Bitcoin Strategy Simplified Correction NullIs this a shakeout or a rejection?
A rejection implies no bullish action short-term thus lower prices. It is still early on the current move.
A shakeout implies a bear-trap and bullish action soon to follow, as soon as the shakeout is complete.
Daily and weekly close
Let's be fair and honest, it is too early to say. To determine if the current move is either a rejection or a shakeout we have to wait for the close today.
Price action
Why are these two in question? Because the daily session moved higher today reaching $106,500 followed by lower prices. The low hit $102,309, lower than 13-June but higher than 5-June, a higher low. More information can be acquired once the trading session closes but, we can move ahead and see what the chart has to say based on other signals.
The volume is low on the bearish side, on all sides. The higher low so far is strong. As long as $102,000 holds Bitcoin is ultra-hyper bullish, very strong. Even if we are considering the short-term it doesn't matter, if the action is happening above this level the bulls are wining and that's what we have.
If the action is happening above $100,000 we already know what this means and this level is not in question right now. Being price oriented that is why I say is still early, do you agree?
So, more shakeouts, more sideways, more retrace—a non-event; short-term noise.
We are looking for the next major move, not the next $1,000 drop.
Market conditions do not change
Rest easy, Bitcoin will continue bullish even if it wicks below 100K. As long as it trades above this level, or the $100,000 to $102,000 price range, the action is safe (coming from the bulls).
If the week closes above this range but starts red next week and goes below, no need to panic because the week can start red just to recover and this would only be a continuation of the shakeout; we take information from the weekly close and not the intra-week action makes sense?
Questions —Leave a comment
So, what is your take?
Just let me know truly, what is your belief?
Do you think Bitcoin is bearish or bullish?
It can be looked at in many different ways.
The bull market
The trend is bullish, mid- to long-term. The action is happening above 100K.
The altcoins market is weak but we all know from the bottom we grow, we are entering the summer now... Ahhh, the beautiful summer, bring the heat. With the summer prices tend to grow.
You can call it a relief rally but that will be only the start. The relief will turn into a major bullish wave and this wave will transform into a major bull run.
Motivation
I love you again wishing you the best forever more.
You deserve the best now and always.
Keep at it and keep trying, persistence is the key. As long as we continue to trade, in the end we are sure to win.
Invest in Crypto, it is very easy.
Think of all the people that joined us (the market) 10 years ago. What are their holdings worth now? Millions upon millions... Now, think of yourself 10 years into the future. Put whatever money in you can afford and watch it grow.
The way to riches is not through frugality or savings, the way to riches is through buying and investing. This is the right market for us. It is fast, it is volatile, it is young; just like most of us. If not young of age, we are young at heart.
Namaste.

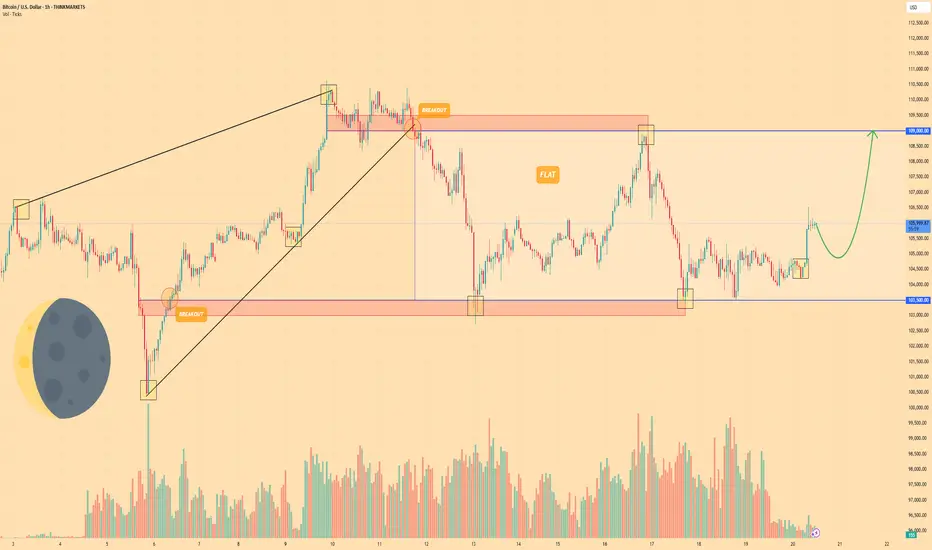
BITCOIN - Price can continue grow inside flat to $109000 levelHi guys, this is my overview for BTCUSD, feel free to check it and write your feedback in comments👊
A few days ago, the price entered a wedge, declining below the $103500 level and then making a strong impulse up.
Next, price broke $103500 level one more time and rose to resistance line of wedge, after which started to decline.
BTC broke $109000 level and started to trades inside a flat, where it declined to support level and then bounced up.
Price rose to resistance level, which is top part of flat, and then at once dropped back and started trading close.
But some time later, price bounced from this level and started to grow, and even now it continues to grow.
So, I think that BTC can make a small correction movement and then continue to grow to $109000 level.
If this post is useful to you, you can support me with like/boost and advice in comments❤️
Disclaimer: As part of ThinkMarkets’ Influencer Program, I am sponsored to share and publish their charts in my analysis.
Bitcoin CME Gap June 21thBitcoin has a CME gap at $103.292 . Historically, these gaps tend to get filled and if it happens again, it could mean a short-term move before continuation.

ADA | BTC | ET | Why ALTSEASON is COMING SOONAfter a -34% retracement, ADA is ready to go higher alongside with the rest of the alt market.
We see a very interesting phenomena here, were ADA also represents a large part of the larger alts: BTC pulls back, ETH is starting to increase or trades sideways (before the increase) whilst the alts dip.
This is actually BULLISH for alts, showing the very clear rotation between BTC, ETH and top 15 alts.
If we look at the macro of ANY of the alts I've been working through recently, a similar pattern appears - a clear bottom, followed by a sideways trade. This is usually the point just before the big ALTS season.
We actually see this pattern at the end of the 2018 rally, as well as after the 202- Covid dip:
The bottom line -
ADA and other alts are gearing up for their ALTSEASON. With patience, we will soon see some great gains across the markets.

btcusd two weeks trump time scale bearishTrump TACO time scale two weeks looks reasonable time scale
2W candle of #Bitcoin closing this weekend.
If CRYPTOCAP:BTC will not hold the 104000 - game over we visit margin call level of Saylor's Strategy 60 000 and most possibly lower 30 000

FROM ATH TO ATH BTC FRACTAL use 3.14The graph is fractal and cyclical. I used the number pi to predict where the atx plus might be, taking into account the fractals for bitcoin from previous ideas and the idea for xrp, where the number pi worked perfectly.

Middle East Tension & Markets: My Honest Stance🌍🕊️✌️ Middle East Tension & Markets: My Honest Stance 💣 🔥 🗡️
Hi everyone,
It’s Friday, June 20th — and we face a fragile moment: the uncertainty of possible US military action against Iran. 📉📰✈️
On my charts:
Bitcoin (BTC) reached key resistance and now ranges sideways as we await clarity.
Gold (XAUUSD) remains the classic safe haven — it holds an ascending structure, but profit-taking could trigger dips if markets crash.
Silver (XAGUSD) is similar, yet needs broader industrial strength to outperform gold.
Crude Oil (WTI) could spike dramatically if bombs fall — but I choose not to profit from pain.
USDJPY & USD pairs reflect global trust in the dollar and US stability — I’ll cover this more next week.
My personal stance is simple:
💙 I never short disasters. I never profit from human suffering. I am LONG on humanity and peace. 🕊️✌️🌈
👉 I expect potential market gaps between now and Monday:
✅ Bad news (war) → gold, silver, oil likely pump
✅ Good news (diplomacy) → risk assets rebound, oil stabilizes
I am positioned carefully with small risk and clear stops. My goal: protect my capital, trade my plan, but never bet on pain. If I lose because peace prevails — I win as a human.
Stay safe, trade wisely, and never forget: sometimes the best trade is no trade at all.
One Love,
The FXPROFESSOR 💙
Disclosure: I am happy to be part of the Trade Nation's Influencer program and receive a monthly fee for using their TradingView charts in my analysis. Awesome broker, where the trader really comes first! 🌟🤝📈

BTC - Key Battle Between Bulls and Bears – Symmetrical TriangleBitcoin ( BINANCE:BTCUSDT ) is currently consolidating within a Symmetrical Triangle , showing indecision among Bulls and Bears around the Support zone($104,380-$103,060) and just above the 50_SMA (Daily) .
From an Elliott Wave perspective, the current range may represent a WXY corrective structure . The market seems to be waiting for a breakout direction , potentially aiming to complete wave 5 after this correction.
The Monthly Pivot Point($103,300) and the presence of significant Cumulative Liquidation Leverage Zones (both Long and Short ) are key liquidity magnets to watch in the short term .
I expect Bitcoin to re-attack the Support zone($104,380-$103,060) AFTER breaking the lower line of the Symmetrical Triangle Pattern and decline to the targets I have outlined on the chart.
Note: Stop Loss: $106,703 = Worst Stop Loss(SL)
Please respect each other's ideas and express them politely if you agree or disagree.
Bitcoin Analyze (BTCUSDT), 1-hour time frame.
Be sure to follow the updated ideas.
Do not forget to put a Stop loss for your positions (For every position you want to open).
Please follow your strategy and updates; this is just my Idea, and I will gladly see your ideas in this post.
Please do not forget the ✅' like '✅ button 🙏😊 & Share it with your friends; thanks, and Trade safe.

Bitcoin Weekly Ultra-BearishThe 100K support is still valid but the weekly timeframe chart isn't looking good.
Good afternoon my fellow Cryptocurrency trader, how are you feeling today?
Bitcoin peaked the week 19-May. Then we have bearish action only.
The week after 19-May was red, then two neutral weeks and a continuation this week. It looks pretty bad right now, terrible to be honest.
» The main support range sits between $82,500 and $88,888.
Thank you for reading.
This support zone will only become active is 100K breaks on the weekly timeframe.
Namaste.

BTC, will hibernate for a few weeks from here to sub 100k.BTC rise has been impressive the last few weeks with market triggering excitement after hitting a series of ATH and finally punching the elusive100k levels, and pushing it further to 110k as a bonus.
But like with any overheated parabolic move, a cool down will need to transpire eventually. And that season is ripe now for the king of coins.
From the diagram we are seeing some curve fitting price action, with horizontal ranging at the upper channel -- indicating a bull saturation scenario.
A corrective phase to 0.5 fib levels maybe expected in the next few weeks. It did the same behavior last time. This hibernation would be healthy in the long run - and it needed to happen.
Spotted at 104k.
Target sub 100k levels / or 0.5 fib at 94k.
TAYOR.
Trade safely.

BITCOIN This is the long-term picture. Don't get distracted.Bitcoin (BTCUSD) has been consolidating lately after making a new All Time High (ATH) last month and this is already making part of the market nervous over whether that's the Cycle Top or not.
This is one of those times when it would be best to ignore the short-term noise/ volatility and stick to the long-term picture. And that's exactly what's shown on this chart, with BTC on the 1M time-frame showing the incredible symmetry among its 4-year Cycles, with Bear Markets lasting 12 - 13 months and Bull Markets 35.
Based on that, this Cycle's Top is expected to be priced by October (2025). This also matches the Sine Waves as implied by the 1M RSI, which as been trading within a Channel Down (diminishing returns) since Bitcoin's inception.
So do you also think that we have around 4 months before the market tops? Feel free to let us know in the comments section below!
-------------------------------------------------------------------------------
** Please LIKE 👍, FOLLOW ✅, SHARE 🙌 and COMMENT ✍ if you enjoy this idea! Also share your ideas and charts in the comments section below! This is best way to keep it relevant, support us, keep the content here free and allow the idea to reach as many people as possible. **
-------------------------------------------------------------------------------
💸💸💸💸💸💸
👇 👇 👇 👇 👇 👇

BITCOIN (BTCUSD): Strong Bullish Confirmation?!
Bitcoin has a high chance to rise more, following
a strong bullish reaction to a rising trend line on a 4H.
Goal - 108000
❤️Please, support my work with like, thank you!❤️

Middle East Tension: Read This Before You Trade today⚔️🕊️💣 Middle East Tension: Read This Before Markets close for the Weekend 🌍🔥✌️
Video:
Hey traders,
Today’s landscape is delicate and raw: we stand between a possible US strike on Iran and a chance for leaders to step back from the edge. Many are asking: Should I bet on gold? Should I short the indices? Should I buy oil?
Here’s my honest read, straight from today’s video (which I highly recommend you watch for full context 📺):
👉 Bitcoin (BTC)
Still ranging sideways. The last move hit my resistance zone perfectly. For now, BTC keeps its cool — but watch out: global fear can spark sudden moves, or the opposite, a liquidity crunch.
👉 Gold & Silver
Yes, they’re classic safe havens — but don’t fall for the textbook trap. When true chaos strikes, big players often sell profitable gold positions to cover losses elsewhere. So an initial spike is possible, but deep pockets can reverse it fast. This is why I’m cautious: I do not expect a guaranteed pump on gold or silver.
👉 Crude Oil (WTI)
The chart says it all: any strike in the Middle East fuels oil prices fast. But as I’ve always said — I do not long oil during human tragedy. Ethics over easy pips.
👉 Indices & USDJPY
Gaps are likely. Risk assets may get hammered if bombs fall. If leaders choose dialogue instead, expect a risk-on rebound. The USD stays a wildcard: trust in the US remains, but shocks test that trust.
👉 Airlines Pausing Flights?
Yes — major airlines are avoiding the Gulf. That alone signals how real this risk is.
✅ My plan is clear:
I never short disasters. I never profit from pain. I am LONG on humanity and peace. I’d rather lose a trade than wish for blood in the streets.
I do have some carefully calculated positions open tonight — fully risk-managed and small-sized. If Monday gaps bless me, fine. If peace wins and my trades lose? Even better.
👉 Watch the full video for my live charts, context, and unfiltered thoughts.
This text is just a recap — the full idea is already posted as a video.
Stay sharp. Stay ethical. Protect your capital and your soul — one good trade is never worth your humanity.
One Love,
The FXPROFESSOR 💙
Disclosure: I am happy to be part of the Trade Nation's Influencer program and receive a monthly fee for using their TradingView charts in my analysis. Awesome broker, where the trader really comes first! 🌟🤝📈

Bitcoin may rebound from support line of wedge and start to growHello traders, I want share with you my opinion about Bitcoin. Initially, the price was trading inside a well-defined range, moving sideways with repeated rejections from both support and resistance. After several attempts to stay above the support zone, BTC finally broke down and sharply declined below the 104000 level, entering the buyer zone. However, the decline was short-lived. Price quickly rebounded from the lower boundary and formed a strong bullish candle, suggesting that buyers were still active. After this recovery, BTC began forming a wedge pattern, with a gradually narrowing structure between the resistance line and the ascending support line. This kind of price action typically signals a buildup of pressure and potential breakout. Currently, BTC is once again testing the support line of the wedge and hovering near the buyer zone, where it previously reversed. This level has proven significant and is now being retested. Given the current structure, the wedge formation, and price behavior near the support, I expect BTC to rebound from this zone and start climbing back toward the upper resistance area. My current TP 1 is set at 106800 points, which aligns with the mid-level of the previous impulse zone and the inner resistance of the wedge. Please share this idea with your friends and click Boost 🚀
Disclaimer: As part of ThinkMarkets’ Influencer Program, I am sponsored to share and publish their charts in my analysis.

Coinbase Global Inc. Bullish Confirmed Confirms Bullish BitcoinCOIN's chart looks very similar to Ethereum. Today's action reveals something great; bullish confirmed.
Always, since this stock started trading, it has been moving as a unit together with Bitcoin and the entire Cryptocurrency market.
When Bitcoin is bullish, Coinbase is bullish.
When Bitcoin is bearish, Coinbase is bearish and vice versa.
Here we have a very strong, high volume bullish breakout on COIN. This means that Bitcoin, Cardano, Ethereum, XRP, Dogecoin, Avalanche and the rest of the Cryptocurrency market is about to break bullish really strong.
There was a low point 7-April 2025. The same with the projects I just mentioned above.
Here this 7-April low marks a double-bottom compared to September 2024. After this low, the recovery starts and we have a strong rise.
In late May, there is a price peak and we enter a consolidation phase, in this case a small retrace. The chart is identical to ETHUSDT.
After a strong higher low, some minor bearish action with no bearish pressure, Coinbase is going up. You can expect the exact same dynamic happening to Bitcoin and all the Altcoins. Bullish confirmed. The market will resolve green.
Today Coinbase hits the highest price since February 2025.
Namaste.

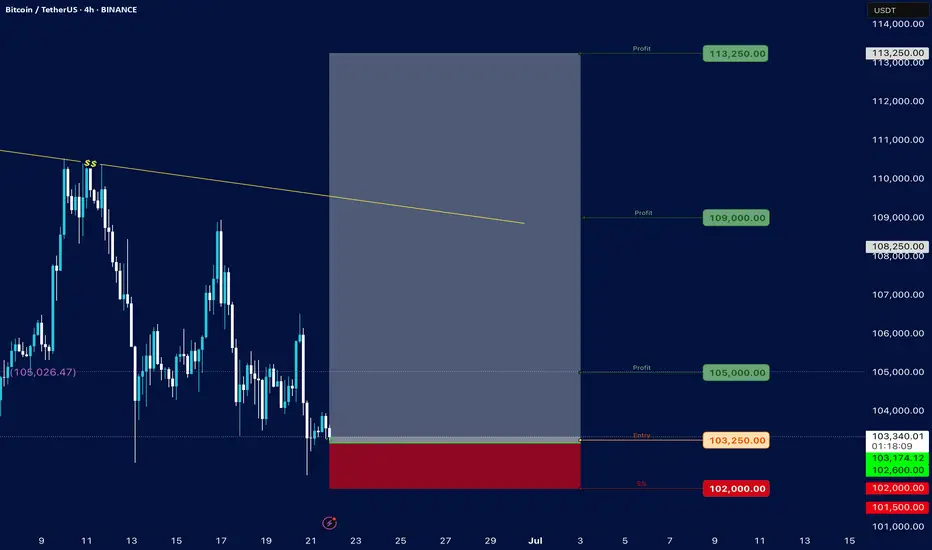
Bitcoin### Bitcoin Price Analysis (June 21, 2025)
#### **Current Price**: $103,236.15 (as of the snapshot)
- The price is hovering near the lower end of the recent range, with key support at **$102,000** (marked as "S/s" on the chart).
- Resistance levels are visible at **$105,000**, **$107,000**, and **$110,000–$114,000**.
#### **Key Observations**:
1. **Support and Resistance**:
- **Strong Support**: $102,000 (critical level; break below could signal further downside).
- **Immediate Resistance**: $105,000 (previous entry point and psychological level).
- **Higher Targets**: $110,000–$114,000 (if bullish momentum returns).
2. **Price Action Context**:
- The price recently rejected the $105,250 level ("Entry") and is now testing lower support.
- The "Profit" markers at $105,000 and $105,026 suggest these were take-profit zones for traders.
3. **Trend and Sentiment**:
- The chart shows consolidation between $102,000–$110,000, with no clear breakout yet.
- A hold above $102,000 could lead to a retest of $105,000, while a break below may target $100,000 or lower.
4. **Volume and Timeframe**:
- The snapshot lacks volume data, but the date range (June–July) suggests a medium-term view.
- Key dates to watch: June 25–28 and early July for potential volatility.
#### **Conclusion**:
- **Bullish Case**: Hold above $102,000 and reclaim $105,000 to aim for $110,000+.
- **Bearish Risk**: Break below $102,000 could accelerate selling toward $100,000 or $99,000.
**Actionable Insight**: Watch the $102,000–$105,000 range for a breakout or breakdown. A rebound from support with volume could signal a buying opportunity, while a drop below $102,000 may indicate further downside.
*(Note: The analysis is based on limited data from the snapshot. For a full assessment, additional indicators like RSI, MACD, and volume would be needed.)*
Bitcoin Could Hit as High as $400KWhen comparing our macro cycle to the 2017 cycle, we see the potential for a very parabolic run on Bitcoin. I believe Bitcoin could hit as high as $400K by 2029. This is because Bitcoin tends to follow the stock market, and I anticipate a major blow-off top coming for the stock market. I expect one more big parabolic run on the Dow Jones leading up to 2029, which would fuel Bitcoin’s rise to $400K.
The lowest I see Bitcoin going during this parabolic run is $250K. On the higher end, I could see it hitting $400K or even more. Big things are coming.
As always, stay profitable.
— Dalin Anderson

$BTC correction: targets 101k, 97.5k, 94k, 87kThe hype is peaking — institutions, banks, Wall Street, and even governments are buying Bitcoin.
Yet despite the frenzy, BTC has been rejected three times around the $110K level and appears to be heading into another correction.
Bitcoin maximalists are pushing a strong FOMO narrative to attract retail investors, but several factors are pushing back:
- Psychological barrier: At these price levels, retail investors are hesitant. Owning just a "fraction" of a Bitcoin doesn’t appeal to the average person.
- Geopolitical tension: The conflict with Iran is serious. This isn’t a small, isolated country — Iran is a millennia-old civilization with global alliances. This situation won't resolve quickly or easily like Libya, Syria, or Iraq.
- Oil price surge: Escalating tensions could disrupt the Strait of Hormuz, a critical route for global oil. Western sanctions on Russia already strain supply — if Iran joins, where will Europe get its energy? U.S. supply won’t be enough. Expect a spike in inflation.
- Recession risks: Persistent inflation could drive a recession in the second half of the year.
- Trade wars & tariffs: No resolution, just chaos.
- Ukraine-Russia war: Still unresolved. Still draining global stability.
In short, the world is burning — and this is terrible for markets.
Bitcoin maximalists — some even selling company shares to buy more BTC — may soon face the harsh reality: Bitcoin needs a deeper flush before it can rally again. Retail won’t return until altseason clears the way and resets sentiment.
In a cycle dominated by propaganda, institutional manipulation, and global unrest, predictions are fragile. The only guide left: the chart.
Technically, we’re in correction mode again. Comparing with past cycles, potential pullback targets are:
$101K, $97.5K, $94K, $87K
There’s massive support at $74K, but it's unlikely we revisit it soon.
Stay cautious. DYOR.
#Bitcoin #CryptoMarket #BTCUpdate #Geopolitics #Altseason #CryptoCorrection #MacroView #CryptoFOMO #RiskAssets #DYOR
MicroStrategy another pull back before all time high?NASDAQ:MSTR analysis update..
📉 𝙇𝙤𝙣𝙜 𝙩𝙚𝙧𝙢 The weekly R5 pivot target is bold at $1500 but definitely possible as a max greed scenario when the triple tailwind of Bitcoin, SPY and Bitcoin treasury companies trends return.
📉 𝙎𝙝𝙤𝙧𝙩 𝙩𝙚𝙧𝙢 retracement is expected to end around the S1 pivot at $341 and a secondary target of $321.
Irans conflict has investors shaken and not willing to hold assets over the weekend on the fear of worse. However, if the conflict is resolved soon investors could have a great buying opportunity.
𝙏𝙚𝙘𝙝𝙣𝙞𝙘𝙖𝙡 𝘼𝙣𝙖𝙡𝙮𝙨𝙞𝙨
Price appears to have completed wave (B) of an ABC correction in wave 4. Wave C is underway with an expected thrust down (such is the nature of wave C) towards the daily S1 pivot $341. This is also the 0.382 Fibonacci retracement, a high probability area for wave 4 to end. A deeper correction will bring up a triple shield of the High Volume Node, ascending daily 200EMA and 0.5 fibonacci retracement at £321.
Daily DEMA has death crossed.
Safe trading

BITCOIN SUPPORT AHEAD|LONG|
✅BITCOIN is set to retest a
Strong support level below at 101,000$
After trading in a local downtrend for some time
Which makes a bullish rebound a likely scenario
With the target being a local resistance above at 105,000$
LONG🚀
✅Like and subscribe to never miss a new idea!✅
Disclosure: I am part of Trade Nation's Influencer program and receive a monthly fee for using their TradingView charts in my analysis.
