$BTC not finished yetHey!
I'm still me, just a quick rebranding honoring my father.
CRYPTOCAP:BTC cycle is far from over. Not saying we bottomed yet. I think prices bewteen 96 - 102k could be reached on the upcoming days.
Althought this bearish momentum, we should encounter a goooood support level which would lead us to a great short absortion. If price holds those levels this week (maybe next too) there is a high chance we will see a new leg above the ATH level.
Im long here. Stay tuned
Bitcoin (Cryptocurrency)

Bitcoin Daily: It Will Go Lower, I Will Explain WhyIt is hard to make these predictions because there are so many different points of view, so many opinions. There is so much data available that one can easily become confused. We can write an entire book about Bitcoin's next move and still not know what will happen next. I will keep it simple and straight forward and you will be able to understand and appreciate how easy it is when we focus on the chart only. Bitcoin is breaking below 100K.
Bitcoin is already trading at support. The mid-May consolidation range. From this range Bitcoin produced an advance and hit a new all-time high. The all-time high is a triple-top when we take the highs from January 2025 and December 2024. The fact that the action happens below this level now is bearish and this range has been confirmed as resistance.
The market will look for strength and this simply means lower.
Since resistance has been confirmed after a 50% rise, it is normal to see a retrace, can be medium-sized to balance out the strong-long bullish wave. Bullish action was present between 7-April until 22-May, 45 days.
The current retrace can take only a few weeks, think about 15-21 June as a rough estimate but nothing more (can end much sooner).
If you are unprepared and don't have map of the bigger picture, this can become terrifying and even lead to poor decisions at some point. If you know that this is only a retrace and the market will continue growing after a test above 90K, you can rest easy or even take advantage of this situation.
Now, what Bitcoin does is not the entire market. In a bull market, when Bitcoin moves down, money flows to the Altcoins. When Bitcoin goes sideways, the Altcoins grow. So dynamics will be much, much different now compared to what you saw in 2024, 2023 and 2022. The way the market will behave it is basically new for most participants.
The conclusion is that all is good and the chart is pointing lower short-term. After a short-term retrace, we get additional growth. Simple isn't it? It is...
Thank you for reading.
Namaste.

TONCOIN Hits First Target with 27% Gain – More Upside Ahead?By examining the #TONCOIN chart on the 3-day timeframe, we can see that after the last analysis, the price successfully hit the $3.64 target and has gained a total of 27%. Following this rise, the price entered a corrective phase and is currently trading around $3.15. The analysis remains valid, and I still expect further upside from this cryptocurrency. The expected return is around 20% in the short term, 40% to 55% in the medium term, and 110% in the long term.
Please support me with your likes and comments to motivate me to share more analysis with you and share your opinion about the possible trend of this chart with me !
Best Regards , Arman Shaban

TradeCityPro | Bitcoin Daily Analysis #105👋 Welcome to TradeCity Pro!
Let’s dive into Bitcoin and key crypto indices. As usual, in this analysis, I’ll walk you through the triggers for the New York futures session.
⏳ 1-Hour Timeframe
On the 1-hour chart, as you can see, Bitcoin’s correction phase began after the breakdown of the 107010 level. Currently, after pulling back to the 105673 area, it seems ready to begin its next corrective leg.
✔️ One of the reasons Bitcoin has moved downward over the past few days is the escalation of war between Ukraine and Russia. As the conflict intensified, risk assets like Bitcoin dropped while safe-haven assets like gold surged.
🔍 Currently, price action is forming an expanding triangle and is trending downward. It was recently rejected from the triangle’s top and is now sitting on a key support at 103899.
💥 If 103899 breaks, a short position targeting 101750 could be triggered. Selling volume has increased significantly, confirming bearish momentum, so opening a short upon a break of 103899 appears logical. However, keep in mind that the primary market trend remains bullish, and there is a high probability that any short may hit stop-loss.
📈 For a long position, the first trigger would be a breakout above the triangle. In this case, breaking 105673 could justify entry. Key overhead resistances are located at 107010 and 110256.
👑 BTC.D Analysis
Looking at Bitcoin dominance, the metric continued its upward move to reach 64.67 and has since been rejected from that level.
⚡️ If the bullish move continues, the breakout above 64.67 would act as a bullish trigger. On the other hand, a breakdown below 64.29 would confirm a bearish shift.
📅 Total2 Analysis
Total2 is currently ranging between 1.13 and 1.16. A breakout from either side could serve as a trigger for a directional position.
📊 If 1.13 breaks, a short position could be considered. Conversely, breaking above 1.16 would signal a potential long.
📅 USDT.D Analysis
After breaking above 4.70, USDT dominance has been ranging between 4.70 and 4.79. It’s now heading back toward the 4.79 resistance.
🧩 If 4.79 is broken, the next bullish leg in dominance may begin. A drop back below 4.70 would bring the dominance back into its previous range and could lead to further downside toward 4.49.
❌ Disclaimer ❌
Trading futures is highly risky and dangerous. If you're not an expert, these triggers may not be suitable for you. You should first learn risk and capital management. You can also use the educational content from this channel.
Finally, these triggers reflect my personal opinions on price action, and the market may move completely against this analysis. So, do your own research before opening any position.

Does Bitcoin Keep You Up at Night?Just a meme I made this morning.
The Weekly All Time High Breakout has failed, twice, just like 2021...

Bitcoin Wasn't Built for Bull Runs — It Was Built for This MomenDear traders,
You may be witnessing a “first” — a pivotal moment right before things begin to spiral.
We’re not fortune tellers. We don’t claim to predict the future.
But what you’re about to read is based entirely on **publicly available data**, interpreted not through speculation, but through a deep, rational analysis of interconnected facts — the kind of connections that most overlook, and few dare to question.
We may not know how the future is being orchestrated behind the scenes...
But one thing seems certain: **crisis always comes first...** and *then* we are given a **narrative** to justify it — be it war, a pandemic, or a "global emergency."
This is the correct sequence... and it’s the one they never teach you.
Yet for those of us who navigate the financial markets, one question matters more than all others:
**How do we profit from this?**
---
We recently shared an important setup on the **Nasdaq index**, the benchmark that reflects — to a large extent — the true state of the U.S. economy.
As a proxy for the 100 largest American corporations, the Nasdaq plays a critical role in signaling macro trends.
And while some are just now waking up to the storm ahead, **our outlook has been clear since October 2022**:
A major economic crisis was not only probable… it was **inevitable**.
Some analysts chalk this up to uncontrolled money printing post-2019 as governments tried to patch the damage from the COVID-19 crisis. That’s one explanation.
But at **Glich**, our vision is different.
More complex.
And for now… **not something we can fully release**.
---
For years, strong correlations between **risk markets** — especially U.S. equities and crypto — held firmly in place.
But something changed on **May 30th, 2025**. Completely and unmistakably.
The link was severed.
Now ask yourself:
**Why was Bitcoin created in the first place?**
It wasn’t just digital money.
It was a bold, revolutionary idea. A system designed for a future economy no longer shackled by inflation, central banking failures, or hidden agendas.
A fluid, transparent, and secure network for a world in desperate need of change.
The current financial model is obsolete. It’s no longer evolving — just surviving.
And it can no longer answer the challenges of what's to come.
**2008 was not the collapse; it was the setup.** A convenient pretext to slowly roll out something **new**.
And "Satoshi Nakamoto"? Well, let’s just say...
**That name means more than you think.**
_"HIDDEN INFORMATION"_ 👁️
---
What does NEO mean when he says:
> "This has all happened before… yet it’s happening for the first time"?
And what does that have to do with us?
This analysis is *not* just about charts or setups.
It’s a **hidden message** — a spotlight on a once-in-a-generation opportunity lying in plain sight.
But not everyone is trained to read between the lines.
---
Let us ask:
- Why was **Donald Trump** specifically pushed into position?
- Why is crypto — after being suppressed, banned and attacked worldwide — now being quietly **promoted** and fast-tracked in legislation during 2024 and 2025?
Something’s moving beneath the surface.
---
### 🔍 In summary:
- Expect a tidal wave of **global crypto legislation** to pass in the coming **days/weeks/months**.
- Crypto — particularly **BTC and ETH** — will become silent **stores of value** during the economic storm.
- Expect record-breaking levels: **$400K for Bitcoin**, **$40K for Ethereum**.
Yes, this may sound like science fiction…
But keep your eyes and ears wide open. 👁️
- And brace yourself for a **historic collapse** in U.S. equities. Possibly… something we’ve never seen before.
---
The show is starting.
And we won’t spoil the ending — because watching it unfold is part of the experience.
But here’s what we *can* say, thanks to our proprietary **algorithmic system**:
- The **U.S. economy will bleed**.
- And crypto will blow past expectations — fulfilling the very purpose it was built for.
---
🛒 Load your bags in the coming days...
Because when this train leaves the station —
It won't be stopping for anyone.

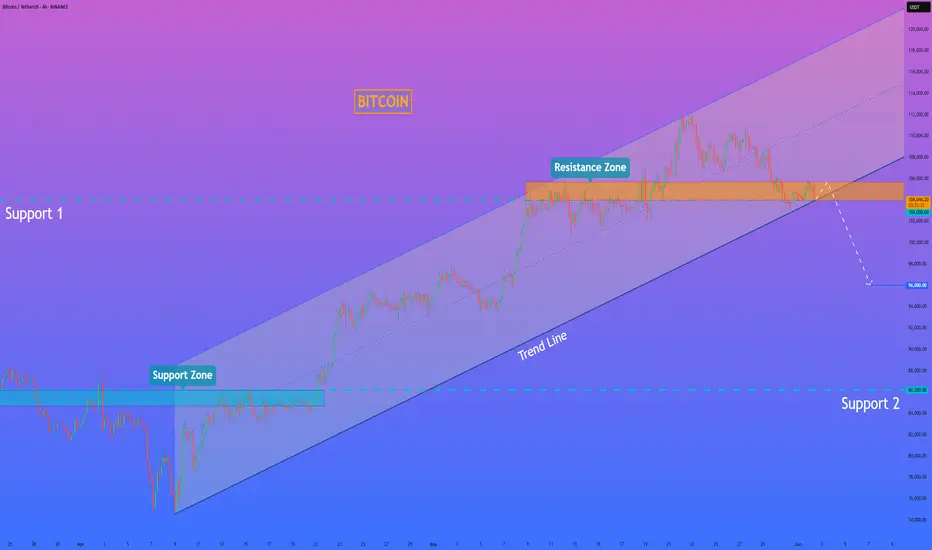
HelenP. I Bitcoin can exit break trend line and continue to fallHi folks today I'm prepared for you Bitcoin analytics. After looking at the chart, we can see how the price declined and broke support 2, which coincided with the support zone. Then the price rose to the support zone but turned around and dropped to the trend line. After this movement, BTC started to grow inside an upward channel, where it soon rose to support 2, which soon broke it and continued to move up. In the channel, price rose to support 1 and some time traded near this level. Later, BTC broke it and rose to the resistance line of the channel and turned around, and dropped to support 1. And at the moment, it traded inside the resistance zone, which coincided with the support level. So, I expect that BTCUSDT will break the support level, which coincides with the trend line, and continue to decline, thereby exiting from upward channel. That's why I set my goal at 96000 points. If you like my analytics you may support me with your like/comment ❤️
Bitcoin: What's next?BTC has lost local support around $107k and currently testing previous resistance around $104k.
If buyers are able to step in between $100k - $104k and reclaim $107k, it will signal strength.
If BTC experiences continued weakness, losing $100k as support, I would expect price to test the $95k - $97k region or 1D 200MA before signaling a reversal.

Descending right angle broadening pattern.Descending right angle broadening pattern and ABC correction waves after 5.wave.
* The purpose of my graphic drawings is purely educational.
* What i write here is not an investment advice. Please do your own research before investing in any asset.
* Never take my personal opinions as investment advice, you may lose your money.

02/06/25 Weekly OutlookLast weeks high: $110,718.68
Last weeks low: $103,065.74
Midpoint: $106,892.21
As we approach the middle of the year, Bitcoin is back above $100,000 despite pulling back from a new ATH of $112,000. In the month of MAY BlackRocks ETF had record inflows of over $6B propelling prices 11% higher.
Last week we saw as the month closed and with that it's natural to have a window dressing period that usually leads to de-risking slightly. BTC stayed within the previous weeks range and maintains the pattern of:
Chop/consolidation --> expansion to the upside --> chop/consolidation...
However in this case the consolidation week had a much larger range than in the past which is a sign to me that the rally is exhausted for now. It's because of this I feel we may see a weekly low break for the first time in a month and get a more meaningful pullback than we've seen since early April. My target would be around the $97,000 area.
The case for the bulls is still a convincing one despite some red flags. Record ETF inflows continue to pour, M2 money supply continues to grow and a general shift to risk-on assets is clear. However these are longer term factors and just for this weeks outlook the momentum is with the bears briefly.

Bitcoin - Will Bitcoin reach $120,000?!Bitcoin is in its short-term descending channel on the four-hour timeframe, between the EMA50 and EMA200. Personally, I would look to sell Bitcoin at a target of $100,000. Either from the channel ceiling or after an invalid breakout of the specified channel. If this corrective move occurs, Bitcoin buying opportunities can be sought within the demand zone.
It should be noted that there is a possibility of heavy fluctuations and shadows due to the movement of whales in the market, and capital management in the cryptocurrency market will be more important. If the downward trend continues, we can buy within the demand range.
The Bitcoin 2025 Conference, widely regarded as the largest global event dedicated to Bitcoin and blockchain technology, took place from May 27 to 29 at the Venetian Convention Center in Las Vegas, Nevada. First launched in 2019 and held annually since, the conference has become the central meeting point for Bitcoin enthusiasts and professionals, offering a platform for knowledge exchange, ideation, and innovation within the Bitcoin ecosystem. With over 30,000 attendees, 400 speakers, and participation from around 5,000 companies, this year’s event played a significant role in advancing the global adoption of Bitcoin—often referred to as “hyperbitcoinization.”
The 2025 edition covered not only technical subjects such as Layer 2 scaling solutions and privacy enhancements, but also broader themes like institutional adoption, strategic Bitcoin reserves, and its implications for financial freedom on a global scale.From an economic perspective, there was a strong emphasis on Bitcoin’s role as a store of value amid inflationary pressures and unstable monetary policies. Forecasts presented by key figures such as Michael Saylor and Paolo Ardoino pointed to Bitcoin’s potential to emerge as a foundational asset within global financial systems. These projections were further supported by the expansion of the M2 money supply in 2024 and expectations for continued growth into 2025.
In addition to highlighting opportunities, the event also addressed the challenges facing Bitcoin. One major concern was the lack of clear legal and regulatory frameworks in certain countries—a topic addressed by Caitlin Long and other speakers. Such regulatory uncertainty could hinder broader Bitcoin adoption. Moreover, Bitcoin’s price volatility—highlighted by a 3.4% decline in the weeks leading up to the conference—raised questions about the market’s long-term stability.
Meanwhile, Coinbase reported that the repayment of debts related to the bankrupt FTX exchange could act as a $5 billion liquidity injection into the crypto market. This development is expected to boost capital inflows and potentially draw major institutional players back into the space.
According to Coinbase, as of May 30, the “FTX Recovery Trust” has begun its second phase of repayments, distributing over $5 billion in stablecoins to creditors. These payouts are being processed over three days via the BitGo and Kraken platforms. Unlike the first round in February, this phase involves only stablecoin disbursements rather than a mix of crypto and cash—enabling recipients to reinvest their funds more quickly and efficiently.
Additionally, U.S.-based companies currently hold 94.8% of all Bitcoin owned by publicly traded firms. The U.S. also commands 36% of the global Bitcoin hash rate, underscoring its dominance in mining activities. So far, 36 U.S. states have enacted pro-Bitcoin legislation, signaling a growing legal endorsement of the cryptocurrency across the country. This level of concentration—in ownership, regulatory leadership, and mining capacity—could position the U.S. to play a more decisive role in shaping future global Bitcoin regulations.

Bitcoin on JUNE's Pivot, $103kI believe $103,300 ( June's Pivot ) will hold bitcoin, and in few days we see a rally to the upside, and by the end of June, Bitcoin will reach to $121,700 which is the 2nd resistance for the pivot.

BITCOIN Can the 4H MA200 hold and kickstart the next rally? Bitcoin (BTCUSD) almost hit on Saturday its 4H MA200 (orange trend-line), which has been holding since April 16, and immediately rebounded. So far the bullish reaction is moderate as the price action is still being restricted below the 4H MA50 (blue trend-line), which is now acting as the short-term Resistance.
The blue Arc pattern that BTC has formed in the past 3 weeks, resembles the last two peak formations and pull-backs since the early April bottom. On top of all this, the 4H RSI got oversold (30.00) actually for the first time since the April 07 bottom.
With the weakest rally of this long-term Bullish Leg being +16.06%, if the 4H MA200 holds and a 4H MA50 break-out confirms it, we can expect a minimum short-term rise of almost $120k (+16.06%).
Do you think that's what's coming next? Feel free to let us know in the comments section below!
-------------------------------------------------------------------------------
** Please LIKE 👍, FOLLOW ✅, SHARE 🙌 and COMMENT ✍ if you enjoy this idea! Also share your ideas and charts in the comments section below! This is best way to keep it relevant, support us, keep the content here free and allow the idea to reach as many people as possible. **
-------------------------------------------------------------------------------
💸💸💸💸💸💸
👇 👇 👇 👇 👇 👇

btc $121kbitcoin has completed three weekly and monthly closes above the current demand zone. pullbacks are treated as a healthy retest but will serve as fuel for another bullish wave

Bitcoin Weekly Outlook – June 2, 2025
Bitcoin ( BINANCE:BTCUSDT ) is holding strong above the psychological $100K mark, maintaining its bullish market structure on the weekly timeframe. However, technical indicators are flashing early signs of a possible short-term correction before another leg up.
🔍 Technical Analysis:
Current price: $105.1K
Key support zone: $89K (strong demand area + weekly structure retest)
Resistance to watch: $120K (major weekly supply zone + psychological level)
Stochastic RSI is currently overbought at 94+, which historically tends to trigger a healthy retracement before further upside continuation.
📊 Market Structure:
BTC remains well above the 200-week EMA, keeping bullish momentum intact
Higher Highs and Higher Lows are still in play
Volume is steady, showing no major distribution at the moment
📈 Sentiment Check:
Fear & Greed Index: 64 (Greed)
→ Suggests bullish sentiment is high
→ Greed often precedes short-term pullbacks or consolidation
🧭 Outlook:
A short-term correction toward the $89K–$92K zone is likely, as part of a healthy market cycle.
If support holds, BTC could rally back up with a mid-term target around $120K.
✅ Summary:
🔵 Bullish structure still intact
⚠️ Overbought signal = possible retracement
🎯 Mid-term target: $120K
🧘♂️ Don’t chase — wait for price to breathe, not break
Let the market come to you. Trade smart, not just hopeful.

BTC Faces Critical Resistance—Breakout or Further Decline?FenzoFx—Bitcoin continues its bearish trend after hitting its 2025 all-time high at 113,165. BTC/USD is currently trading near $105,400, a high-volume area where price could either bounce or break lower.
The key resistance level rests at $103,170, supported by a bullish Fair Value Gap. If price holds above this zone, Bitcoin could rise toward $107,090.
However, a close below $103,170 would invalidate the bullish outlook, with the next bearish target at $99,435.

Bitcoin Daily Technical Overview (BTC/USD)Currently, Bitcoin (BTC/USD) is trading around $104,800. Up slightly but still digesting a sharp reversal that rattled short-term bulls.
Recent Price Action: Rejection From $112K
Back on 22nd May, Bitcoin surged to a new high near $112,000, fueled by bullish momentum, institutional flows, and strong on-chain accumulation. However, that breakout was swiftly rejected, and BTC fell as low as $103,400.
This kind of "bull trap" reversal highlights a few key dynamics:
1) Overextended sentiment: The rally above $110K was not supported by volume or follow-through, suggesting exhaustion.
2) Profit-taking by large holders or institutions likely triggered a cascade of stop-losses, accelerating the decline.
3) Liquidation clusters in leveraged long positions likely exacerbated the drop.
Bitcoin is now attempting to reclaim stability around the $104K–$105K range.
🔍 Technical Snapshot
- Support Zones at $103,000 and $93,200
- Resistance Levels at $112,000 (ATH)
Price is still above the 50 & 200-day SMAs, which could be a bullish longer-term signal.
In addition, the price remains above the upper band of the cloud, but momentum is stalling. A decisive bounce off the cloud could reignite bullish sentiment. Or falling into the cloud could trigger more uncertainty and downside.
Macro tailwinds: Concerns over U.S. fiscal stability and potential Fed rate cuts could keep Bitcoin attractive as a non-sovereign asset.
📈 Projection Scenarios
Bullish Case:
If BTC consolidates above $107K, we could see another attempt and retest of $112K.
Bearish Case:
Failure to hold above $103K could see Bitcoin revisit $100K, and if that breaks, downside opens toward the $93K level.
🧭 Insight & Takeaway
The current reversal serves as a healthy reminder that no trend goes up in a straight line. Especially not in crypto.
It likely shook out overleveraged longs, reset sentiment, and may give the market room to breathe before the next leg up.
The long-term trend remains intact, but expect more volatility before any clean break to new highs.
Always DYOR and DYODD and manage your risk.

TECHNICAL ANALYSIS – KASPA/USDT (Daily Chart) + TRADE PLANTECHNICAL ANALYSIS – KASPA/USDT (Daily Chart)
Chart Pattern & Price Action:
Descending Channel (Falling Wedge): KASPA has been trading within a falling wedge pattern, typically a bullish reversal setup.
Breakout Zone Approaching: Price is currently testing the upper resistance of the wedge (~$0.086–$0.088). A breakout from this level may indicate trend reversal.
Key Resistance Zone:
$0.105 – $0.127: Significant supply area (marked in red). Previously rejected, it is the next target if price breaks out upward.
Support Zone:
$0.073 – $0.082: Demand zone. Coincides with the Bollinger Band lower range and historical support.
Indicators Overview:
Bollinger Bands:
Price is trading at or near the middle band, showing a neutral-to-slightly bearish bias.
A breakout above the upper band (~$0.0895) could trigger bullish momentum.
MACD (VMC Cipher_B_Divergences):
Strong bearish momentum continues, but we can observe potential bullish divergence forming.
Green dot signal at the bottom may indicate a possible local bottom.
RSI (Relative Strength Index):
Currently at 37.06, near oversold territory.
Could signal a bounce if RSI climbs above 40 and confirms strength.
Money Flow Index (Art’ Money Flow):
MFI is deep in negative; however, these levels often precede trend reversals.
Watch for a crossover into positive territory as confirmation.
Stochastic RSI:
Bullish crossover around 14.53 / 15.67 in the oversold zone.
Early sign of potential short-term bounce.
TRADING PLAN
Entry Points:
Zone Type Price Range Reason
Buy Spot 1 Conservative $0.073 – $0.082 Strong historical support & bottom of wedge
Buy Spot 2 Aggressive ~$0.086 – $0.089 Breakout of descending wedge
Buy Spot 3 Momentum Break above $0.105 Bullish confirmation + breakout of major resistance
Take Profit Zones:
TP Level Price Notes
TP1 $0.105 First resistance / psychological level
TP2 $0.127 Strong resistance – expect rejection here
TP3 $0.15–0.16 Major extension target if strong momentum
Stop-Loss Strategy:
Strategy Type Placement
Conservative Below $0.073
Aggressive Below $0.080
Risk Management:
Use position sizing relative to account size (e.g., 1–3% risk per trade).
Adjust stop-loss dynamically if entering at breakout.
Combine with on-chain metrics or volume spikes for higher conviction.
SCENARIOS:
🔼 Bullish Scenario (Blue Up Arrow):
Breakout above wedge → retest → rally toward $0.105+
Break $0.105 confirms macro uptrend continuation
🔽 Bearish Scenario (Blue Down Arrow):
Rejection at wedge top → breakdown of $0.082 → revisit $0.073 support
Below $0.073 would invalidate short-term bullish structure

98-101KMorning folks,
Last time BTC was not able to provide the direction as it was standing in triangle and we prepared "neutral" update, waiting for triangle breakout.
Now we see that this has happened to the downside and market just stands slightly above XOP target. So we consider 98-101K area as the nearest target.
Second, once (and if) this action will be over - take look at H&S, and it could trigger stronger downside retracement. This it turn might be quite welcome for weekly reverse H&S pattern .
That's being said, the first step that we're watching - is down to the potential neckline around 98-101K. Then we decided for to do next.

Correlation between USDT.D and BTC.D
Hello, traders.
If you "Follow", you can always get new information quickly.
Have a nice day today.
-------------------------------------
(USDT.D 1M chart)
If USDT dominance is maintained below 4.97 or continues to decline, the coin market is likely to be on the rise.
The maximum decline is expected to be around 2.84-3.42.
-
(BTC.D 1M chart)
However, in order for the altcoin bull market to begin, BTC dominance is expected to fall below 55.01 and remain there or show a downward trend.
Therefore, we need to see if it falls below the 55.01-62.47 range.
The maximum rise range is expected to be around 73.63-77.07.
-
In summary of the above, since funds are currently concentrated in BTC, it is likely that BTC will show an upward trend, and altcoins are likely to show a sideways or downward trend as they fail to follow the rise of BTC.
The major bear market in the coin market is expected to begin in 2026.
For the basis, please refer to the explanation of the big picture below.
-
Thank you for reading to the end.
I hope you have a successful transaction.
--------------------------------------------------
- This is an explanation of the big picture.
(3-year bull market, 1-year bear market pattern)
I will explain more details when the bear market starts.
------------------------------------------------------

$BTC 12-Week Lead Correlation w/ Global Liquidity, M2, GOLD, DXYHere’s a look at Bitcoin's price action against Global Liquidity, Global M2, GOLD and DXY - all with a 12-Week Lead.
Notice GOLD has a bit more of a deviation from the BTC price than the others.
This is because GOLD is used as a store of value asset, whereas the others are predicated on Central Banks expanding and contracting their money supply and balance sheets.
The key here is to smooth out the signal and ignore the noise.
Notice the convergence between these metrics the past couple months.

Bitcoin: Bear Flag Formation Implies Weakness.Bitcoin has retraced as anticipated in my previous article (see Wave 5). So much for all the nonsense hype at the Bitcoin conference. Bitcoin has tested the 103K area and found some support but is developing a mini bear flag (see arrow). IF the 103,500K level is broken, that confirms the corrective structure is still in play and a test of 102 to 100K can still be the dominant scenario for the coming week (NFP this week). This means for swing traders on this time frame, it is likely too early for longs.
The 102 to 100K area is still the major support that I anticipate. A long signal here can look like a pin bar on this time frame, or a double bottom formation on a 4h or 1h chart. It often pays to wait for these scenarios but there is always a risk of missing the move if price confirms a reversal pattern sooner.
IF the current candle closes much higher (above 106K) then it will invalidate the bear flag. This means the bullish continuation would be in play. In my opinion this is a lower probability, but you have to be open to it. In the bullish scenario a test of 110 to 112 servers as a profit objective. While a breakout beyond 112 can happen, the more you expect, the more RISK you must be exposed to. A test of high is more probable than a new high. Along with that, I suspect current price action is more likely to consolidate rather than continue high over the short term because 5 waves are clearly in place. That usually means a corrective structure is likely to follow, and that is what we are currently in.
The bullish candles are too early to buy into. If the bear flag plays out, there will be more attractive prices to wait for reversal formations. Otherwise, work smaller time frames, look for small bites going either way and keep the size small. This is not an easy environment.

Case for Monero ContinuesTL;DR:
Monero is used as a currency giving it a relatively stable value during all seasons
There has been and will continue to be large transfers of Bitcoin to Monero creating supply shocks and XMRUSD RIPs
I have been heavily focused on sharing my bull case for Monero for over two years now. That made for a very disturbing morning on February 4th, 2024 when I woke up to see KRAKEN:XMRUSD down more than -30%. My first thought was, "oh no... someone cracked its privacy!" Then I read the details; it had been delisted from Binance for "being impossible for government to track and therefor banned in many countries." So... Monero was actually "working as intended." Buy!
There are only 3-4 cryptocurrencies that matters to me: Bitcoin, Monero, and which wins between Ethereum/Solana. These cryptocurrencies represent the established use cases thus far respectively in Store of Value, Currency, and Smart Contracts. I have been writing about Monero for several years now relating my observations about its uses, price performance, and future predictions. Recent events have proven my thesis to be accurate and I am confident will continue to be.
Performance versus Bitcoin:
One criticism of observing recent or past outperformance of BITFINEX:XMRBTC is "zoom out bro" where the full decade plus price trend it noted. This is undeniable. However, one should remember the investing adage: "past performance is not indicative of future results." One should also not be ignorant of the facts leading to extended periods of outperformance and what they mean for future market conditions.
During the crypto winter of 2022 Monero outperformed Bitcoin as a product of Monero holding its value, presumably because of its continued use as a medium of exchange (currency), while Bitcoin fell precipitously.
The same outperformance happened again when Bitcoin had a less dramatic decline in value during 2024. Again, Monero maintained a relatively stable valuation.
Year to Date as a product of Monero's prior stability and the catalyst event (I will talk about later) have driven a period of outperformance yet again.
Store of Value
Bitcoin's use case as a Store of Value is well established. Prior to the last Halvening event Bitcoin was actually MORE inflationary than Monero. Now the inflation rate for Bitcoin and Monero is 0.83% and 1.7% respectively. Monero has an inflation rate known as a "tail emission." The inflation rate actually declines over time as the amount of new Monero being added (432,000 annually) is fixed. There will actually be a point where they are close again around late 2027 when the rates will be 0.83% and 0.82% respectively. As Bitcoin rewards continue to decrease there will never be a point where Monero's inflation is less than Bitcoin's.
However, being inflationary or deflationary alone does not grant or guarantee value. Bitcoin will always hold the title of "most deflationary" between the two. Having limited supply and being scarce is not enough to give something value. Intrinsic value is derived from many potential factors and one that is common between both of them is: use as a medium of exchange. Monero is actually proving to be more used as a medium of exchange.
"Monero is what people think Bitcoin is."
I have been observing over the last two years a shift on the Darknet markets that there are two primary currencies: Bitcoin and Monero. What is interesting is that some Darknet markets have ceased transacting in Bitcoin entirely and rely exclusively on Monero. This is one of the reasons that Monero has maintained its value over this time. The reason is Monero's primary use case: private money. Monero is built upon privacy by default. This is originally what Bitcoin was perceived to be. Now, the public nature of Bitcoin is seen as a value proposition for state and corporate adoption to the benefit of NGU (Number Go Up) but it provides no security for those that value privacy.
"What about Zcash?"
There are other privacy coins, sure. Often times when I talk about Monero these competing coins are brought up in the context of "interesting technology." Tech matters less to use. You can have amazing tech that is worthless if no one uses it. This is analogous to the platform war between Betamax and VHS. Betamax arguably had better technology but the consumer market chose VHS and that became the standard.
As long as Monero "has privacy" then any other cryptocurrency that "has privacy" has only equal use case. What matters then is the market; the consumer. And the market and consumers have already decided to use Monero. The network effect has already taken over. It will be incredibly unlikely that any other privacy coin can reach the same network effect and supplant Monero.
Bitcoin is worthless without state approval
In 2023 and 2024 hackers that had somehow broken into the Darknet market of Silk Road and the Cryptocurrency exchange Bitfinex were captured, prosecuted, deprived of freedom, and forced to surrender their Bitcoin many years after their crimes were committed. We are talking billions of USD worth of Bitcoin that were rendered worthless to their ill gotten owners. What should have been realized then was that all Bitcoin, despite being permissionless, is worthless to its owner without full state approval. You can hold it, send it, and trade it but if government does not approve it will find you and take your freedom. That is, of course, unless you hand it over to them and they might give you some of that freedom back.
So it became rather obvious that should a hacker acquire copious amounts of Bitcoin they would invariable seek to privatize these gains. Just such an event happened in April. Allegedly, a hacker gained access to a very old Bitcoin private key containing nearly $330 million worth of Bitcoin and then proceeded to convert it to Monero irrespective of transaction costs and liquidity. This created an acute supply shock leading to a huge RIP. Many smaller exchanges "ran out" of Monero exacerbating the supply shock and leading to further appreciation.
This is a catalyst that is founded upon rational actions albeit not ethical. We can presume that such catalysts will continue to happen into the future.
Technical Analysis
Monero has been very hard to trade using my standard methods. Because of its normal stability of value it lacks clear and robust trends to play pullbacks. However, there is a definite recent trend to look at now. I am very interested to see where and if Monero establishes a new trading range because then I can look at the lows of this range to accumulate more. The potential 50% Retracement level of the present price action is 292.
Conclusion
During all seasons both bullish and bearish Monero will continue to be used as a medium of exchange and maintain its Store of Value. Monero has already reached adoption level in the use case of privacy which establishes a moat of competitive advantage versus any other privacy coins. As long as humans use cryptocurrency they will value the privacy advantage of Monero versus Bitcoin and periodically and unexpectedly convert between the two leading to huge supply and price shocks.

BTC eliot wave prediction
106,600$ → 100,300$ → 116,000$
The third extended wave of Bitcoin has completed, and it is now going through a correction phase.
Wave 4 corrections often retrace to the 0.382 Fibonacci level.
Therefore, a price drop to that level is expected — around $106,600.
This correction is unfolding as a W–X–Y pattern.
In wave W, the internal ABC subwaves completed with wave C reaching 1.618 times the length of wave A.
Currently, Bitcoin is in the rising phase of wave X.
No one knows how high wave X will go,
but what’s important is that after wave X finishes,
one more lower low is expected — again around $106,600.
At that price level, I plan to open a $2 billion long position with 10x leverage.
