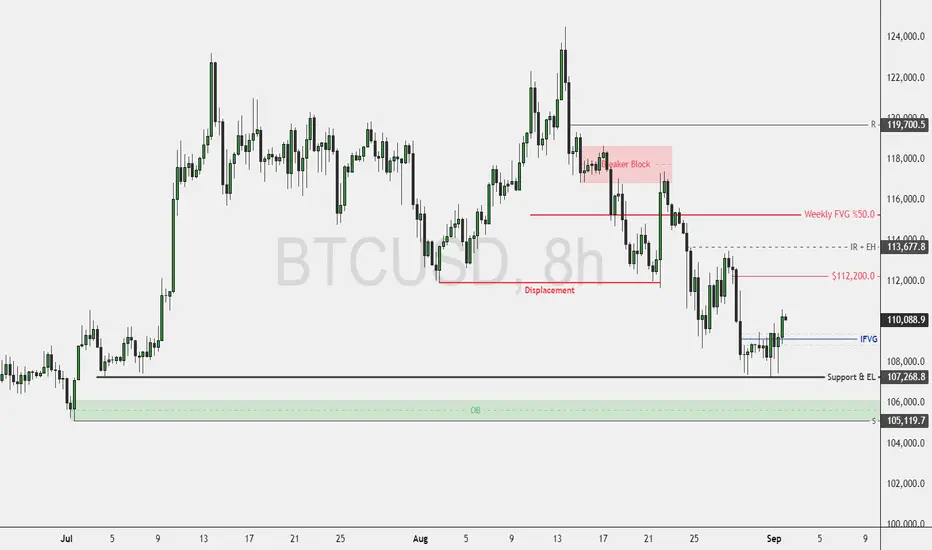
Bitcoin’s Temporary Rebound Targets Key HighsFenzoFx—Bitcoin remains bearish, though the downtrend paused after tapping equal lows at $107,268.0. BTC has since flipped above the recent fair value gap near $110,200.0.
We anticipate the downtrend will resume, targeting the bullish order block at $105,119.0. BTC/USD may rise toward $112,200.0, followed by equal highs at $113,677.0.
Once these levels are swept, the bearish trend is likely to continue. Traders and investors should monitor these key zones for potential bearish setups.
Bitcoinforecast
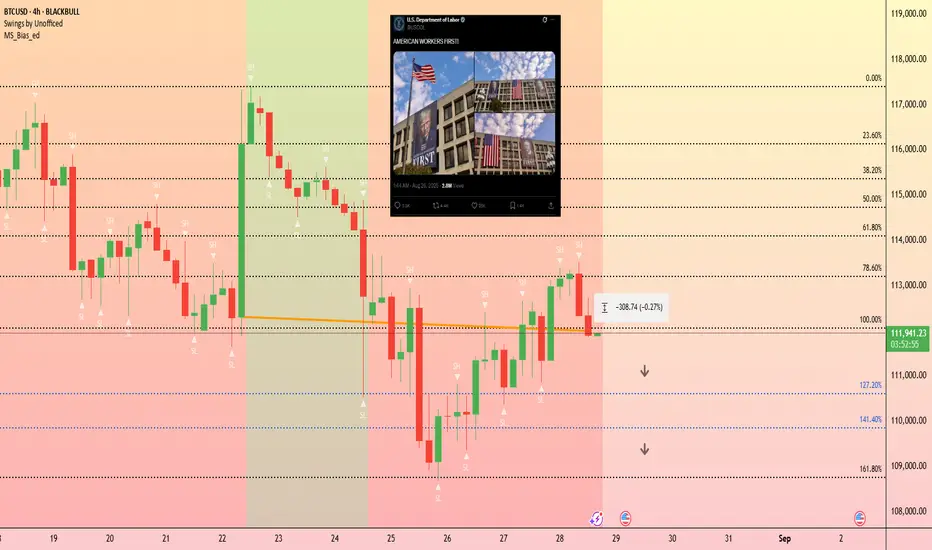
How Potentially Manipulated NFP Data Could Affect BTC's PricBitcoin rallied last Friday after Federal Reserve Chair Jerome Powell's prepped the market for an interest rate cut in September.
However, these gains have faded, with Bitcoin back to where it started last Friday; around $112,000.
The market's focus is now shifting to the upcoming U.S. Non-Farm Payroll (NFP) report, scheduled for release next week, which could greatly influence interest rates expectations.
Strong job data may reduce the likelihood of a September rate cut.
And with an Orwellian portrait of Trump now hanging from the Department of Labor Building, and his administration potentially pressuring the Bureau of Labor Statistics to inflate job numbers, this scenario is becoming a real possibility. If this happens, we could expect price action to test the lower Fibonacci retracement levels, such as the 141.4% at around $109,900 or further at $108,700.

Bitcoin Holds Bullish StructureFenzoFx—Bitcoin formed equal highs after sweeping liquidity above $117,046.00 on Friday. Technically, Bitcoin remains bullish due to Friday’s price displacement.
Immediate resistance lies at $113,677.00. If bulls close and stabilize above this level, the uptrend may resume, targeting the equal highs at $117,046.00. A further rise could fill half of the bearish fair value gap toward $119,700.00.
Currently, no bearish setup is expected unless BTC reaches the premium price zone of $119,700.00 and above.
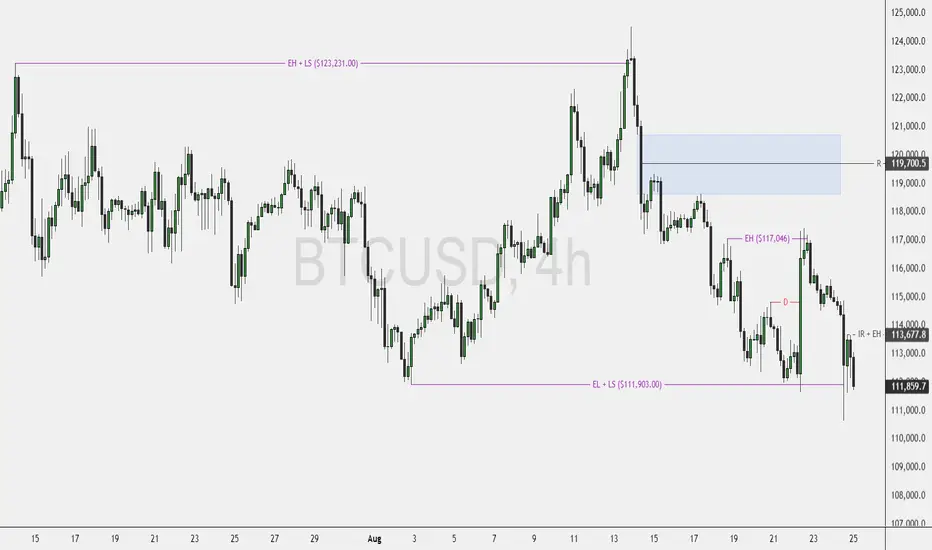
Bitcoin Maintains Bearish MomentumFenzoFx—Bitcoin stayed bearish, trading around $113,500.0 in today’s session. During the Asian hours, it swept liquidity above the previous day’s high and quickly dipped below $114,627.00.
The next buy-side liquidity zone lies at $111,903.00. The bearish outlook remains intact unless this level is swept.

Bitcoin Tests Key Support at $115KFenzoFx—Bitcoin's downtrend extended to $115,000, filling the bullish fair value gap now acting as support. The current price equals 25.0% of the previous bullish leg. If BTC closes and stabilizes below $115,000.0, the downtrend may deepen toward the $112,000.0 support order block.
Conversely, a close above $117,445.0 would invalidate the bearish outlook. This level marks the last bearish candlestick pattern and a break of structure. If confirmed, BTC/USD could recover recent losses, targeting resistance at $119,339.0.

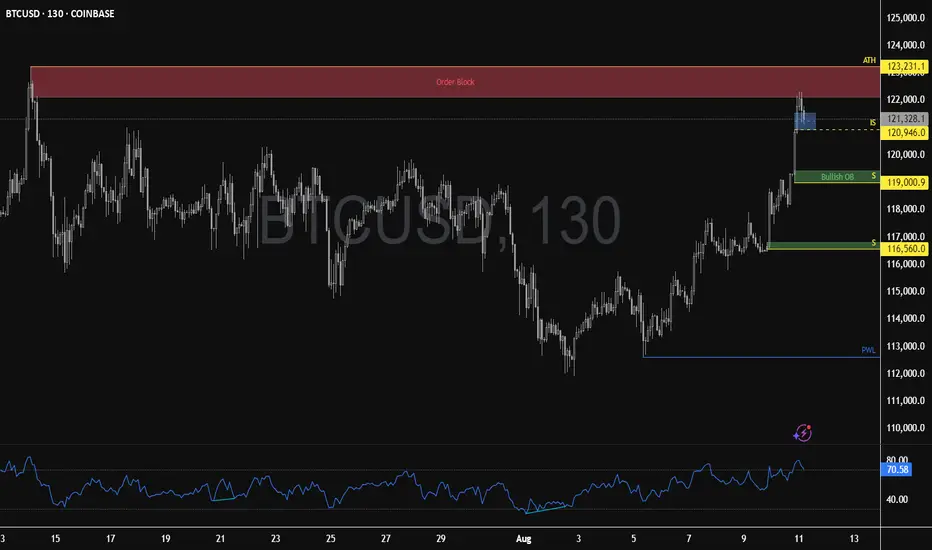
Bitcoin Pulls Back After Testing Bearish BlockFenzoFx—Bitcoin hit the bearish order block and pulled back as expected. RSI 14 dropped below the overbought zone to, signaling increased selling pressure.
Immediate support lies at $120,946. A close below this level could extend the downtrend, targeting the bullish order block at $119,000.00. No bullish setup is expected until price consolidates near discount levels at $119,000.00 and $116,560.00.
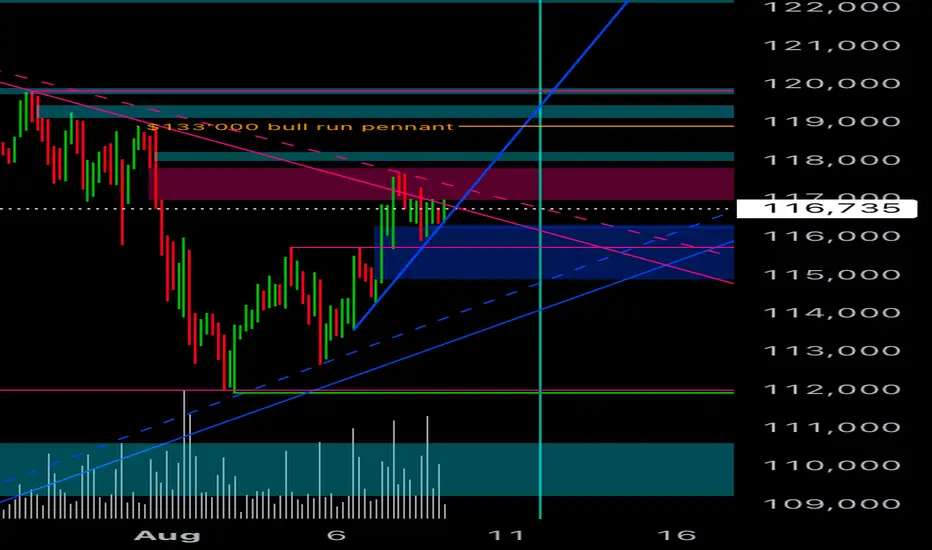
Highway Star$133’000 bull run pennant above $119’000.
Shift above all time accurate trend lines. We are at the beginning of exponential vertical segment. Strong rising front at $115’700.
Bitcoin institutional demand continues to outpace new supply, with 545,579 CRYPTOCAP:BTC purchased year-to-date compared to only 97,082 CRYPTOCAP:BTC in new supply.
The volumes were bought on July 15 and 25 for 116,000 and 115,000 respectively. So I think we are waiting for 119,000 to launch above all time high.
Bitcoin Consolidates Below VWAP Amid Structural UncertaintyFenzoFx—Bitcoin’s downtrend eased near the bullish order block but hasn’t entered the zone. It’s currently consolidating around $114,360.0, below the July 14 VWAP.
No clear break of structure has occurred, making long positions risky. Key support lies at $110,650.0, backed by high volume.
Technically, price is expected to enter this zone. If it does, traders should watch for a break of structure on lower time frames like M15. This setup offers a minimum 1:7 risk-to-reward.
If BTC closes below the main support, bearish momentum may continue toward the next order block at $110,120.0.

It seems like no one likes non-panic morning posts...Futures are like a rented Ferrari, spot is like a purchased Mercedes.
There are hidden reserves under the melting volumes. What do you think about the current denouement?

Bitcoin: The Key Buying Level Near $112K Liquidity ZoneFenzoFx—Bitcoin consolidation extended into the bullish FVG, trading near $115,470.0. The 4-hour chart shows an indecisive candle, while the 200-day MA points upward, signaling bullish control.
The bullish outlook remains intact if price holds above the critical $112,000.0 support. However, current bearish momentum may drag price toward this level, potentially filling nearby FVGs.
Traders should monitor $112,000.0 for bullish setups, including break of structure and long-wick bullish candles.

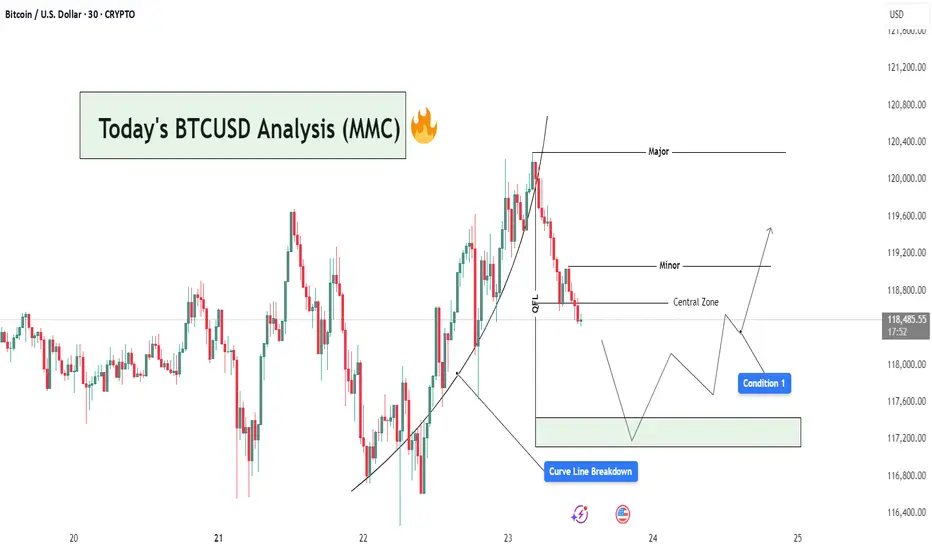
BTCUSD Analysis : Curve Line Breaked and Move Towards Target📊 Market Overview:
BTCUSD has recently completed a strong bullish leg, following a parabolic curve formation that led price into a Major Resistance Zone near the $120,400 level. This rally aligns with MMC principles where price forms momentum-driven structures before reaching high-liquidity zones (often ending in exhaustion).
📍 1. Curve Line Support & Breakdown – A Shift in Sentiment
Your chart shows a clear Curve Line that supported the bullish impulse. Price respected this dynamic support throughout the uptrend until a Curve Line Breakdown occurred—marking the first sign of bullish weakness.
In MMC strategy, this curve structure breakdown is critical:
It tells us the accumulation → expansion → exhaustion cycle is ending.
The market is likely entering retracement or distribution phase.
Price often seeks lower equilibrium, typically around the Central Zone.
🧠 2. QFL Zone (Quick Flip Level) – The Hidden Base
Immediately after the curve broke, price moved toward the QFL level, which represents a demand base from earlier structure. This zone acts as a short-term support and often produces a reactive bounce (but not always a reversal).
Watch closely:
If price respects this zone → temporary relief bounce
If it fails → we’ll likely see full test of Central Zone or lower demand levels
🟩 3. Central Zone – The MMC Decision Area
The Central Zone is a key horizontal level on your chart, defined between ~$117,300 and ~$118,200. This zone is marked based on:
Previous structure
Volume clusters
Demand imbalance
Why is this zone important?
It serves as the balance point between buyers and sellers.
A bullish reaction here could re-initiate a move toward Minor Resistance (~$119,200).
A failure to hold could open the door for deeper retracement toward the green demand box (~$117,200 or below).
🔄 4. Two Primary MMC-Based Conditions to Watch:
✅ Condition 1: Bounce from Central Zone
Price reacts from within the Central Zone
Forms bullish structure (double bottom, bullish engulfing, or reversal wick)
Short-term target becomes Minor Resistance (~$119,200)
If volume increases and price breaks above Minor, continuation toward Major is possible
❌ Condition 2: Breakdown & Bearish Continuation
Price fails to hold within Central Zone
Bearish structure forms (e.g. lower highs, breakdown candles)
Clean move expected toward next liquidity pocket at $117,200–$116,800
This would confirm market shifting into bearish control
📌 5. Minor vs Major Levels – Key Zones
Minor Resistance (~$119,200): Short-term target if bounce occurs
Major Resistance (~$120,400): Liquidity sweep zone, strong supply
Green Demand Box (~$117,200): If Central Zone fails, this becomes next bounce zone
📘 Final Thoughts:
This is a classic MMC setup in real-time:
Curve Formed → Broke
OFL + Central Zone → Now being tested
Next move depends on confirmation from buyers or sellers at Central Zone
Don’t trade emotionally — let price action give you confirmation before taking any positions. Watch the Central Zone behavior closely and manage risk based on scenario outcomes.
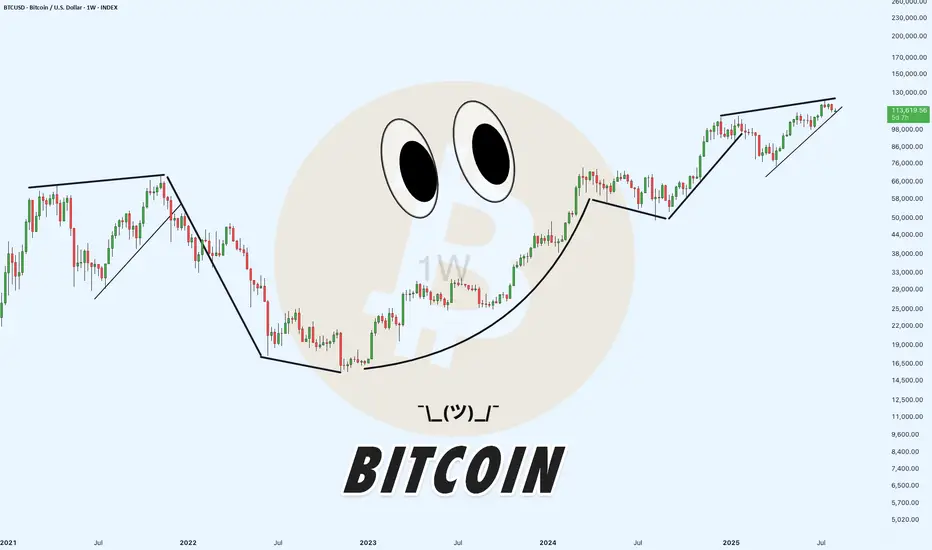
BITCOIN current and past FAIR VALUE GAPS -Watch for the future ?An explanation of what a FAIR VALUE GAP ( FVG) is at the end of this post.
The stand out for me here is simply how almost EVERY Fair Value Gap ( FVG) gets filled in every cycle. There are very few FVG from the 2017 to 2021 ctcle and only one from 2013 to 2017.
The question I now pose to myself is what will happen this time ? Because things are very different.
The potential for a return to the 50K area is Very real should we go back into a BEAR.
But to enter a Bear, we need the corporations to sell up..
Will they ?
We have to wait and see
Fair Value Gap
A fair value gap (FVG) is a price range on a chart where an imbalance exists between buyers and sellers, often resulting from sudden and strong price movements that leave a void where little or no trading took place.
These gaps occur when there is a significant difference between buy and sell orders, indicating an imbalance that can influence market prices.
Traders use FVGs to identify market imbalances and inefficiencies, which can present potential trading opportunities.
Definition: A fair value gap is a price range on a chart where an imbalance exists between buyers and sellers, often resulting from sudden and strong price movements that leave a void where little or no trading took place.
Formation: FVGs occur when buying or selling pressure leads to significant price movements, leaving behind gaps on price charts. These gaps can be identified through technical analysis involving the analysis of candlestick patterns and price chart patterns.
Types: Traders can categorize FVGs into two types: Undervalued FVGs, where prices are lower than fair value, and Overrated FVGs, where prices are higher.
Identification: FVGs are typically identified through a three-candle pattern on a price chart. The first and third candles serve as barriers, while the middle candle is the largest, creating a gap between the wicks of the first and third candles.
Trading Strategy: The fair value gap trading strategy involves identifying price gaps, waiting for the price to return to the gap, and executing trades based on the expectation that the price will resume its original trend. This approach requires a disciplined risk management plan.

TheKing Cycles- Nothing can be perfect in Life or in Trading, but you can always brighten up your day.
- Remember "Cycles are Cycles"
- Everything is in graph
- You can follow bears, predicting 10 years of recession, but we are in a big recession and for a long time already.
- You can fall in the deep and predict the darkness.
- i like to see the sunshine in the morning and i will always radiate warmth.
- Follow Hope, and always believe in your own judgement.
- Be Bold and do the opposite of what commons peoples think.
Happy Tr4Ding !

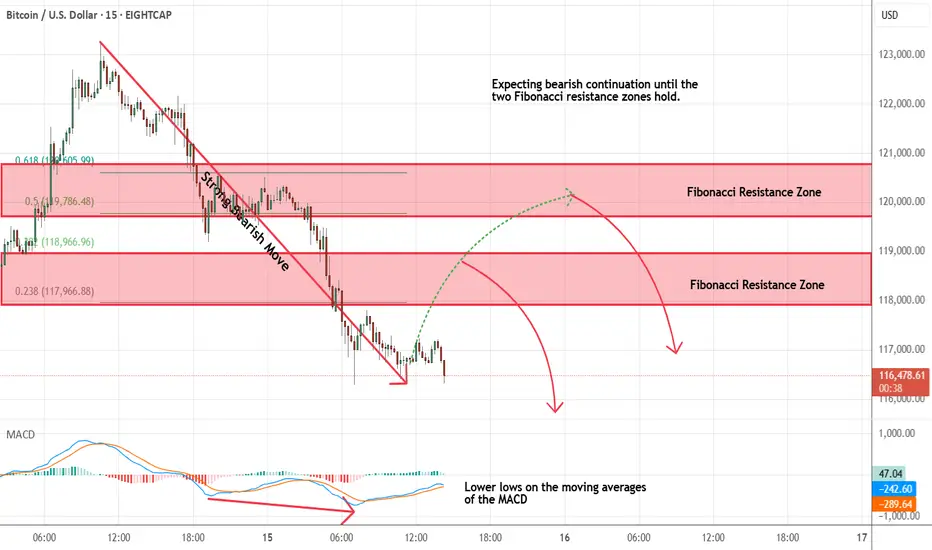
Bitcoin - Looking To Sell Pullbacks In The Short TermM15 - Strong bearish move.
Lower lows on the moving averages of the MACD.
No opposite signs.
Currently it looks like a pullback is happening.
Expecting bearish continuation until the two Fibonacci resistance zones hold.
If you enjoy this idea, don’t forget to LIKE 👍, FOLLOW ✅, SHARE 🙌, and COMMENT ✍! Drop your thoughts and charts below to keep the discussion going. Your support helps keep this content free and reach more people! 🚀
--------------------------------------------------------------------------------------------------------------------
Bitcoin: Support at $112K Holds Key to Bullish ContinuationFenzoFx—Bitcoin is bullish, trading above $112,000.0 after forming a new all-time high at $123,231.0. The current dip may offer a strong reentry if $112,000.0 holds as support, aligning with a bullish fair value gap.
Price remains above the ascending trendline, reinforcing the bullish outlook. If momentum continues and BTC breaks past $123,231.0, the next target could be $130,000.0.
A fall below the trendline would invalidate the bullish setup.

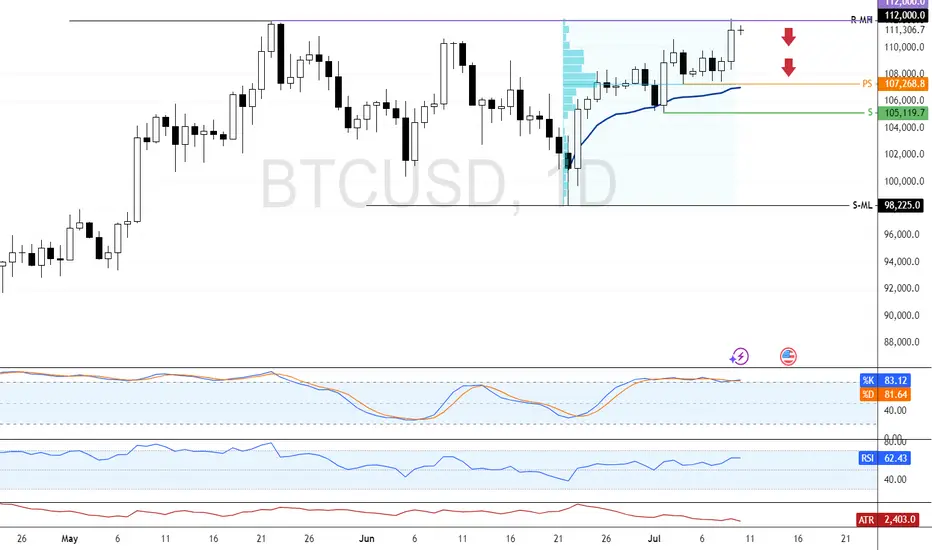
Bitcoin Tests Record High as Momentum FadesBitcoin is bullish, testing the all-time high at $112,000.0. Stochastic shows an overbought reading of 83.0, indicating momentum may stall.
As of now, BTC trades slightly below this level. Since it's the first test of $112,000.0, consolidation could follow. If bulls fail to break higher, price may dip toward $107,268 and $105,119.0 supports.
BTC Eyes $105,119 Support Before Targeting $112,000FenzoFx—Bitcoin is trading just below the previous monthly high at $109,110.0, while the Stochastic remains overbought for the third consecutive day, signaling short-term overheating.
Although the broader trend is bullish, a pullback toward the anchored VWAP at $105,119.0 is expected. This level may offer a low-risk reentry, with a potential move toward the all-time high at $112,000.0.
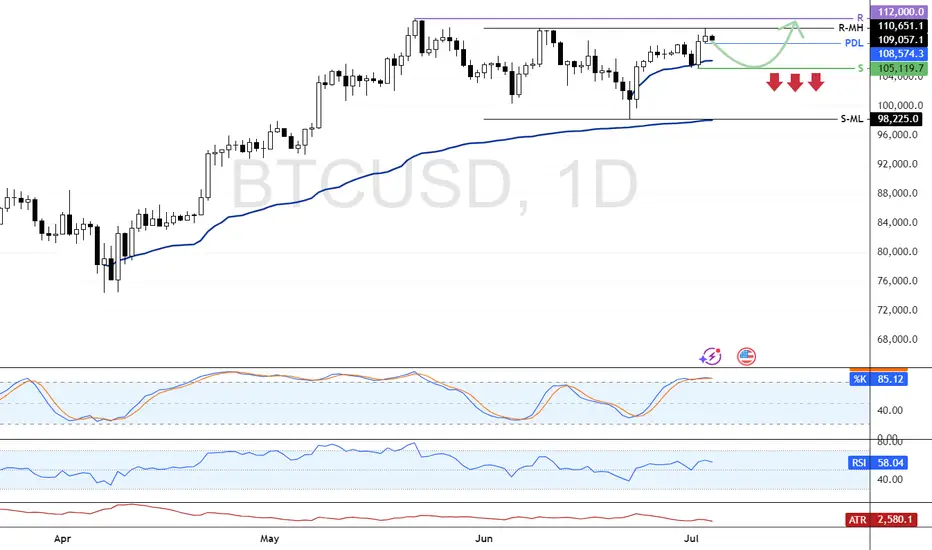
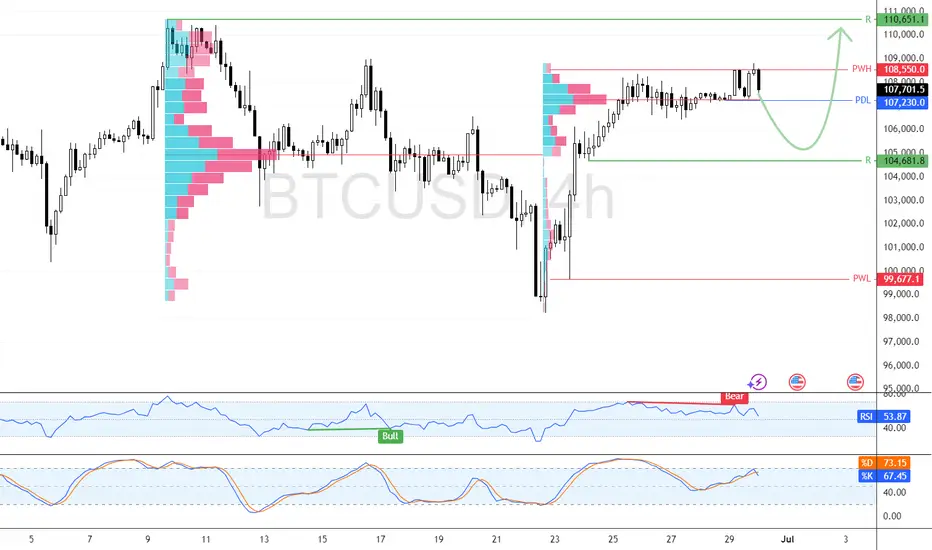
Bitcoin Eyes $110K Target Above Key Support LevelBitcoin trades slightly below last week’s high near $107,660.0, while RSI 14 shows bearish divergence without a clear downward move.
Immediate support is at $107,230.0, and resistance at $108,550.0. If BTC closes above resistance, a rally toward $110,651.0 may follow. The bullish outlook remains valid as long as the price stays above $104,681.0.
Bitcoin Climbs Above $107K with Overbought Signals in PlayBitcoin closed above the 107,792 resistance after breaking the previous day's high. RSI and Stochastic indicators show overbought conditions, signaling short-term overpricing.
BTC may test the $109,000.00 resistance next, followed by a potential pullback toward $104,618.00, offering a favorable entry point for bulls.
Bitcoin - Looking To Buy Pullbacks In The Short TermM15 - Strong bullish move.
No opposite signs.
Currently it looks like a pullback is happening.
Expecting further continuation higher until the two Fibonacci support zones hold.
If you enjoy this idea, don’t forget to LIKE 👍, FOLLOW ✅, SHARE 🙌, and COMMENT ✍! Drop your thoughts and charts below to keep the discussion going. Your support helps keep this content free and reach more people! 🚀
--------------------------------------------------------------------------------------------------------------------

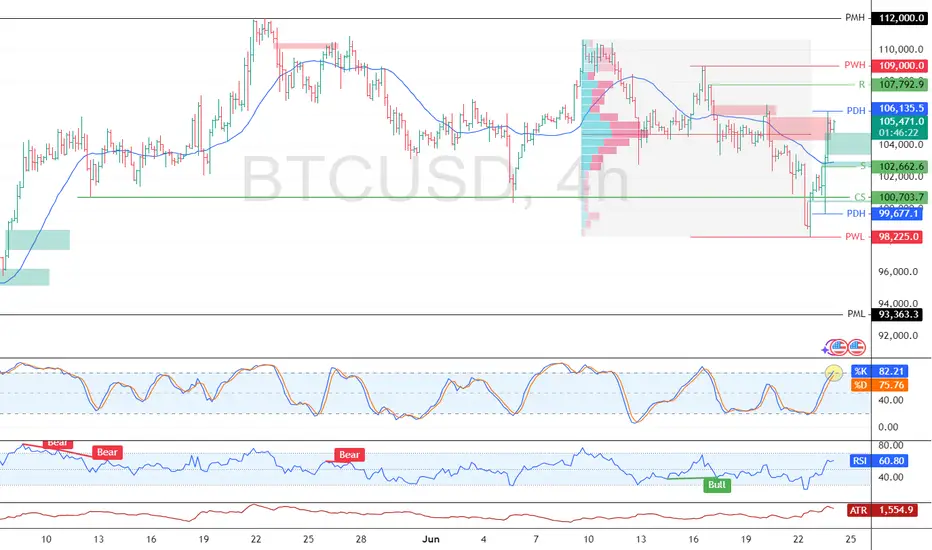
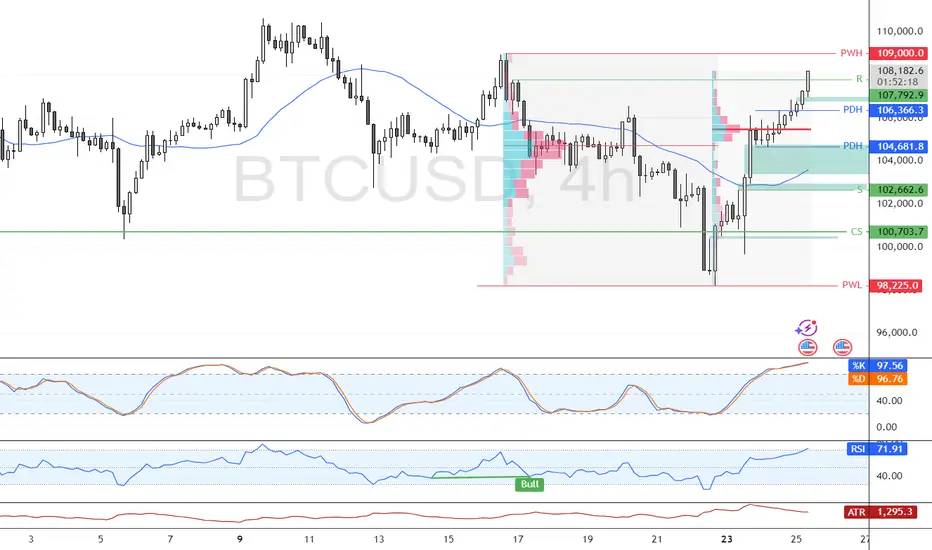
Bitcoin Rebounds Above $105K After Liquidity SweepFenzoFx—Bitcoin swept liquidity below $100,703.0 and rebounded to around $105,400.0, just above the volume profile point of interest.
Immediate resistance lies at $106,135.0. A break above this level could lead to a retest of $107,702.0. However, if resistance holds, BTC may consolidate toward $102,662.0, supported by Stochastic overbought signals.