BTCUSD Bitcoin 15Min-TIMEFRAME ANALYSIS💥BTCUSD 15Min-TIMEFRAME ANALYSIS
💗Hello ladies and gentlemen
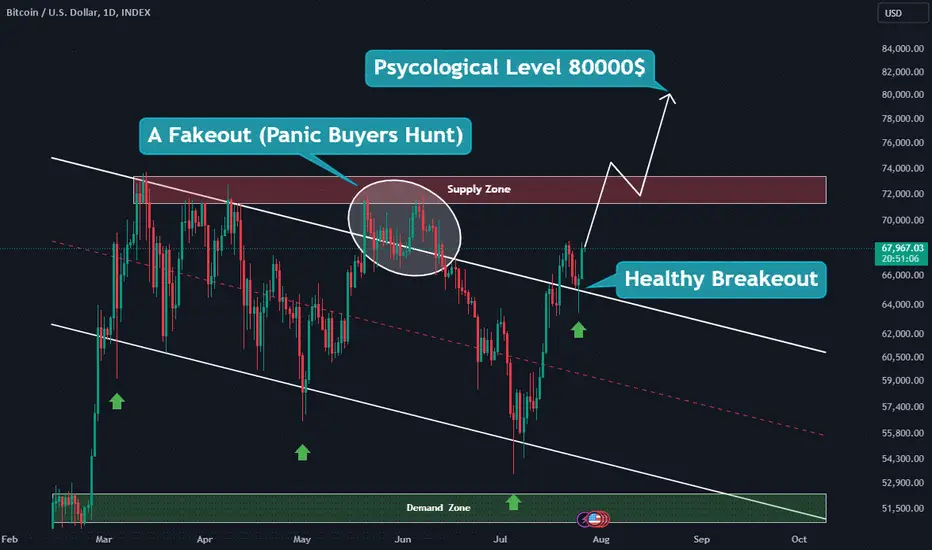
This is my new idea for 💥BTC Bitcoin
I hope my idea is clear
Support me by like and share thank you
Stay Safe💯💲💲💲
Good luck💰😍
Bitcoinlong

Bitcoin All Time High NOT PRICED IN YETFor weeks now, I've been talking about why the all time high for Bitcoin is NOT YET in. (Proof here)
Here are the main reasons why.
👉 Elliot Wave Theory
I've been discussing EWT for many weeks alongside with the bearish M-Pattern that marked the beginning of the corrective wave (3-4). Once the corrective wave finishes, which I expected to be a multi-month playout, the final impulse wave up awaits us (4-5).
👉 Bitcoin-Dominance Increasing & ALTS Bottom
Considering MANY alts have seen bottom patterns after corrections (as discussed in the video), its safe to say the dump is over. But BTC.D is still increasing... If you want to further understand WHY this is a good sign, see HERE:
_____________________________
KUCOIN:BTCUSDT CRYPTOCAP:TOTAL3

BITCOIN CYCLE TOP $118K - $125KBased on trend continuation that began in 2017, we can expect a Bitcoin top between $118,000 - $125,000. Based on previous halvings and ATH cycle tops, Bitcoin typically reaches its highest price 12 - 18 months after the halving. That would put this cycle ATH date between April 2025 and October 2025.
Feedback appreciated!
If you have a different price target, please share in the comments!

$700 on a Saturday Morning (BTC)Probability is the name of the game with any trading setup.
Let me ask you this, If I made you a bet in which you think the probability that you'd win that bet is lower than your chances of winning, would you take that bet?
If you answer yes, you are a gambler because that is exactly what gambling is. If you go to the casinos, you hear it all the time - your chances (probability) of winning are very low as they are skewed in favor of the casino. Lets be real, a casino is a business and the business's goal is to make money. It is just sad that most gamblers aren't smart enough to realize that the money is mostly being made off of their backs.
Conversely what about if you realized the probability is skew more in your favor, would you take the bet? You'd be foolish not to as it is more likely to be easy money for you right?
That is the theory I have applied here. Simple in and out.
That's it, no special strategy, special terminologies, weird candlesticks patterns and all that B.S.
K.I.S.S - Keep it stupid simple
Have a good day guys!

$CFX loadingAn inverse head and shoulders is a chart pattern used in technical analysis to identify potential bullish reversals in a downtrend. It consists of three parts: two shoulders and a head in between them. Here’s how you can trade the inverse head and shoulders pattern:
### Identification
1. **Left Shoulder**: The price declines to a new low, then rises.
2. **Head**: The price declines again, forming a lower low than the left shoulder, then rises.
3. **Right Shoulder**: The price declines once more, but not as low as the head, then rises.
4. **Neckline**: Draw a line connecting the peaks between the left shoulder, head, and right shoulder. This line is called the neckline.
### Trading Steps
1. **Confirmation**:
- The pattern is confirmed when the price breaks above the neckline. Wait for a close above the neckline to confirm the breakout.
2. **Entry**:
- Enter a long position (buy) once the price closes above the neckline. Conservative traders might wait for a retest of the neckline as support.
3. **Stop Loss**:
- Place a stop loss below the lowest point of the right shoulder to minimize risk.
4. **Target Price**:
- Measure the distance from the head to the neckline. Add this distance to the breakout point to set your target price.
### Example
1. **Identification**: Suppose the price forms the left shoulder at $40, drops to $30 to form the head, rises back to $35, then drops to $32 to form the right shoulder, and the peaks between these are at $35 and $34.
2. **Neckline**: Draw a line connecting $35 and $34. This is your neckline.
3. **Confirmation**: Wait for the price to break above the neckline (say at $34.50).
4. **Entry**: Enter a long position at $34.50.
5. **Stop Loss**: Place a stop loss slightly below $32 (the right shoulder low), e.g., at $31.50.
6. **Target Price**: The distance from the head ($30) to the neckline ($34) is $4. Add this to the breakout point ($34.50) to get a target price of $38.50.
### Tips
- **Volume**: Look for increasing volume on the breakout above the neckline. This adds confirmation to the pattern.
- **Risk Management**: Always use stop losses and consider your risk-reward ratio before entering a trade.
- **Retests**: Sometimes, the price might retest the neckline after breaking out. This can be an additional entry point.
### Conclusion
Trading the inverse head and shoulders pattern involves identifying the pattern, waiting for confirmation, entering at the right point, and managing risk with stop losses and profit targets. Always practice with paper trading or a demo account before using real money.

IS Bitcoin Going To ATH? Or Even More?As The Daily TF I Can See Potential Strong Upside Movement. There Is A Daily Parallel Channel Breakout. So I'm Suggesting To Go Long On Pullbacks. Don't Trust Technical indicators this Time. All The Indicators Will Show You To Short.
Just Be Updated With Daily TF Please Wait For 1H Update.
Bitcoin Nears Crucial Test as Hashrate StrengthensBitcoin (BTC) is on the cusp of a critical test as it approaches a trendline resistance that proved formidable in May. Concurrently, a surge in Bitcoin mining hashrate, a bullish indicator, is adding fuel to the rally.
The benchmark cryptocurrency has been on a consistent upward trajectory, fueled by a combination of factors including increased institutional interest, macroeconomic concerns, and the halving event. As BTC closes in on the May trendline, traders and analysts are closely watching for how the market will react. A decisive breakout could ignite a new leg up in the price, while a rejection could lead to a period of consolidation or even a temporary pullback.
The recent strengthening of the Bitcoin mining hashrate is a positive development that underpins the bullish outlook. The hashrate, which measures the computational power dedicated to mining new Bitcoin blocks, is often seen as a leading indicator of price trends. A higher hashrate implies increased miner confidence in the future price of Bitcoin, as miners are willing to invest more resources into the network. This surge in hashrate can also be attributed to the ongoing Bitcoin halving cycle, which reduces the block reward and incentivizes miners to optimize their operations.
While the technical and fundamental backdrop for Bitcoin appears constructive, it's essential to approach the market with caution. Cryptocurrencies remain highly volatile assets, and price movements can be influenced by a variety of factors, including regulatory developments, macroeconomic conditions, and investor sentiment.
Moreover, the Bitcoin market has a history of false breakouts, where prices briefly pierce resistance levels before retracing. Therefore, traders must employ risk management strategies and avoid overexposure.
The potential breakout from the May trendline will be a key event to watch. If Bitcoin successfully overcomes this hurdle, it could open the door for a more substantial rally towards higher price targets. However, a rejection at this level could lead to a period of consolidation or even a temporary pullback.
Ultimately, the cryptocurrency market remains highly dynamic, and investors should conduct their own research and due diligence before making investment decisions.
Disclaimer: This article is for informational purposes only and does not constitute financial advice. Cryptocurrency investments involve significant risks, and investors should be prepared for the possibility of losses.

XRP: Outperforming Bitcoin and EthereumThe cryptocurrency market is a volatile landscape, marked by sudden shifts in investor sentiment and regulatory uncertainty. Amidst this turbulence, XRP has emerged as a standout performer, outpacing both Bitcoin and Ethereum. This exceptional performance can be attributed to several key factors, including its unique value proposition, technological advancements, and the evolving regulatory landscape.
Unlike Bitcoin, which primarily functions as a digital store of value, XRP is designed to facilitate fast, low-cost, and global payments. This focus on utility has made it particularly attractive to financial institutions and remittance services seeking to streamline cross-border transactions. Additionally, XRP's consensus mechanism, which is significantly faster and more energy-efficient than Bitcoin's proof-of-work, provides a compelling advantage.
While offering smart contract functionality, Ethereum has faced scalability challenges that have impacted transaction speeds and costs. XRP, on the other hand, has been engineered to handle high transaction volumes efficiently. This superior scalability makes it a more viable option for real-world applications, such as payments and remittances.
A crucial factor driving XRP's recent outperformance is the improving fundamental backdrop. The long-standing legal battle between Ripple and the SEC has cast a shadow over the cryptocurrency. However, with Ripple CEO Brad Garlinghouse expressing optimism about a resolution in the near future, investor confidence in XRP has been bolstered. A favorable outcome in the lawsuit could potentially unlock significant institutional investment and propel XRP to new heights.
Furthermore, XRP's growing ecosystem of partnerships and integrations is solidifying its position as a leading player in the global payments landscape. By collaborating with financial institutions and payment providers, XRP is expanding its reach and demonstrating its practical utility. This expanding network effect is likely to attract more users and investors, further driving price appreciation.
While XRP's performance has been impressive, it is essential to approach any investment with caution. The cryptocurrency market remains highly volatile, and regulatory risks persist. However, the confluence of XRP's unique value proposition, technological advantages, and improving fundamentals positions it favorably for continued outperformance in the long term. As the broader cryptocurrency market matures and institutional adoption accelerates, XRP's focus on utility and scalability could give it a significant competitive edge.
Ultimately, the decision to invest in XRP should be based on thorough research, risk tolerance, and a long-term investment horizon. By carefully considering these factors and staying informed about market developments, investors can make informed decisions about whether XRP aligns with their investment goals.

Bitcoin rangingThe final sell-off of the German government's BTC reserves has calmed down to the point of the big bad olf being gone. Mt Gox is still in the back of everyone's mind which is why the fear greed index still sits below 45 but I truly belive that we have bottomed already and BTC is preparing for a massive explosion in Q4 of this year.

Bitcoin – We Are In July 2016, In July 2024Just look at what the market looked like in July 2016, before the US election. As it did in the first half of 2016, Bitcoin has moved the same way over the year 2024 so far. That means if Donald is elected again we are up bigly running to April next year and then up hugely running to the end of 2025. We will all get very rich but it won't matter anyway because society will become very unstable. But you will enjoy great wealth in the meantime, enjoy!

BTC/USDT 4H Long Analysis: Key Levels and Market OutlookEllipse has entered a long position at 59.2K, reflecting confidence in the bullish signals present despite some concerns.
4-Hour Chart Analysis:
Bullish Signals:
Price breakout above the Ichimoku cloud
Lagging Span (Chikou) has broken out of the cloud
Lagging Line (Chikou) is clear of both price and cloud
Pivot reversal (24/12)
Tenkan-Sen (TK) is above Kijun-Sen (KJ)
Future Senkou Span B points upwards
These bullish signals indicate a potential upward momentum in the short term.
Concerns on the 4-Hour Chart:
Low volume in the market
Price remains below the 200 EMA
100 EMA is below the 200 EMA
While we have several bullish signals, the low volume and position of the EMAs suggest caution.
Zooming Out to the Daily Chart:
Bullish Signals:
Price is above both Tenkan-Sen (TK) and Kijun-Sen (KJ)
Price is above the 200 EMA on the daily chart
Found support on the 200 EMA daily and monthly pivot (S1)
These signals suggest a stronger bullish trend when viewed on a longer timeframe.
Bearish Signals on the Daily Chart:
Tenkan-Sen (TK) is below Kijun-Sen (KJ)
Price is still under the daily Ichimoku cloud
Future cloud (Senkou Span) is bearish
Despite the bullish signals, the bearish cloud configuration and the position of the Tenkan-Sen and Kijun-Sen warrant caution.
Key Resistance Levels:
200 EMA on the 4-hour chart at 61.2K
Yearly pivot R2 at 62.7K
Lower boundary of the daily cloud at 64.3K
These resistance points are crucial levels to watch for potential price rejections.
BTC/USDT shows mixed signals across different timeframes. On the 4-hour chart, several bullish indicators suggest potential upward movement, but the low volume and the EMA configuration urge caution. The daily chart shows a more pronounced bullish trend above the 200 EMA, yet the bearish cloud and Tenkan-Sen/Kijun-Sen arrangement could limit gains. Key resistance levels should be monitored closely for any breakout confirmation or potential reversals.
Trade safe and always consider multiple factors in your analysis!

BTC upside potential for the next 24 hours The Bitcoin Conference 2024, the largest world’s Bitcoin conference, kicks off in Nashville later today. Republican presidential candidate Donald Trump will be its keynote speaker on Saturday. There are rumors that he will announce that Bitcoin will be transformed into a strategic reserve asset.
Meanwhile, the organizer of the conference, Bitcoin Magazine, denied rumors that the Democrat presidential candidate Kamala Harris would be speaking. “No surprise. What can she say to us when she’s actively imprisoning developers, forcing our industry overseas, attacking PoW… it would have been a disaster for her,” the CEO of Bitcoin Magazine David Bailey said.
“I gotta be honest, feels like Kamala should commute Ross Ulbricht’s sentence before addressing the Bitcoin community. That’s the tables stakes. Both Trump and RFK have promised to do that day 1,” Bailey said.
Ulbricht was sentenced to life in prison without the possibility of parole under the Obama administration in 2015 for creating and operating the darknet market website Silk Road. This website sold drugs and other illegal goods.
“All eyes on Trump now. Choice is simple really, Trump Pump or Biden Dump?,” Bailey added.
Bitcoin may reach $100,000 “very soon” on expectations that the Republicans will win the US presidential elections in November, the CEO of CSOP Asset Management Ding Chen told Bloomberg earlier this week.
The price of Bitcoin fell 2.5 percent to $64,190 over the past 24 hours, Trading View’s Bitcoin chart shows, while ATTMO forecasts strong sun for Bitcoin for the next 24 hours, indicating upside potential and a bullish trend.
Follow us for more crypto news and weather reports!

Bitcoin BTCUSD Bullish Side Money heist PlanMy Dear Robbers / Traders,
This is our master plan to Heist Bitcoin BTCUSD market based on Thief Trading style Technical Analysis.. kindly please follow the plan I have mentioned in the chart focus on Long entry. Our target is Red Zone that is High risk Dangerous level, market is overbought / Consolidation / Trend Reversal at the level Bearish Robbers / Traders gain the strength. Be safe and be careful and Be rich.
Note: If you've got a lot of money you can get out right away otherwise you can join with a swing trade robbers and continue the heist plan, Use Trailing SL to protect our money.
Stop Loss : Recent Swing Low using 2h timeframe
Warning : Fundamental Analysis comes against our robbery plan. our plan will be ruined smash the Stop Loss. Don't Enter the market at the news update.
Loot and escape on the target 🎯 Swing Traders Plz Book the partial sum of money and wait for next breakout of dynamic level / Order block, Once it is cleared we can continue our heist plan to next new target.
Support our Robbery plan we can easily make money & take money 💰💵 Follow, Like & Share with your friends and Lovers. Make our Robbery Team Very Strong Join Ur hands with US. Loot Everything in this market everyday make money easily with Thief Trading Style.

47k Coming for Bitcoin?$Bitcoin #CME 1D chart;
The gap formed by the opening last week has not yet been filled. I think the rise will not start before this place is filled.
The Bat Harmonic structure, which is also formed in the current structure, points us to $ 47k levels. It is difficult to say anything clear if it will come true. However, we should not forget that this possibility also exists.
Bitcoin had received an upward reaction with the support it received with its last visit to the IMB level. However, as can be seen, it has not yet made any contact with the IMB zone at $ 47k levels.
It doesn't always touch these areas, of course, but why not:)

Solana Steals the Show: Outperforming Bitcoin and EthereumWhile the cryptocurrency market has traditionally been dominated by Bitcoin and Ethereum, a new contender is emerging as a potential market leader: Solana. This high-performance blockchain platform has been making significant strides, outperforming both BTC and ETH in recent times. The question on everyone's lips is: Is this a sign of things to come for Solana in the remainder of this bull market?
Solana's recent surge can be attributed to several factors. Its robust network, capable of handling a high volume of transactions at lightning speed, has attracted a growing developer community. This ecosystem is rapidly expanding, with new projects and applications being built on the Solana blockchain. This increased activity not only enhances the platform's utility but also boosts investor confidence. scalability and low transaction fees has positioned it as a strong competitor to Ethereum, which has faced scalability challenges in the past. As decentralized finance (DeFi) continues to gain traction, Solana's ability to handle high transaction volumes efficiently is a significant advantage.
However, it's essential to approach Solana's performance with a degree of caution. While the recent surge is undoubtedly impressive, the cryptocurrency market is notoriously volatile. Past performance is not indicative of future results. Factors such as regulatory changes, market sentiment, and competing blockchain platforms could impact Solana's trajectory.
Additionally, it's worth noting that Bitcoin and Ethereum have their own unique strengths and advantages. Bitcoin remains the dominant digital currency with a strong brand recognition and a large, established user base. Ethereum, on the other hand, is the leading platform for smart contracts and decentralized applications.
While Solana's recent outperformance is undoubtedly exciting, it's too early to definitively declare it the next big winner in the cryptocurrency market. The crypto landscape is highly competitive, and new challenges and opportunities are constantly emerging.
Investors should conduct thorough research and consider diversifying their portfolios across multiple cryptocurrencies. It's essential to have a long-term perspective and be prepared for market fluctuations.
As the bull market progresses, it will be fascinating to observe how Solana continues to evolve and compete with its more established rivals. If it can maintain its momentum and address any potential challenges, it could solidify its position as a major player in the cryptocurrency ecosystem. However, only time will tell if Solana's recent success is a sustainable trend or a temporary blip in the market.

Hash Ribbons Signal Potential Bitcoin Bull RunMiner Capitulation Ends, Igniting Bullish Outlook
The cryptocurrency market is abuzz with excitement as a key indicator signals a potential turning point for Bitcoin. The Hash Ribbons indicator, a tool used to measure miner capitulation, has recently shifted into a bullish "buy" signal. This development, coupled with other positive market trends, is fueling speculation of an imminent Bitcoin rally.
The Hash Ribbons indicator tracks Bitcoin's hashrate using two moving averages: a 30-day and a 60-day. When the shorter moving average dips below the longer one, it typically signals miner distress and potential market downturn. Conversely, when the 30-day average surpasses the 60-day, it historically marks a "buy" signal, often preceding significant price increases. The recent shift to a bullish signal indicates that miners may have weathered the storm, and Bitcoin could be poised for an upward trajectory.
This positive development is further reinforced by evidence suggesting the end of miner capitulation. Miners often sell their Bitcoin holdings during periods of low profitability to cover operational costs. When this selling pressure subsides, it can lead to a price increase as the supply of Bitcoin available for sale decreases.
Market Enthusiasm Amidst Uncertainties
While the Hash Ribbons signal and the apparent end of miner capitulation are undoubtedly bullish indicators, it's essential to consider the broader market context. Several factors could potentially dampen Bitcoin's momentum.
One significant concern is the impending payout of claims from the collapsed Mt. Gox exchange. A substantial amount of Bitcoin is expected to be released into the market, which could exert downward pressure on prices. Additionally, the potential approval of Ether ETFs in the United States has introduced a new element of uncertainty. While this development could benefit the broader cryptocurrency market, it may also lead to increased volatility in Bitcoin's price.
Despite these potential headwinds, the overall sentiment among market participants appears to be optimistic. The Hash Ribbons signal has generated significant buzz, and many analysts believe that Bitcoin is primed for a substantial rally. However, as with any investment, it's crucial to approach the market with caution and conduct thorough research before making any decisions.
The cryptocurrency market is highly volatile, and prices can fluctuate rapidly. Investors should carefully consider their risk tolerance and investment goals before allocating funds to Bitcoin or any other digital asset. While the Hash Ribbons indicator and other positive factors suggest a potential bullish trend, it's essential to remain vigilant and monitor market developments closely.
Ultimately, the future of Bitcoin's price is difficult to predict with certainty. However, the recent bullish signals provide a glimmer of hope for investors who have weathered the cryptocurrency market's ups and downs. As the market continues to evolve, it will be fascinating to see how Bitcoin responds to the challenges and opportunities ahead.
