Bitcoin : Stay heavy on positionsBitcoin : Stay heavy on positions (2x~3x)
Maintaining the same outlook as before.
** This analysis is based solely on the quantification of crowd psychology.
It does not incorporate price action, trading volume, or macroeconomic indicators.
Bitcoinlong

ETHUSDT 4h
CRYPTOCAP:ETH might be ready to pop!
Entry: $4,869
Target: $6,136
Consolidation looks like a spring ready to launch 🚀
Keep eyes on the breakout!
DYOR & NFA
#ETH #Crypto

Bitcoin Price Prediction: Will BTC Hit $119K Next?Bitcoin Price Prediction: Will BTC Hit $119K Next?
Bitcoin’s journey has been nothing less than a roller coaster, marked by dramatic rises and sharp falls. As of late, the cryptocurrency has seen fluctuations influenced heavily by broader economic signals, particularly the policy decisions from the United States Federal Reserve. The latest buzz in the crypto community revolves around whether Bitcoin can breach a new milestone of $119,000. This speculation is fueled by recent shifts in the market and macroeconomic policies that could either propel or hinder this ascent.
Current Market Overview
Key Resistance and the $118K Threshold
Bitcoin currently faces a significant resistance level at $118,000. This figure is not just a random high point; it represents a critical psychological and technical barrier. A break above this level could signal a strong bullish momentum, potentially setting the stage for reaching new heights. The resistance has formed due to various factors including profit-taking, historical resistance levels, and speculative trading behaviors.
The Role of the US Federal Reserve
The Federal Reserve's policies, particularly interest rate cuts, have a profound impact on investment in risk assets like cryptocurrencies. Lower interest rates generally decrease the yield on safer investments like bonds, making higher-risk investments more attractive. The anticipation around the Fed's decisions can lead to increased volatility in the Bitcoin market.
Liquidity and Market Sentiment
The liquidity in the Bitcoin market, evidenced by the influx of both buy and sell orders, plays a crucial role in its price movements. High liquidity leads to less price manipulation and more stability, whereas low liquidity can lead to higher volatility. Currently, the market is witnessing substantial liquidity, indicating active participation from both retail and institutional investors.
Factors Influencing Bitcoin's Price Trajectory
Institutional Adoption
One of the primary drivers behind Bitcoin’s potential rise to $119K is the increasing adoption by institutional investors. As more firms enter the market, their substantial buying power can significantly push the price upwards. This adoption also adds legitimacy to Bitcoin, encouraging more cautious investors to dip their toes in the crypto waters.
Technological Advances
Improvements in blockchain technology and the introduction of new features can also influence Bitcoin's price. For instance, enhancements in scalability and security can make Bitcoin more attractive to both investors and users.
Regulatory Environment
Regulations play a pivotal role in shaping the cryptocurrency landscape. Positive regulatory developments, or lack of negative ones, could boost investor confidence and push the price of Bitcoin higher.
Economic Indicators and Market Sentiments
Inflation and the Dollar Index
Inflation levels and the strength of the dollar also influence Bitcoin’s value. Typically, Bitcoin has been seen as a hedge against inflation. A weaker dollar often makes Bitcoin more attractive to international buyers, potentially pushing its price up.
Sentiment Analysis
Market sentiment, driven by news and social media, significantly impacts Bitcoin’s price. Positive news can lead to fear of missing out (FOMO), driving the price up, while negative news can trigger panic selling.
Technical Analysis and Future Predictions
Chart Patterns and Indicators
From a technical standpoint, Bitcoin has shown resilience by bouncing back from several corrections. The formation of a bullish flag pattern, combined with strong support levels being tested and held, suggests upward momentum.
Predictive Models
Various predictive models based on historical price data, market cycles, and external economic factors suggest a bullish outlook for Bitcoin. These models often incorporate elements like stock-to-flow ratios which have been historically accurate in predicting Bitcoin’s long-term price movements.
Expert Opinions
Many industry experts and analysts have weighed in on Bitcoin’s potential to hit $119K. While opinions vary, the prevailing sentiment is cautiously optimistic, contingent on market conditions and macroeconomic factors remaining favorable.
Conclusion
The question of whether Bitcoin will reach $119K is complex and laden with variables. Key factors include Federal Reserve policies, market liquidity, institutional investment, and broader economic indicators. While the short-term journey may be volatile, the long-term outlook for Bitcoin remains bullish, with many paths potentially leading to new all-time highs. As always in the crypto world, only time will tell, but the signs are promising for those betting on Bitcoin’s success.

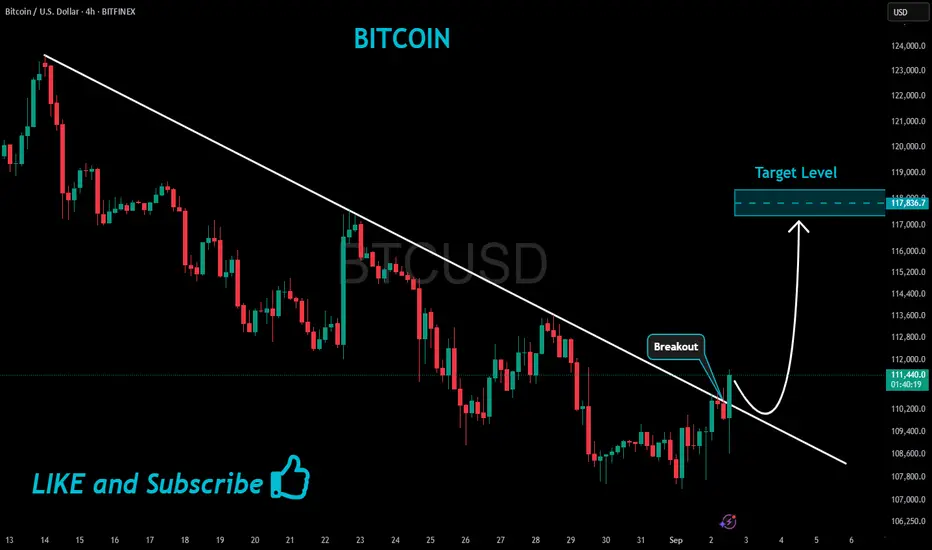
BITCOIN Bullish Breakout!
HI,Traders !
#BITCOIN made a bullish
Breakout of the falling resistance
And the breakout is confirmed
So we are bullish biased
And we will be expecting
A further bullish move up !
Comment and subscribe to help us grow !
BitCoin $BTC weekly demand level helping the strong rallyWeekly demand imbalance is still in control and is playing out well. A third large bullish candlestick body is being created. Trying to break the resistance level and the all-time highs.

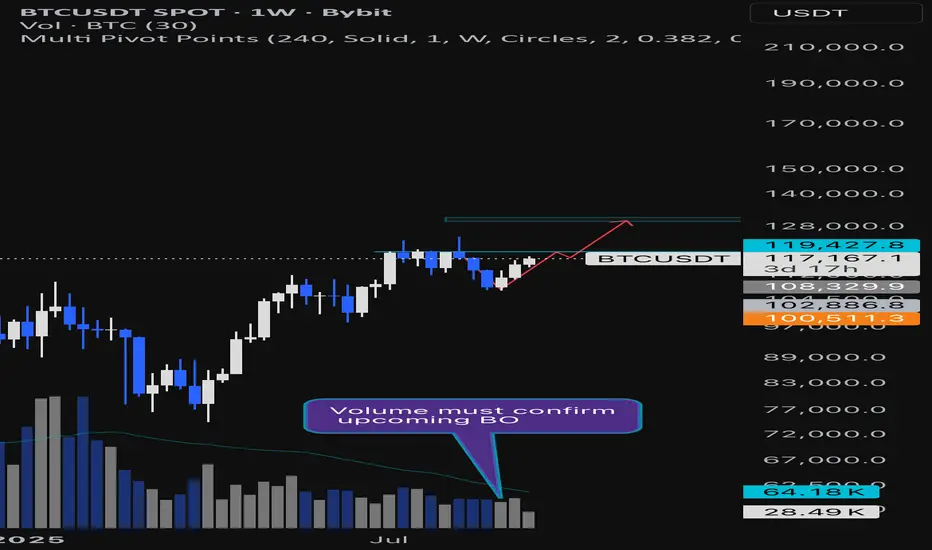
BTCUSDT Weekly Chart Analysis | Bullish V-Pattern Breakout ?BTCUSDT Weekly Chart Analysis | Bullish V-Pattern Breakout Possible
🔍 Let’s dive into the Bitcoin/USDT weekly setup and map out the current momentum, focusing on a key bullish scenario as price nears decisive levels.
⏳ Weekly Overview
Bitcoin is trading near $119,427, just below a major resistance zone at $119,430. A confirmed weekly close above this level, accompanied by sustained volume, would activate a textbook bullish V-pattern breakout. The V bottom structure is recognized for its aggressive buying pressure — price first sharply reverses from the support zone, then rallies as bulls take control, validated by both price and volume signals.
🔺 Long Setup:
A strong volume-backed weekly close above $119,430 unlocks a 10% move at RR1, projecting further upside toward the next reachable target at $130,000, which acts as a Potential Reversal Zone (PRZ). The setup relies on clean confirmation: breakout, high volume on the weekly, and consolidation above resistance for sustained momentum.
📊 Key Highlights:
- Weekly V-pattern maturation can drive a strong bullish leg if confirmed above $119,430.
- Volume confirmation is vital: look for above-average weekly bars to validate breakout strength.
- Target zone sits at $130k, an area with clustering past liquidity and technical importance (PRZ).
- If the breakout stalls or is rejected, expect price to retest lower bands; first support now sits at $113,000–115,000.
🚨 Conclusion:
A bullish scenario is building, hinging on a weekly close with volume above $119,430. Such confirmation would validate a breakout from the V-pattern and set sights on $130k, where trend participants may look to realize or reassess positioning. Failure at this level could reload bids at key lower supports. Stay sharp for volume cues and structural follow-through.
Bitcoin - It is bullish either way!💎Bitcoin ( CRYPTO:BTCUSD ) still remains bullish:
🔎Analysis summary:
Yes, over the past couple of days we have been seeing a quite negative correction on Bitcoin. However, looking at the higher timeframe, Bitcoin remains totally bullish. So even if Bitcoin continues with the recent correction, it would ultimately result in a bullish all time high break and retest.
📝Levels to watch:
$60.000
SwingTraderPhil
SwingTrading.Simplified. | Investing.Simplified. | #LONGTERMVISION

Analytics: Market outlook and forecasts
📈 WHAT HAPPENED?
Last week, Bitcoin continued its upward movement to the resistance zones. However, the seller didn’t show any activity, and the market only paused.
We’re currently trading in a narrow sideways pattern, but the buyer still has the initiative, despite being in the selling zone.
When trying to resume sales, there was a confident absorption at the $115,000 level, as shown on the cluster chart. We noted this level in our review on TradingView.
💼 WHAT WILL HAPPEN: OR NOT?
The priority scenario is an upward exit and a test of the next resistance level within today.
However, there is still a high probability of a sharp correction. Trading volumes have decreased, and seller activity could trigger a sharp downward move to the $111,000 level at any time.
The Federal Reserve meeting and interest rate decision on September 17 could increase volatility and the likelihood of a test of lower levels. Therefore, it is important to exercise caution when opening any positions this week.
Buy Zones:
$114,300–$113,500 (volume zone)
$111,600–$110,500 (accumulated volumes)
~$108,400 (cluster anomalies)
$108,000–$102,500 (accumulated volumes)
Sell Zones:
$117,500–$119,000 (accumulated volumes)
$121,200–$122,200 (buy absorption)
📰 IMPORTANT DATES
This week, we’ll be following these macroeconomic events:
• September 16, Tuesday, 12:30 (UTC) — publication of the volume and core index of US retail sales for August;
• September 17, Wednesday, 6:00 (UTC) — publication of the UK consumer price index for August;
• September 17, Wednesday, 9:00 (UTC) — publication of the Eurozone consumer price index for August;
• September 17, Wednesday, 13:45 (UTC) — announcement of the Canadian interest rate decision;
• September 17, Wednesday, 18:00 (UTC) — statement and economic forecasts from the US FOMC, as well as announcement of the US Federal Reserve interest rate decision;
• September 17, Wednesday, 18:30 (UTC) — US FOMC press conference;
• September 18, Thursday, 11:00 (UTC) — UK interest rate decision announcement;
• September 18, Thursday, 12:30 (UTC) — release of the US initial jobless claims and the US Philadelphia Fed's September Manufacturing Activity Index;
• Friday, September 19, 3:00 (UTC) — announcement of Japan's interest rate decision.
*This post is not a financial recommendation. Make decisions based on your own experience.
#analytics
Bitcoin : Stay heavy on positionsBitcoin : Stay heavy on positions (2x~3x)
Maintaining the same outlook as before.
** This analysis is based solely on the quantification of crowd psychology.
It does not incorporate price action, trading volume, or macroeconomic indicators.

BitCoin $BTC weekly demand from $110,500 is playing out wellBitCoin CRYPTOCAP:BTC weekly demand from $110,500 is playing out well. Trying to reach the resitance level overhead and hopefully break all-time highs.

BITCOIN HIGH PROBABILITY SETUP!!!🚨 BTCUSD HIGH PROBABILITY BUY SETUP 🚨
* Here We Can See The Next Potential Move For BTCUSD Coming Hours/Days.
* Keep Your Eyes Close On Your Trading Positions.
* Happy PIP Hunting Traders.
FXKILLA.

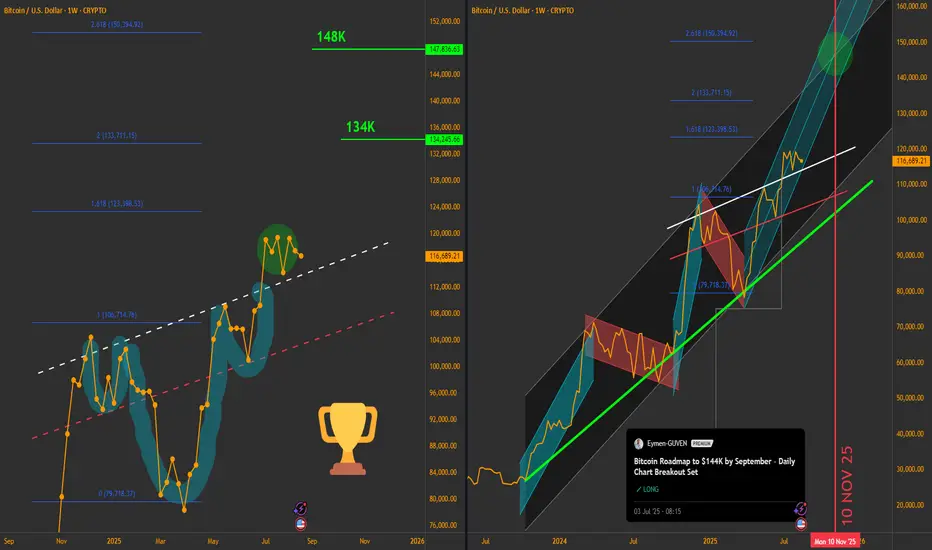
Bitcoin Roadmap Update: Cup & Handle Targeting $148K
Hello traders, today I am reposting my analysis for Bitcoin on the weekly timeframe with updates.
Right Window – Previous Roadmap
The right chart shows my earlier analysis “Bitcoin Roadmap to $144K by September – Daily Chart Breakout Set”. In that setup, the main uptrend channel (black) from October 2023 and sub-channels (red and cyan) were mapped.
Although I mistakenly closed the trade after the first target was achieved, I still believe the uptrend from mid-March 2024 is ongoing. I have extended my projection to mid-November 2025, with a target of $148K.
Left Window – Current Structure
On the left chart, we see a new bullish pattern developing. This can be interpreted as either a cup & two handles or an inverse head & shoulders.
Price has already closed above the neckline (white line).
A successful retest of the neckline adds confidence to the breakout.
Fibonacci extension levels project:
200% ≈ $134K
260% ≈ $148K
As long as Bitcoin trades above $100K, I believe the next phases are toward $134K and then $148K.
Proposed Position Setup
Entry zone: Current price area (~$116K)
Stop-loss: ~$95K (conservative placement below $100K)
Target: $148K
Alternate stop for aggressive traders: Weekly close below $105K (red shoulders-support line)
This setup balances both faster and longer-term trading styles.
Risk-to-Reward Evaluation
Potential Profit: ~$32K (from $116K to $148K)
Potential Loss: ~$21K (from $116K to $95K)
Risk-to-Reward Ratio: ~1.5 : 1
This is acceptable for a weekly swing trade, especially given the uptrend confirmation and multi-pattern confluence.
Key Takeaways & Timeline
Trend bias: Bullish
Main support: $100K (conservative stop-loss below this)
Main targets: $134K and $148K
Expected timeline: Mid-November 2025
Invalidation: Weekly close below $100K (or $105K for aggressive traders)
I remain bullish on Bitcoin as long as price respects the green uptrend line (Oct 2023) and holds above $100K. Volatility is expected, but structure remains intact.
Trade safe and size positions according to personal risk tolerance.
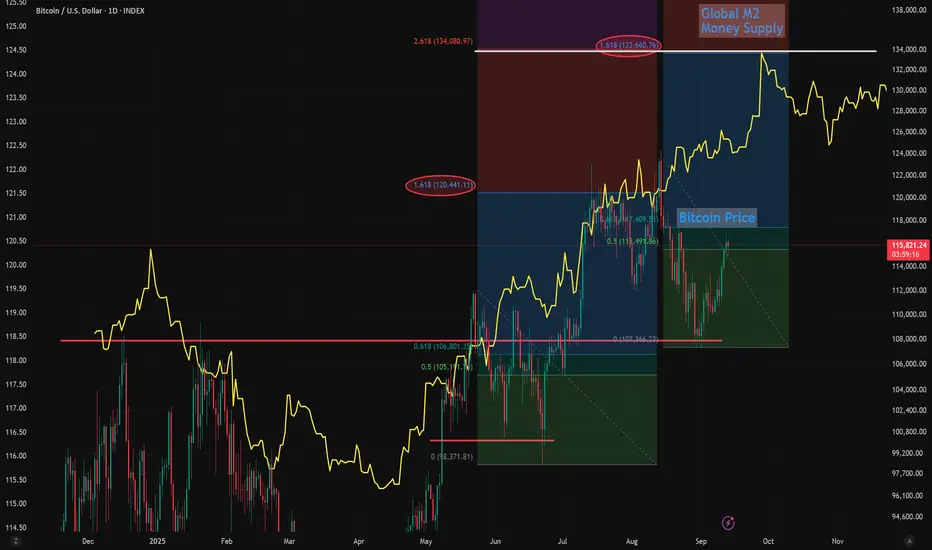
Global M2 and Bitcoin Fib Bounce Targets Point to $134K Next Global M2 has been leading Bitcoin which has been diverging, mostly due to an economic slowdown and waiting for interest rates to start dropping as a catalyst.
Since we're pricing in and high probability of 3 rate cuts starting in September, I expect Bitcoin to start pushing higher and several studies point toward $134k - $135k from here.
These Fibs studies aren't exactly correct, b/c I drew the high / low using the wiicks vs the real bocy, but still interesting.
The first Fib swing high/low correction forecast the pump to the 1.618 target.
So using the most recent high/low swing, points toward around $134k on the 1.618 which is coincidentally the 2.618 extension from the first Fibonacci.
My bull-flag targets on Bitcoin also point to a measured move of $134k-$135k as the next likely profit target, before another pullback and ultimately on the way to $150k this year I think.
Let me know your thoughts below.
- Brett
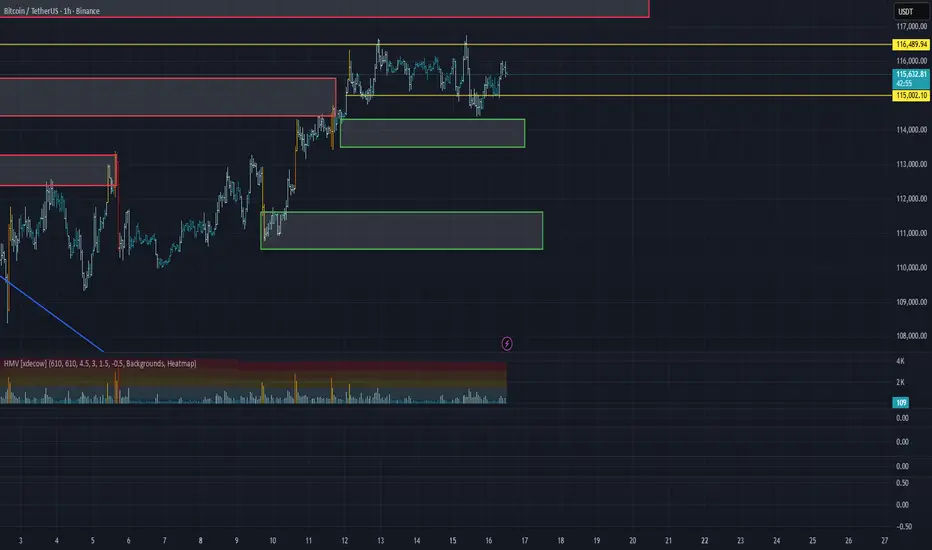
BTC/USDT Analysis. Buyers Remain in Control
Hello everyone! This is a trader-analyst from CryptoRobotics, and here’s the daily analysis.
Yesterday, Bitcoin tested the $114,300–$113,700 zone (market sell absorption) and continued its upward move.
At the moment, we have broken through the $114,400–$115,500 sell zone (volume zone) and are now testing buyer liquidity around $115,000. The current selling wave shows weakness, so the overall context remains bullish.
We expect further upside movement towards the next sell zones, either from the current price or after a potential retest of the new volume zone at $114,300–$113,500.
Buy Zones:
$114,300–$113,500 (volume zone)
$111,600–$110,500 (accumulated volumes)
~$108,400 (cluster anomalies)
$108,000–$102,500 (accumulated volumes)
Sell Zones:
~$116,500 (volume anomaly)
$117,200–$119,000 (accumulated volumes)
$121,200–$122,200 (buy absorption)
This publication does not constitute financial advice.
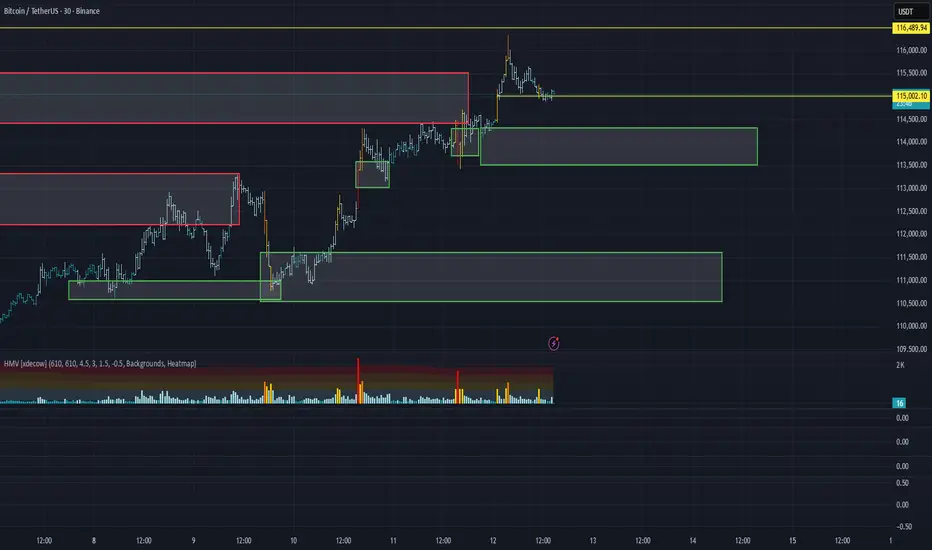
Bitcoin BTC is at a Critical Level: Equal Highs Trade Plan💰 Bitcoin (BTC) Update 💰
BTC is currently trending upward 🟢📈 on the 30M timeframe ⏰ and has reached a critical level ⚖️. We’re seeing a shift in structure 🔄, but there are equal highs forming 📍, leaving the question: will price break higher and continue bullish 🚀, or reject and move lower 🔽?
📊 My trade plan is simple:
✅ Wait for a break above the current range/equal highs 📈
✅ Look for a retrace + retest 🔄
✅ Enter long on confirmation 🎯
If this setup fails to play out, then the idea is invalidated ❌ and we stand aside.
⚠️ This analysis is for educational purposes only and not financial advice. 📚

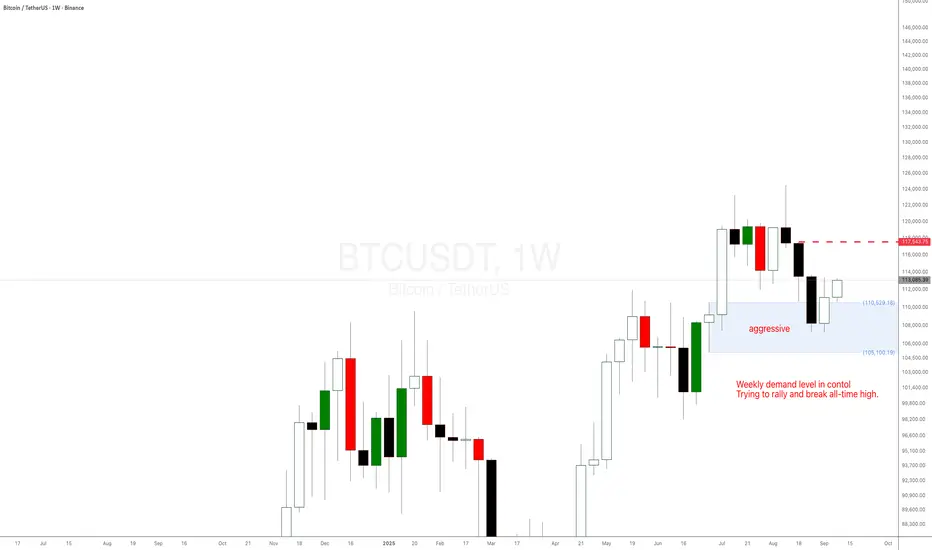
BitCoin BTC is trying to break all-time high with weekly demandBitCoin BTC is trying to break all-time high with the help of the aggressive weekly demand level at $110,500. Trying to rally and break all-time high again.
Bitcoin : Stay heavy on positionsBitcoin : Stay heavy on positions (2x~3x)
Maintaining the same outlook as before.
** This analysis is based solely on the quantification of crowd psychology.
It does not incorporate price action, trading volume, or macroeconomic indicators.

Bitcoin BTC Trend Shift: Watching for a Break (BoS) Confirmation🚀 Bitcoin (BTC) Update 🚀
Bitcoin has made a bullish move 🟢📈, showing a clear structural shift to the upside 🔄 on the 4H chart ⏰. My bias remains bullish ✅, but with a degree of caution ⚠️.
What I want to see next is a decisive break above the previous swing high 📍📊 — this would confirm a true break of structure (BOS) 🔓 versus the current stage, which is only a structural shift 🔄.
⚠️ This analysis is educational only and not financial advice. 📚

Bitcoin Daiy SMA UPDATEThis chart uses the SMA, Simple Moving Average
Red = 50, Blue = 100, Green = 128, Yellow = 200
The weekend was calm and very low trading.
PA is ranging along the 100 SMA and sitting, waiting.
PA has the potential to move in either direction right now but the Bulls are certainly present, Keeping PA static.
Daily MACD remains Bulish with room to move higher, Histogram is Green
On the shorter term 4 hour, we can see how the 50 SMA is supporting PA while the 100 is currently the line to cross at 111582
PA has support below and is avobe the VRVP POC ( red dots )
Shorter term certainly appears more Bullish
The 4 hour MACD also shows this
The MACD came down and tested neutral line as support and the Histogram here is alo Green.
But understand, this does NOT guarantee a rise further.
The lines of Resistance abive are growing.
Currently, beginning aroun 113K
The Blue line on the Daily chart is the ultimate Goal to be crossed.
This is a LONG Term line of resistance that has rejected EVERY ATH since 2011.
It is the only line that has done this and what is important to know, this is a Calculated Arc, part of a Fibonaccj Spiral ( as explained in a previous post)
This is the Bigger picture, PA from November 2009, the year after Bitcoin Was born
As you can see, PA is being Sqqueezed and HAS to react before January 2026 or face stiff rejection below that Long Term line of support ( dashed line)
What ever happens, this IS the beginning of a New Era, Cycle of Bitcoin.
And this is why we need to pay so much attention to Bitcoin right now.
We MUST rise above that blue Arc of resistance....
And Curently, we are HERE....shown in the chart below.
This is a daily chart from November 2024
PA has been trying to get above this blue Arc since then.
And we are right under it again now,
Target price to get to and hold Above this Blue Arc is around 117K
We may wait till the FED tells us its decision on interest rates this month.

Bitcoin Rally Entering Final Stages!Bitcoin Bull Cycle Analysis:
Historically, Bitcoin has moved in clearly defined market cycles, each lasting roughly 1,064–1,065 days (about 3 years) from bottom to peak, followed by a sharp correction.
2013–2017 Cycle
🔶Bitcoin bottomed in early 2015 and then entered a strong bull run.
🔶Over the next 1,064 days, Bitcoin surged by more than 12,000%, ultimately peaking in late 2017.
🔶After the peak, Bitcoin experienced an 84% decline over the following year, entering a prolonged bear market.
2017–2021 Cycle
🔶From the December 2018 bottom, Bitcoin again began a long bull phase.
🔶In the next 1,064 days, Bitcoin gained over 2,000%, reaching a new all-time high in late 2021.
🔶Similar to the previous cycle, the market corrected sharply, with Bitcoin losing around 76% of its value within a year.
2021–2025 Cycle (Current)
🔶The most recent bottom was recorded in late 2022. Since then, Bitcoin has been in a sustained uptrend.
🔶As of today, the cycle has lasted 1,000+ days, during which Bitcoin has appreciated by roughly 675%.
🔶If the historical pattern continues, this bull run may have about two months left before reaching a cycle peak.
🔶Afterward, the market could undergo a significant correction, potentially in the range of 60–70%, though smaller than previous drops.
Conclusion : Bitcoin’s market history shows a repeating cycle of multi-year bull runs followed by sharp corrections. While past performance does not guarantee future results, the consistency in cycle length and the pattern of diminishing corrections suggest that Bitcoin may soon approach its next major peak. If the trend holds, a significant pullback of 60–70% could follow, offering both risks for late entrants and opportunities for long-term investors. This highlights the importance of caution, disciplined risk management, and strategic planning as we near the potential end of the 2021–2025 bull cycle.

Bitcoin to $500K by 2028–2030Institutional Adoption, Scarcity, and the Devaluation of the Dollar
The question of whether Bitcoin could reach the half‑million mark within the next five to seven years is increasingly debated among investors, economists, and institutions alike. While such projections still carry uncertainty, several converging trends suggest that a $500,000 valuation for Bitcoin by 2028–2030 is within the realm of possibility. These drivers include the rapid pace of institutional adoption, Bitcoin’s fixed supply, its growing narrative as a store of value, the potential role of national reserves, and a macroeconomic backdrop defined by inflation and dollar devaluation. Additionally, the long‑term holding behavior of Bitcoin investors has reduced circulating supply, further amplifying the scarcity effect.
1. Institutional Adoption via ETFs and Beyond
The approval and growth of Bitcoin exchange-traded funds (ETFs) in major financial markets mark a watershed moment in the asset’s mainstream acceptance. These vehicles simplify access for institutional investors that were previously constrained by custody and regulatory hurdles. Pension funds, endowments, and sovereign wealth funds are now able to allocate to Bitcoin through regulated channels.
As demand from professional investors grows, the inflows through ETFs act as a continual buy‑side force. Unlike speculative retail buying sprees of previous cycles, institutional allocations are more structured and long‑term oriented, potentially anchoring a more stable demand floor. This steady absorption of supply is expected to become one of the strongest catalysts for Bitcoin price growth this decade.
2. Fixed Supply: The Scarcity Engine
Bitcoin’s most unique feature is its hard‑coded supply cap: only 21 million coins will ever exist . This mathematical certainty contrasts starkly with fiat currencies, where central banks can expand money supply indefinitely. Halving events, which reduce the block rewards of mining BTC roughly every four years, further accelerate scarcity.
By 2030 , the annual mining of Bitcoin will be minuscule compared to today, limiting fresh supply even as institutional demand scales up. In classical economic terms, a growing demand against a fixed or declining supply can only result in upward price pressure.
3. Store of Value in an Inflationary World
The past decade has demonstrated how inflation and monetary expansion distort asset markets. As governments print more money to finance debt and expenditures, investors increasingly seek hedges against the erosion of purchasing power. Historically, gold has played this role.
Bitcoin, with its transportability, divisibility, verifiability, and digital-native characteristics, is now increasingly seen as a modern alternative or complement to gold. If Bitcoin even partially captures the $13+ trillion gold market as a store of value, valuations well above $500,000 per coin become mathematically plausible.
4. Bitcoin as a Component of National Reserves
While still early, several nations are exploring or experimenting with holding Bitcoin in their reserves. For countries facing dollar dependency or geopolitical pressures, Bitcoin provides a neutral, censorship‑resistant reserve asset that reduces reliance on the U.S. financial system.
Should more governments follow El Salvador’s lead or allocate even a small percentage of their foreign reserves to Bitcoin, global reserve demand could represent a massive new buyer base. Even marginal allocations at a sovereign level would create outsized effects due to Bitcoin’s relatively small market capitalization compared to global reserves.
5. The Dollar, Inflation, and Asset Price Revaluation
The U.S. dollar, while still dominant, faces structural challenges: ballooning government debt, persistent fiscal deficits, and the need for monetary expansion to sustain growth. Increased money supply historically leads to currency debasement. As purchasing power erodes, asset prices, from equities to real estate to scarce stores of value like Bitcoin, tend to reprice higher in nominal dollar terms.
Thus, Bitcoin’s potential ascent to $500,000 is not solely about Bitcoin “going up,” but also about the dollar “going down.” In this sense, the milestone is as much a reflection of fiat devaluation as it is of Bitcoin adoption.
6. The Supply Dynamics: 80% Already Parked
On‑chain analytics highlight another critical factor: roughly 80% of Bitcoin supply is currently held by long‑term investors in “dormant” wallets, seldom moved or sold. This indicates that a large portion of the supply is illiquid, effectively taken off the market.
When institutions, retail newcomers, or governments try to acquire Bitcoin in size, they will be competing over the thin slice of supply available for trade. This dynamic creates a potential supply squeeze, which historically has been one of the key drivers of Bitcoin’s parabolic price advances.
Conclusion: A Plausible Milestone, But With Volatility Along the Way
Projecting Bitcoin to $500,000 by 2028–2030 is not simply speculation, it is a thesis grounded in identifiable trends: institutional adoption through ETFs, a mathematically capped supply, Bitcoin’s emerging status as digital gold, the potential for sovereign reserve adoption, and macroeconomic tailwinds fueled by dollar debasement.
However, it is important to note that Bitcoin’s journey will not be linear. Volatility, regulatory battles, and shifts in global macro conditions will shape the trajectory. Yet, the combination of structural scarcity and rising global demand makes the possibility of half‑a‑million per coin a credible long‑term scenario.
#crypto #bitcoin #finance #defi #economy #portfolio #digital #blockchain #trading #asset

Bitcoin is nearing supportFirst, we touched the white Centerline twice.
The third attempt was a miss and triggered a Hagopian, which got filled in mid-August.
Already below the yellow Centerline, Bitcoin wasn’t able to climb back above it.
Now, price is near the L-MLH of both Forks, indicating that potential support lies just ahead. Let’s see if we can hold at the white L-MLH and find a long entry, which would hopefully shoot us back up to the Centerline (remember: there’s an 80% chance of reaching the Centerline).
Patience is key, so let’s relax, grab some popcorn, and watch this movie §8-)

Bitcoin : Stay heavy on positionsBitcoin : Stay heavy on positions (2x~3x)
Maintaining the same outlook as before.
** This analysis is based solely on the quantification of crowd psychology.
It does not incorporate price action, trading volume, or macroeconomic indicators.
