Bitcoin is nearing supportFirst, we touched the white Centerline twice.
The third attempt was a miss and triggered a Hagopian, which got filled in mid-August.
Already below the yellow Centerline, Bitcoin wasn’t able to climb back above it.
Now, price is near the L-MLH of both Forks, indicating that potential support lies just ahead. Let’s see if we can hold at the white L-MLH and find a long entry, which would hopefully shoot us back up to the Centerline (remember: there’s an 80% chance of reaching the Centerline).
Patience is key, so let’s relax, grab some popcorn, and watch this movie §8-)
Bitcoinlong

Bitcoin : Stay heavy on positionsBitcoin : Stay heavy on positions (2x~3x)
Maintaining the same outlook as before.
** This analysis is based solely on the quantification of crowd psychology.
It does not incorporate price action, trading volume, or macroeconomic indicators.

Current outlook of Bitcoin and future projections!BTCUSD which has been bearish atleast some few days ago, seems to be formulating a sell setup. watch closely.

BITCOIN PREDICTION: WHALES PREPARING HUGE MOVE!!!? (damn)Yello Paradisers! In this video, as professional traders, we have been going through multi-time frame analysis. First, we went through an ultra-high time frame where I shared with you that we are touching an important moving average trend line. Because of that, we understand that a channel retest is possible, but we need to be careful because there is a bearish divergence, and we already got a confirmational bearish cross.
On the high timeframe chart, we have seen that the ABC zigzag is already finished. Right now, we are forming a possible first ultra-high timeframe wave, and from that, we are starting the first motive mode wave. We are seeing bullish divergence, and what I forgot to say is that if we start moving to the upside and creating the secondary high timeframe wave, we will touch the CME futures gap and close it. Which is another confluence.
After that, we have been shifting our focus to the medium timeframe. I've told you that what's important is also what you don't see in the market and we are seeing so far no bearish divergence plus what I have didn't show you but there are also two bullish hammer candlestick patterns candles I have been sharing with you the moving average trend line the Fibonacci time zone and the next resistances finally at low time frame chart we have been going through the ending diagonal.
Paradisers! Keep in mind to trade only with a proper professional trading strategy. Wait for confirmations. Play with tactics. This is the only way you can be long-term profitable.
Remember, don’t trade without confirmations. Wait for them before creating a trade. Be disciplined, patient, and emotionally controlled. Only trade the highest probability setups with the greatest risk to reward ratio. This will ensure that you become a long-term profitable professional trader.
Don't be a gambler. Don't try to get rich quick. Make sure that your trading is professionally based on proper strategies and trade tactics.
I apologize; I accidentally turned off the video in the middle. Unfortunately, TradingView doesn't allow me to continue, so the next video will be here on TradingView on Wednesday. Stay tuned.

BTCUSD Breakout Above Trendline – Bullish Continuation Setup🔹 Market Context
On the 15m timeframe, Bitcoin has decisively broken above the descending trendline that had previously acted as dynamic resistance with multiple rejections. This breakout occurred after the market created Equal Highs (EQH) and engineered liquidity above them, followed by a Break of Structure (BOS) and a confirmed Change of Character (CHoCH) to the upside.
The breakout not only invalidates the short-term bearish structure but also signals a possible shift in order flow, with buyers stepping in after liquidity collection.
⸻
🔹 Price Action Breakdown
• Liquidity Grab: The equal highs at ~$108,700–$108,900 were swept, clearing stop orders and creating fuel for a push higher.
• Trendline Break: The clean break and close above the descending trendline suggests weakening seller control.
• Retest Opportunity: Price may revisit the broken trendline or recent demand zone (~$108,700–$108,900) before continuing upward.
• Strong High in Play: The $110,500 zone represents the untested supply area and “strong high” that will likely attract price in the short term.
⸻
🔹 Trade Idea (Bullish Bias)
• Entry Zone: Retest of $108,700–$108,900 demand area
• Stop Loss: Below $108,250 (invalidates bullish structure)
• Take Profit Targets:
• TP1: $109,350 → first reaction level
• TP2: $109,750–$110,000 → psychological liquidity pool
• TP3: $110,500 → untested supply / strong high
⸻ CFI:BTCUSD
🔹 Invalidation
If BTC closes back below $108,250 with strong momentum, this would suggest a failed breakout and reopen short opportunities toward $107,500 and $107,200.
⸻
🔹 Bias Summary
• Primary Bias: Bullish continuation after breakout
• Key Zone to Hold: $108,700–$108,900
• Upside Targets: $109,350 → $110,500
• Invalidation Level: $108,250

BTCUSD: Bullish Reversal from Support with Breakout TargetPotential Targets:
First Target: The recent high around $116,000.
Second Target: $122,00 and a move toward the next resistance levels from the previous uptrend.
Invalidation:
This bullish view would be invalidated if the price breaks and closes decisively below the key support level at ~$106,000.

Bitcoin at Golden Pocket Support – Don’t Sell the Dip?Bitcoin is currently testing the 0.618–0.65 Fibonacci retracement zone (~$108k), a historically strong support level also known as the “Golden Pocket.”
With confluence from CZ’s reminder — “Things to avoid in crypto: Selling the dip” — this area could be a major bounce zone if bulls defend it.
🔹 Strong Support: $108k
🔹 Next Support: $98k if breakdown happens
🔹 Resistance: $113k – $117k
Bias: Watch for confirmation candles. A bounce here could send BTC back toward $113k–117k. A breakdown invalidates this support.

BITCOIN PREDICTION: CRASH WILL STOP HERE!!!? (nobody watching) Yello Paradisers! In this video, I'm sharing with you the ultra-line time frame perspective. We are analyzing the channel and the Elliott Wave Theory on a high time frame chart. I'm sharing with you how the ABC correction is finished. We are going through the Bitcoin CME futures gap or medium time frame. I'm sharing with you the Fibonacci time zone, the Elliott Wave count, and the confirmations we are waiting for to start in your positions.
Paradisers! Keep in mind to trade only with a proper professional trading strategy. Wait for confirmations. Play with tactics. This is the only way you can be long-term profitable.
Remember, don’t trade without confirmations. Wait for them before creating a trade. Be disciplined, patient, and emotionally controlled. Only trade the highest probability setups with the greatest risk to reward ratio. This will ensure that you become a long-term profitable professional trader.
Don't be a gambler. Don't try to get rich quick. Make sure that your trading is professionally based on proper strategies and trade tactics.

BTCUSD is set to cross 125,000$112000 is a key level of support that tested the previous resistance turned support and price bounced off this level $124500 and rejected with head and shoulder formation to support. We can spot a over extension below the key support level $112400.
With strong liquidity trigger from the support level BTCUSD potentially bouncing off the level and may continue to rise upto $125000 and beyond as the continuation of long term uptrend.

BTC update $another dip before the rally
Entering Buy from zone 111200 - 110900 keeping target as 113500$
3rd wave completed
4th is the dip
Buy at 5th

BTC/USDT Analysis. Continuation of the local uptrend
Hello everyone! This is CryptoRobotics trader-analyst with the daily market analysis.
Yesterday, the market followed our scenario, continuing the local uptrend and breaking the previous high. At the moment, there are no strong signs of profit-taking that could trigger a reversal, nor major resistance zones nearby. The main expectation remains further growth towards the $114,400–$115,500 (volume zone), where a reversal pattern may start to form.
For intraday traders, the key level to watch is around $112,000. An abnormally high volume cluster was recorded there, which positioned buyers earlier. If the price dips into this zone and shows a reaction, a local long setup may be considered.
Buy zones:
~$112,000 (local zone, abnormal cluster),
$110,000–$105,000 (accumulated volumes).
Sell zones:
$114,400–$115,500 (volume zone),
~$116,500 (volume anomaly),
$117,200–$119,000 (accumulated volumes),
$121,200–$122,200 (buying absorption).
This publication does not constitute financial advice.
BTC RoadmapBitcoin’s monthly chart shows the same repeating rhythm across cycles: massive rallies, steep drawdowns, and multi-year bases before new highs. But unlike past cycles where drawdowns reached 75–80%, the landscape has changed.
Institutional adoption, ETF inflows, and broader ownership have created a structural cushion. Instead of BTC revisiting deep cycle lows, the worst case now is a retest of the previous peak (~$69k) — the top of the 2021 cycle.
Cycle 1: +23,960%, then -78%
Cycle 2: +8,922%, then -78%
Cycle 3: +1,053%, then -75%
Cycle 4 (current): +300% off the lows so far, ETF-driven
The yellow trendline continues to serve as long-term support. ETF entries and institutional demand should prevent another full collapse like in earlier cycles.
Peak target: $147k Q4 2025
Bottom target: 65k - 74k Q4 2026/Q1 2027
Stop-loss zone (invalidated idea): close below 50W MA
Definitely not written by chatgpt.

BITCOIN PREDICTION: ANOTHER MASSIVE LIQUIDATION INCOMING!!?(bad)Yello Paradisers! In this video, we have been going through multi-time frame analysis. Professional trading requires doing analysis on multiple time frames so you can really understand the context of what's going on. On the ultra-long timeframe, I've been sharing with you the Elliott Wave plus the bearish cross, the bearish divergence.
On the high timeframe chart, we have been going through the ABC zigzag, which seems to be finished already, and we are starting the first wave of our ultra-high timeframe impulse.
On the medium time frame, we have been going through the Fibonacci and Elliott Wave count. I have been sharing with you on the RSI, a bullish divergence. We have been going through the sub-waves and where the secondary wave might end.
We didn't have enough time to go through it, but I wanted to show you the CME Futures gap that will probably close on the creation of the secondary wave.
Paradisers! Keep in mind to trade only with a proper professional trading strategy. Wait for confirmations. Play with tactics. This is the only way you can be long-term profitable.
Remember, don’t trade without confirmations. Wait for them before creating a trade. Be disciplined, patient, and emotionally controlled. Only trade the highest probability setups with the greatest risk to reward ratio. This will ensure that you become a long-term profitable professional trader.
Don't be a gambler. Don't try to get rich quick. Make sure that your trading is professionally based on proper strategies and trade tactics.

Bitcoin buy Soon as soon possibleBitcoin buy Soon as soon possible
The live Bitcoin price today is $111497.14 USD with a 24-hour trading volume of $64109128491.21 USD. We update our BTC to USD price in real-time.

Bitcoin : Stay heavy on positionsA signal for catching a bounce has emerged.
The bounce signal reflects a swing-to-intraday view and is not tied to the broader trend.
Maintaining the same outlook as before.
Bitcoin : Stay heavy on positions (2x)
** This analysis is based solely on the quantification of crowd psychology.
It does not incorporate price action, trading volume, or macroeconomic indicators.

BTC Professional Market Movement Analysis🏗️ How Market Moves
Liquidity Grab at Support 🟢
Price dips into the 112K zone to collect liquidity (stop-hunts + institutional buys).
Market shows wick rejections & volume absorption.
This is where smart money positions for the next leg higher.
Expansion Phase 🚀
After liquidity grab → market expands upward.
Price pushes aggressively toward the 124K resistance.
This movement is fueled by trapped sellers covering shorts + buyers entering late.
Resistance Reaction 🔴
At 124K zone, market faces supply.
Either:
Rejects and falls back toward support (range continues).
Breaks through → signals strong bullish continuation (trend shift).
📉 If Support Fails
If BTC closes below 111K, it means liquidity is not enough.
Market will seek the next major demand zone (100K) where bigger orders sit.
This creates a stop-hunt + deeper accumulation before a new push higher.
🧠 Pro Definition
Market does not move randomly — it moves from liquidity pool to liquidity pool.
BTC is currently collecting orders at 112K support.
Expect a bounce → expansion → test of 124K supply.
If 112K fails, price will seek deeper liquidity near 100K before rebounding.
⚡ In simple terms:
👉 Market first hunts liquidity at support 🟢,
👉 then expands upward toward resistance 🔴,
👉 and finally decides — either reject back into the range or break higher for continuation.

New Highs Ahead ? - BTCUSD Elliott Wave AnalysisHello Friends, Welcome to RK_Chaarts,
Today we are having Elliott wave theory counts on BTCUSD Bitcoin Chart Analysis
The weekly timeframe of the BTCUSD bitcoin chart reveals that we are unfolding Super Cycle Degree Wave (III) in Blue. This wave's sub-divisions, which should total five for a Cycle Degree, are visible. We've completed Waves I & II and begun unfolding Wave III in red.
Within Wave III, we are unfolding the 1st wave ((1)) of one lower degree as Primary (Black). This wave will unfold in five sub-divisions of one more lower degree as Intermediate degree in (Blue).
Daily Outlook:
On the daily outlook, we are currently unfolding wave (4) of Intermediate degree (Blue), a subdivision of wave ((1)) of Primary degree (Black). As wave (4) nears completion, a reversal is expected soon, driving prices toward new highs to complete wave (5) of ((1)).
Additional Support Confirmation:
Further reinforcing the analysis, the Anchored VWAP's Average is also showing support near 104,000. This confluence of support levels increases the likelihood of a reversal, making it an important level to watch for traders.
Key Takeaways:
- We're unfolding Cycle Degree Wave III on the weekly timeframe.
- Wave (4) of Intermediate degree is nearing completion on the daily outlook.
- A reversal is expected soon, driving prices toward new highs.
- Anchored VWAP also showing Support nearby current price.
Important Wave Theory Considerations:
As per wave theory, wave (4) shouldn't overlap wave (1), except in the case of diagonals and triangles. In this scenario, we are unfolding a diagonal, allowing wave (4) to enter into wave (1). However, it's crucial to note that wave (4) should not go beyond the low of wave (2) under any circumstances. If it does, our wave counts would be invalidated.
A Word of Caution:
Elliott Wave Theory and possible wave counts suggest that the price will make new highs on the chart soon. However, the market is inherently unpredictable and always ready to surprise. Therefore, it's essential to consider "what-if" scenarios in your trading journey.
Are we ready for new highs ?
As we navigate the complexities of the market, it's vital to remain adaptable and prepared for any eventuality. By acknowledging the potential for surprises and maintaining a flexible mindset, traders can better navigate the markets and make informed decisions.
Conclusion:
The BTCUSD bitcoin chart is poised for a reversal, driven by the completion of wave (4) and the subsequent unfolding of wave (5). While the analysis suggests new highs are on the horizon, it's essential to remain cautious and consider the unpredictability of the market. Are you prepared for the possibilities that lie ahead ?
I am not Sebi registered analyst.
My studies are for educational purpose only.
Please Consult your financial advisor before trading or investing.
I am not responsible for any kinds of your profits and your losses.
Most investors treat trading as a hobby because they have a full-time job doing something else.
However, If you treat trading like a business, it will pay you like a business.
If you treat like a hobby, hobbies don't pay, they cost you...!
Hope this post is helpful to community
Thanks
RK💕
Disclaimer and Risk Warning.
The analysis and discussion provided on in.tradingview.com is intended for educational purposes only and should not be relied upon for trading decisions. RK_Chaarts is not an investment adviser and the information provided here should not be taken as professional investment advice. Before buying or selling any investments, securities, or precious metals, it is recommended that you conduct your own due diligence. RK_Chaarts does not share in your profits and will not take responsibility for any losses you may incur. So Please Consult your financial advisor before trading or investing.

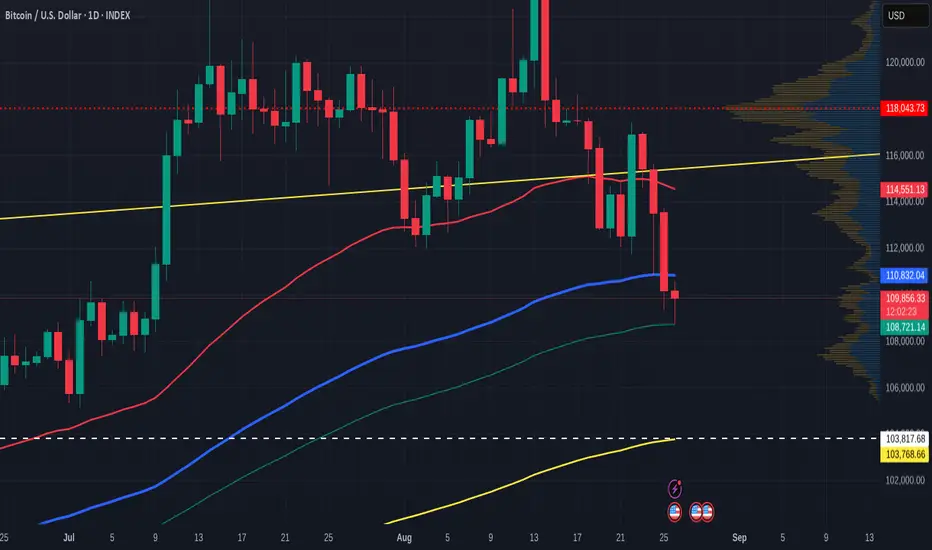
Quick Bitcoin Update with SMA's
PA is currently finding support off the 126 day SMA (Green) having falling through the 100 days SMA ( blue)
The 50 dayy SMA is falling fast and we need to watch this does not act as a line of resistance in the near future.
PA may drop further and we could hit the 200 day SMa ( Yellow ) on around 103k
For me, I am happy to Hit 100k again towards the end of the month..
BUY MORE BITCOIN AT 100K
Bitcoin - The magical $1.000.000 level!🚀Bitcoin ( CRYPTO:BTCUSD ) is not done yet:
🔎Analysis summary:
Over the course of the past couple of months, we have been witnessing a bullish continuation on Bitcoin. After the all time high breakout, there is a high chance that this bullrun will continue and Bitcoin might even retest the resistance trendline at seven digits in the near future.
📝Levels to watch:
$1.000.000
SwingTraderPhil
SwingTrading.Simplified. | Investing.Simplified. | #LONGTERMVISION

BITCOIN MASSIVE CRASH TOWARDS $44K JUST STARTED!!!? (warning) Yello Paradisers!
In this video, I'm sharing with you the CME futures gap that we have created and what needs to be done to close it. On the ultra-high time frame, I'm sharing with you the bearish cross. We are shifting our focus afterward to the high time frame where I'm seeing the bullish divergence. I'm telling you where the daily candle cannot close.
Then, we move our focus to the medium time frame, where I'm sharing with you the RSI bullish divergence plus the support. On the lower time frame, we will look in the next video.
Paradisers! Keep in mind to trade only with a proper professional trading strategy. Wait for confirmations. Play with tactics. This is the only way you can be long-term profitable.
Remember, don’t trade without confirmations. Wait for them before creating a trade. Be disciplined, patient, and emotionally controlled. Only trade the highest probability setups with the greatest risk to reward ratio. This will ensure that you become a long-term profitable professional trader.
Don't be a gambler. Don't try to get rich quick. Make sure that your trading is professionally based on proper strategies and trade tactics.

Bitcoin : Stay heavy on positionsThe market continues to hold support at the prior short-term overbought resistance zone, attempting to stage a rebound. I’ll maintain my position with the same outlook as before.
Bitcoin : Stay heavy on positions (2x)
** This analysis is based solely on the quantification of crowd psychology.
It does not incorporate price action, trading volume, or macroeconomic indicators.

BTCUSD LongBitcoin: Small Bull Flag After Structural Shift – Upside Targets Ahead
After last Friday’s bullish surge following Powell’s speech, Bitcoin has shifted structure and is currently consolidating in a small bullish flag. This pullback appears to be a healthy retracement of the previous impulsive move, setting the stage for another potential leg higher.
Key Levels to Watch:
Immediate Retracement Zone: $45,100 – a potential area to seek new long positions if price dips.
Upside Targets: Looking for a move first toward $117 (likely referring to $117K if BTC breaks ATHs), with an extended upside potential to $123K–$124K.
Macro Tailwinds:
The broader crypto market remains constructive. Expectations of interest rate cuts are fueling risk-on sentiment, which could further enhance upside momentum in crypto assets. Any confirmed dovish pivot or macro easing could accelerate flows into Bitcoin and the wider crypto space.
Trading Plan:
Watch for continuation patterns breaking to the upside, confirming the bull flag resolution.
Manage risk around invalidation zones below recent swing lows.

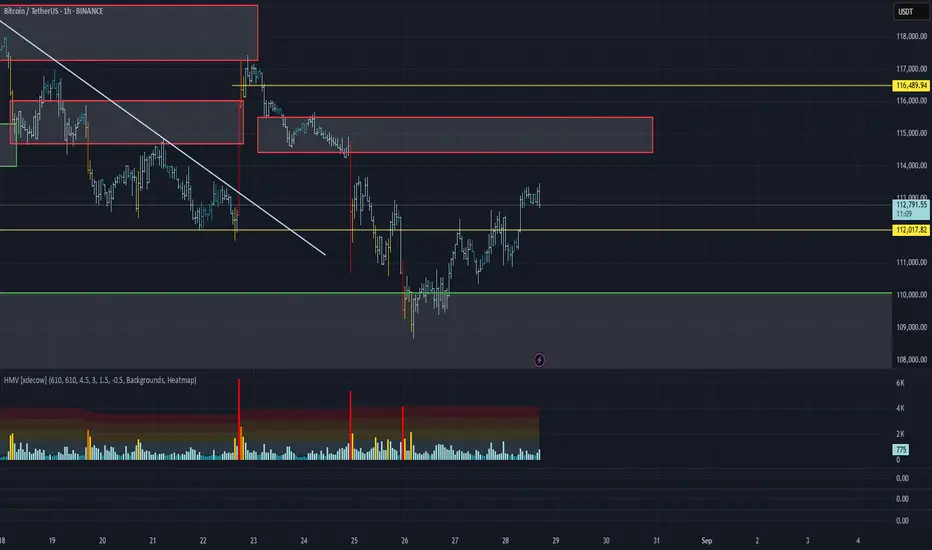
Bitcoin 4H BullishBitcoin tapped into the liquidity at $111,881. There was strong support from the green trendlines, along with a bullish signal from a bullish divergence ✅. This pushed the market significantly higher.
News: Powell also added a positive impulse, helping the 4h candle close above 115k.
👉 As long as we remain within this range, the outlook stays bullish for next week.
👉 A possible re-entry for me is in the yellow box ($114,119), where a high-leverage long position is also placed.
👉 Our weekly close remains the key support for further upward movement.
Wishing you a great weekend! ✌️🚀"
