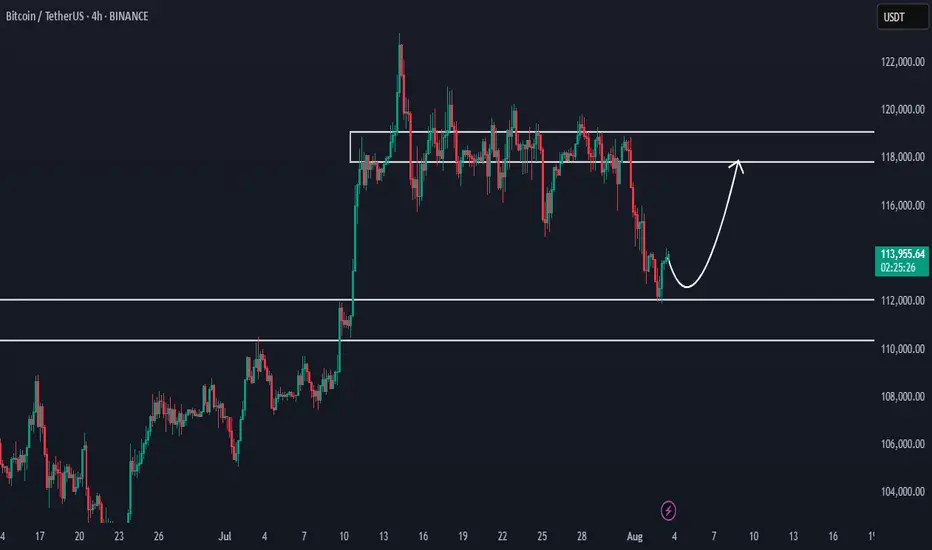
Bitcoin Bounces Back — Is $120K the Next Stop?!Bitcoin ( BINANCE:BTCUSDT ) reacted well to the 50_SMA(Daily) and the Heavy Support zone($112,000-$105,800 and started to rise again.
The question is, can Bitcoin reach $120,000 again and even create a new All-Time High(ATH)!?
In terms of Elliott Wave theory , it seems that Bitcoin has managed to complete the main wave 4 in the descending channel . To confirm the end of the main wave 4 , we must wait for the upper line of the descending channel to break. The structure of the main wave 4 is a Zigzag Correction(ABC/5-3-5) .
I expect Bitcoin to trend higher in the coming hours and attack the resistance area and the upper line of the descending channel(First Target: $117,490) .
Do you think Bitcoin's main correction has begun, or does Bitcoin still have a chance to create a new ATH?
Second target: $119,991
Cumulative Long Liquidation Leverage: $113,526-$112,591
Note: Stop Loss: $111,070
Please respect each other's ideas and express them politely if you agree or disagree.
Bitcoin Analyze (BTCUSDT), 2-hour time frame.
Be sure to follow the updated ideas.
Do not forget to put a Stop loss for your positions (For every position you want to open).
Please follow your strategy and updates; this is just my Idea, and I will gladly see your ideas in this post.
Please do not forget the ✅' like '✅ button 🙏😊 & Share it with your friends; thanks, and Trade safe.
Bitcoinprediction

BTC/USDT Analysis – Full Trend Reversal
Hello everyone! This is the daily market update from a CryptoRobotics trader-analyst.
Yesterday, Bitcoin broke the local market structure to the upside and tested the previously highlighted zone at $114,500–$114,000 (a mirror volume area). A strong buying reaction followed immediately, pushing the price to a new local high.
At this point, we are witnessing a full shift in market direction toward an uptrend. Seller activity remains weak, so we expect the price to continue rising — at least toward the next selling zone at $117,600–$118,600 (volume accumulation).
Below, a new volume area has formed between $115,800 and $114,900. We are watching closely for buyer activity there. If confirmed, it could serve as a long entry. Without such confirmation, the current breakout could turn into a false move, in which case the market may return to sideways rotation.
Buy zones:
$115,800–$114,900 (volume cluster)
$113,300–$112,700 (local absorption of selling)
$110,000–$107,000 (accumulated volume)
Sell zone:
$117,600–$118,600 (accumulated volume)
This publication is not financial advice.

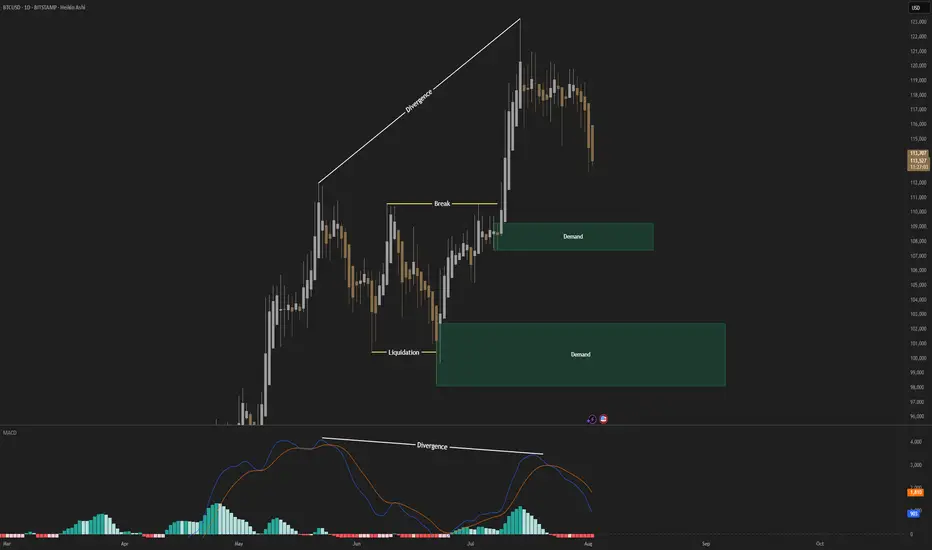
Bitcoin 4h Chart Update [Tight Range / Breakout Opportunities]Breakout Opportunities
We're in a range development zone here! The chart shows Bitcoin (BTC/USD) trading within a tight range, with key levels at $115,000 and $112,000 acting as critical support and resistance zones. The price recently peaked near $123,000 but has since pulled back, forming a liquidity crisis zone around $120,000 where selling pressure kicked in. A breakout above $115,000 could signal a move toward $120,000 or higher, while a drop below $112,000 might push it toward the demand zone. Gotta break out of this range to figure out where we're headin' next!
Demand Zone
$110,000 & $107,000
Price slipped down from $120,000 due to a lack of buying liquidity, potentially it will land into a demand zone between $110,000 and $107,000. This area could act as a strong support level where buyers might step in. If the price holds here, it could bounce back toward the $112,000-$115,000 range. However, a failure to hold this zone might see it test lower support around $107,000 or even $105,000.
Direction and Possible Ranges
Upward Potential: If Bitcoin breaks above $115,000 with strong volume, the next targets could be $120,000 (liquidity crisis zone) and potentially $123,000, aligning with recent highs. A sustained move above $120,000 might open the door to $125,000 or beyond.
Downward Risk: Should the price fail to hold above $112,000 and break below, it could slide into the demand zone ($110,000-$107,000). Further weakness might push it toward $105,000, a psychological and technical support level.
Current Trend: The chart shows a descending trendline from the $123,000 peak, suggesting bearish pressure unless a decisive breakout occurs. The 4-hour timeframe indicates indecision, with the range-bound action hinting at a potential volatile move once direction is confirmed.
Keep an eye on these levels for the next big move!
BITCOIN PREDICTION: a SECRET PATTERN is FORMING (watch out)!!!Yello paradisers! In this Bitcoin prediction, I'm updating you about the crash we predicted earlier in previous videos. I'm showing you on a high timeframe chart the ABC corrective mode wave; we are now forming the C wave. The C wave subdivides itself into five smaller waves because it's a motive mode wave. We are taking a look at the volume. We understand that bears are still in power, so we are waiting for some nice volume from bulls. We are spectating a bullish divergence on the MACD indicator. On RSI, there is exaggerated bullish divergence, and in stochastic RSI, we are in an oversold area.
Then, we are shifting our focus to a medium timeframe. We are zooming into the fourth wave, where we are making our sub-waves right now. On the medium timeframe, we are also spectating bearish divergence. We are waiting for the second booby that will basically increase the probabilities of absorption.
As we have seen previously, that helped us to predict that Bitcoin will be crashing. We are also taking a look at our head and shoulders target, which is at $109,000.
Then we are shifting our focus to a lower timeframe, where we are seeing the secret pattern, triple three. Right now, we are creating a sub-wave XX, which is forming itself as a possible zigzag. Paradisers, make sure that you are trading professionally, focus on long-term growth, and avoid get-rich-quick schemes. Any shortage in trading usually ends up sooner or later in bankruptcy.
Remember, don’t trade without confirmations. Wait for them before creating a trade. Be disciplined, patient, and emotionally controlled. Only trade the highest probability setups with the greatest risk to reward ratio. This will ensure that you become a long-term profitable professional trader.
Don't be a gambler. Don't try to get rich quick. Make sure that your trading is professionally based on proper strategies and trade tactics.

BTCUSDT Elliott Wave – End of the Rally or Start of a Crash?📉 BTCUSDT Elliott Wave Analysis – End of the Rally or Start of a Crash? ⚠️
On the BTCUSDT chart, it appears that the fifth wave of the impulsive structure is nearing completion. The wave count clearly shows a full five-wave sequence, suggesting that Bitcoin may be forming a major top around the $119,000–$125,000 resistance zone.
🔻 If price action confirms a reversal and breaks key support levels, we could see a deep correction potentially taking BTC below $90,000.
📌 Keep in mind this is a scenario based on wave structure and requires confirmation via breakdowns and price action.
💬 What do you think? Is Bitcoin ready for a major correction, or will it break into new all-time highs?
✅ Save this idea & follow for updates!
Can the Thief Rob BTC Pullback Before the Police Arrive?🚨 BTC/USD 💰 Bitcoin Breakout Heist Plan – Robbers in Action 🚀 🚨
Asset: BTC/USD “Bitcoin vs U.S. Dollar” — Crypto King Market
📊 Plan: BULLISH BREAKOUT RAID
🎯 Target: 123,000.00 🎯 — Police Barricade Resistance + Overbought Trap Zone
🔒 Entry: ANY PRICE LEVEL — Thief avg pullback entry at 115,000.00
🛑 Stop Loss: 113,000.00 — Below the Laser Tripwire
🎩 Thief Entry Blueprint 🕵️♂️
The vault’s trembling. The thief’s not waiting.
Layered limit orders are being deployed like smoke bombs — we strike anywhere, anytime, with stealthy precision. No begging for dip, we rob it raw. 💣🧨
📉 Risk Protocol Setup 🛡️
SL: Under local support – cut fast if alarms trigger.
Risk light, rob heavy. Use tight stops or trailing guards to escape with the loot.
📈 Why Rob Long?
Bullish momentum building like a pressure cooker 💥
Resistance zones turning into trapdoors for late bears 🐻
Liquidity pools above — ripe for raid
Sentiment flips, on-chain signals, and macro tailwinds align ⚡
📌 Robbery Reminders:
NO SHORTING — This is a one-way heist 🚷
Avoid news-time chaos ⛔
Use multiple entries (layer style) and escape plans.
Overbought ≠ exit — it’s the bait for the next raid 🧠
💖 LIKE = SUPPORT THE CREW
Every like boosts the Thief Trader movement — more heat, more setups, more wins.
Smash Boost. Share the Heist. Stay Robbing. 🐱👤📈🔥
🔔 Stay tuned. Next breakout blueprint dropping soon.
Bitcoin inverted HEAD & SHOULDERSIf this is an inverted HEAD & shoulders pattern for bitcoin, then the neckline is already broken and bitcoin is Back testing that now, well the target is $160k as well

Bitcoin Ready for Takeoff - $150K Target Ahead! MARKETSCOM:BITCOIN is showing impressive strength after successfully retesting its May high and bouncing back with conviction. This level, along with the 50 EMA, is currently acting as a strong support zone. Holding above this area signals that buyers are in control, and this zone now serves as a major support for the ongoing bullish trend.
At the moment, CRYPTOCAP:BTC is facing minor resistance in the $115K–$116K range. A decisive breakout above this level is likely to trigger strong momentum, opening the doors for a new all-time high. Once this resistance is cleared, our previous projection of $150K comes into play as the next major target.
For now, it’s crucial for MARKETSCOM:BITCOIN to hold the current support zone to maintain the bullish structure. As always, traders should manage risk effectively and place stop-losses to protect their capital in case of unexpected volatility.
Follow Our Tradingview Account for More Technical Analysis Updates, | Like, Share and Comment Your thoughts

BITCOIN PREDICTION: THIS Breaks - and BTC WILL CRASH TO HERE!!!!Yello Paradisers! I’m sharing my Bitcoin prediction with you. We’re using technical analysis on TradingView, specifically Elliott Wave theory.
On the ultra-high time frame, we noticed a Shooting star candlestick pattern. We’re analyzing the channel where the zigzag formation is occurring.
We’re also looking at bearish divergence on the ultra-high time frame chart and the zigzag on the high time frame chart. There’s a bullish divergence visible there. The Fibonacci level at $108,000 is also noteworthy, as is the volume, which shows that bears are still in control on the medium timeframe. We’re also analyzing the head and shoulders target plus bearish divergence on the low time frame. On the low time frame, we’re looking at the impulse of the flat C, which is an expanded flat and is currently creating its fourth wave.
Remember, don’t trade without confirmations. Wait for them before creating a trade. Be disciplined, patient, and emotionally controlled. Only trade the highest probability setups with the greatest risk to reward ratio. This will ensure that you become a long-term profitable professional trader.
Don't be a gambler. Don't try to get rich quick. Make sure that your trading is professionally based on proper strategies and trade tactics.

BTC/USDT Analysis — First Signs of Buyer Support
Hello everyone! This is the daily market analysis from the CryptoRobotics trading analyst.
Yesterday, Bitcoin experienced another wave of decline but failed to reach the local low. A strong absorption of sell orders occurred, and a local support zone formed at $113,300–$112,700. We currently interpret the resulting volume as being positioned for buying.
We are now waiting for a retest of two local support zones:
$114,500–$114,000 (mirror volume zone)
$113,300–$112,700 (local absorption of selling pressure)
From there, we consider local long entries.
The movement potential is aimed at the next sell zone.
If price drops further and shows no reaction within these zones, it's important to closely monitor the price reaction near the $112,000 level.
Buy Zones:
$114,500–$114,000 (mirror volume zone)
$113,300–$112,700 (local absorption of selling pressure)
$110,000–$107,000 (accumulated volume)
Sell Zones:
$115,000–$116,300 (mirror volume zone)
$117,600–$118,600 (accumulated volume)
This publication is not financial advice.

BITCOIN BUY SCALPBitcoin will be now head to the up side and correct itself a bit as it’s been selling buy now we can expect a short dip to buy

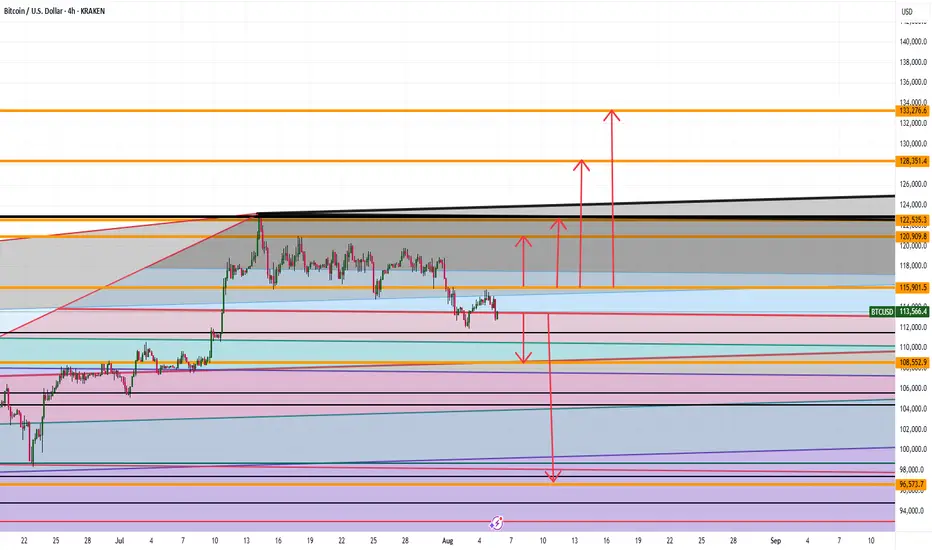
BTC Full Analysis WHERE ARE WE HEADING ???Good afternoon
SO currently with BTC we see the following:
Bullish:
If we can stay and hold above 115,900 then 120K, 122K, 128K and 133K makes sense
BEARISH:
If we close and hold under 113K levels then we can see 108, and 96K levels being hit
What do you think ? Comment Below
Trade Smarter Live Better
Kris
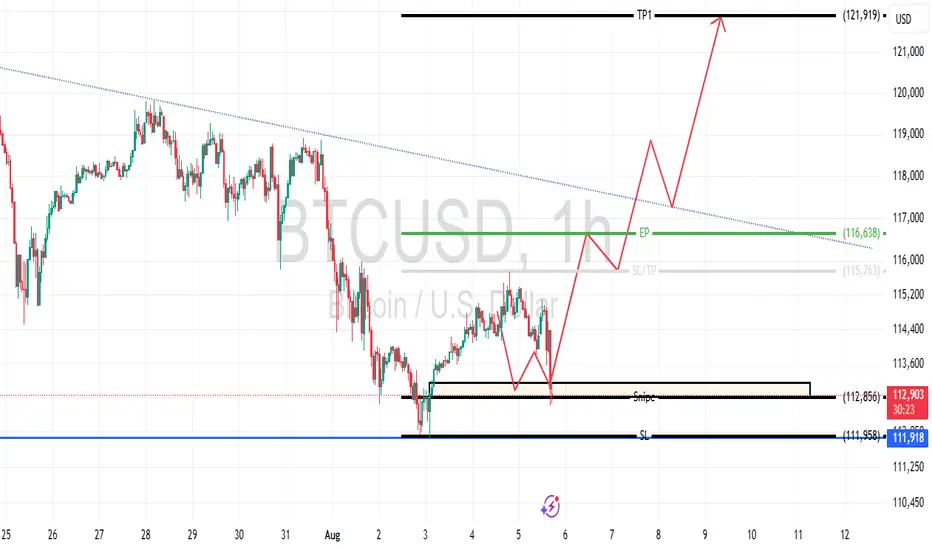
Bitcoin Possible new ATHPrice targets TP1 at $121,919, with an entry point (EP) at $116,638, stop loss (SL) at $111,987, and a support/slip level at $112,856. Expecting a rise from current levels near $113,085, driven by a breakout above the descending trendline.
BTC/USDT Analysis – Reached Resistance
Hello everyone! This is the daily analysis from the CryptoRobotics trading analyst.
Yesterday, Bitcoin reached the resistance zone at $115,000–$116,300 (a mirror volume zone), and we are already seeing a reaction from sellers.
Our primary expectations remain unchanged since yesterday — we anticipate a move back down toward the local low. If there’s no reaction at that level, we could see a further decline toward the next support zone at $110,000–$107,000 (accumulated volume). A shift to a bullish scenario is only possible if strong market buying appears, which would be reflected in a sharp spike in volume and upward positioning.
Buy Zones:
$110,000–$107,000 (accumulated volume)
Sell Zones:
$115,000–$116,300 (mirror volume zone)
$117,600–$118,600 (accumulated volume)
This publication is not financial advice.

Bitcoin near to its PeakDon't repeat your past mistakes . May be last 70/100% move pending before big crash .

BTCUSD Short Setup – 4H Bitcoin has broken below a key dynamic support zone, and current price action signals a potential continuation to the downside. This short entry is supported by multiple technical confluences:
🔻 Bearish Confluences:
Fibonacci Retracement Rejection: Price rejected the 61.8% Fib retracement zone near $114,978, confirming a potential local top.
Trend Structure: Clear lower high, lower low structure forming on 4H – momentum favors sellers.
EMA Cloud Pressure: Price is decisively below the multi-band EMA cloud, showing sustained bearish pressure and trend bias.
Volume Profile Gap: Price is entering a low-volume node between $113.8k and $112k, increasing likelihood of a sharp move down.
Bearish Candlestick Pattern: A strong bearish engulfing candle formed after the retracement – a classic reversal confirmation.
🎯 Fibonacci-Based Targets:
TP1 – $11205 (38.2%): Initial demand zone and minor support.
TP2 – $11024 (61.8%): Mid-extension level, aligns with prior consolidation.
TP3 – $10731 (100%): Full measured move target if the downtrend accelerates.
SL: Placed just above the recent swing high at $11678, protecting against false breakouts.
Bitcoin - The cycles are playing out!⚔️Bitcoin ( CRYPTO:BTCUSD ) just repeats another cycle:
🔎Analysis summary:
Following all of the previous all time high breakouts, Bitcoin will now further extend the rally. After some simple calculation, we can see that Bitcoin will rally another +50% in order to reach the overall price target. However there will be volatility along the way so make sure to remain calm.
📝Levels to watch:
$200.000
SwingTraderPhil
SwingTrading.Simplified. | Investing.Simplified. | #LONGTERMVISION

BITCOIN CRASH PREDICTED! HERE’S WHAT HAPPENS NEXT! (scary)Yello Paradisers, Bitcoin crashed exactly as we predicted in the previous videos that it will happen with the highest probability.
In this video I am explaining to you what's gonna happen next.
Head and shoulders, neckline, is be breaking to the downside, we need a clear confirmation of a reclaim Our channel on high timeframe is getting breakout to the downside and confirmation was that a reclaim was already successful.
In this video I'm sharing with you Elliott Way theory on low timeframe and what needs to be done for confirmation perspective in order for us to continue to go to the downside or have a reversal to the upside.
Don't be a gambler. Don't try to get rich quick. Make sure that your trading is professionally based on proper strategies and trade tactics.

Bitcoin Consolidates Below VWAP Amid Structural UncertaintyFenzoFx—Bitcoin’s downtrend eased near the bullish order block but hasn’t entered the zone. It’s currently consolidating around $114,360.0, below the July 14 VWAP.
No clear break of structure has occurred, making long positions risky. Key support lies at $110,650.0, backed by high volume.
Technically, price is expected to enter this zone. If it does, traders should watch for a break of structure on lower time frames like M15. This setup offers a minimum 1:7 risk-to-reward.
If BTC closes below the main support, bearish momentum may continue toward the next order block at $110,120.0.

Analytics: Market Outlook and Predictions
📈 WHAT HAPPENED?
Last week, US President Donald Trump once again "shook up" the financial markets.
The report published by the White House was received positively and contributed to the recovery of the Bitcoin price. But soon after, new import duties were introduced, which changed the short-term trend of the first cryptocurrency to a downward one. Unfortunately, no one is immune to FUD.
The local minimum was recorded at $112,000, after which the price rebounded slightly, but didn’t reach the key zone of $110,000-$107,000 (accumulated volumes).
💼 WHAT WILL HAPPEN: OR NOT?
Currently, buyer activity remains weak, with significant volumes concentrated above the current price, and no active demand at the local lows. Another wave of sales is likely from the $115,000-$116,300 zone to the formed low of $112,000.
On the other hand, wave analysis shows the weakening of sellers. The market has already absorbed the last wave of sales, and there was a break on the hourly timeframe. With the growth of buying volumes, a rebound to the nearest volume resistance is possible. However, we’ll most likely not be able to do without strong sales, and we’re highly likely to see Bitcoin at $110,000.
Buy Zones:
$110,000–$107,000 (accumulated volume)
Sell Zones:
$117,600–$118,600 (accumulated volume)
$115,000–$116,300 (mirror volume zone)
📰 IMPORTANT DATES
Macroeconomic events that we’re following this week:
• Tuesday, August 5, 13:45 (UTC) — publication of the business activity index (PMI) in the US services sector for July;
• Tuesday, August 5, 14:00 (UTC) — publication of the US Non-Manufacturing Purchasing Managers' Index (ISM) for July;
• Thursday, August 7, 11:00 (UTC) — announcement of the UK interest rate decision for August;
• August 7, Thursday, 11:30 (UTC) — publication of the Bank of England's letter on UK inflation;
• August 7, Thursday, 12:30 (UTC) — publication of the number of initial jobless claims in the United States for August.
*This post is not a financial recommendation. Make decisions based on your own experience.
#analytics
Bitcoin at Key Support - Watching for Bullish ShiftHello everybody!
Bitcoin has reached a very important demand/support zone between 110,000–112,000.
If this area holds, we could see bullish momentum building on the chart.
Currently, we are waiting for confirmations.
We're watching closely for any change in market structure or a trend shift.
If it happens, we can expect the price to move up to around 118,000.
Manage your risk and trade safe!
BITCOIN Bullish setupBTCUSD bullish setup
Entry - 113090
Stop Loss - 112717
Target - 114260
Risk Reward - 1:3.14

BTC; Heikin Ashi Trade IdeaAfter a correction, price may have a good reaction from first demand area I have marked.
Lower demand zone is even more valid, since we see manipulation and then impulsive move to the oposite side.