Bitcoin trade planGot rejected from 112k , Looking forward to build a short position to 100k as swing short!
Close below 110k and we go short..
Waiting
Let's see how it plays...
Bitcointrading

BTC - Short Plan Update / Reminder Anyone who didn’t take this trade at top entry may enter at the lower level here.
Entry - 110,500-111,000
Stop Loss - 113,000 (High Risk) to 120,000 (Low Risk)
Targets:
1) 81,000
2) 61,000
3) 36,000
4) 9,000
Personally I will time any crypto related trades with this pathway. Everything will drop and rise with bitcoins movement.
Happy trading.
Disclaimer - this is not financial advice and outlines my personal trade plan only

$BTC bounced to the 112K zone as expected, with even a shotCRYPTOCAP:BTC bounced to the 112K zone as expected, with even a shot at 115K possible, but I’m still holding my short from 116K. If we revisit my entry area, I’ll look to add more. For now, I’m staying in the trade and will share updates if anything changes. Targets remain 100K → 95K → 90K.

BTCUSDT - What next ?? We can see a retest of 111k7 level, but bitcoin was not successful in closing above it.
111K7 continues to remain as our area of interest for now. Closing above which we will change bias.
For now bitcoin is still bearish....
Happy Trading!!!

Bitcoin Daily SMA UPDATE
This daily chart uses the SMA, Simple Moving Average
Red = 50, Blue = 100, Green = 128, Yellow = 200
Yesterday, PA broke through the descending line of resistance it had been under since 13 August.
As yet, this does not mean PA will now rise, though on a daily chart, the MACD certainly has the room to move higher, as seen below
However, given where we are in a traditionaly quiet month, I do still see PA sliding down this line in the bear future...testing it as support
This maybe supported by the fact that the shorter term 4 Hour MACD has Crossed Neutral but the Hitogram is showing White bars and not Green. This shows a weakening and the MACD line moving closer to the red signal line.
The Daily RSI is also turning over but remains above its MA for now
So for now, we see PA has broken over the Daily 100 SMA and is testing as support.
Above, we have the 50 at 113300
This could be the next line of resistance if PA rises now.
Should PA turn down now, we have the 100 SMA at 110762.
Below that , the 128 sits at 108194
To remain above that descending trend line, we need to Range in the area we currently are in and stay above that 100SMA at 110K for at least the next 24 hours
If we look at the Bitcoin 4 hour chart, we see this maybe possible
PA sits in a very tight range between the 50 and the 100 4 hour SMA and is currently sitting on the VRVP Point of control ( red dotted line )
This is all support but we have to wait and see if it remains so.
There is Very little action trading right now...we just waiting.

Btc looks bearish Bitcoin bears were successful in forming a new lower high during this small time frame down trend. If we do not close above 110k bitcoin will remain bearish.
Next support :- 105k and 100k

BTC / USDT : Falling wedge breakout confirmedBitcoin (Update)
BTC has confirmed a breakout from the falling wedge pattern. After some consolidation, we anticipate a strong bullish move toward the $124,000 zone.
Keep it on your radar — breakout confirmation is in place, momentum could build quickly. Always manage risk in volatile conditions.

#Bitcoin Bearish Sunday Update: $BTC short taken from 116K,#Bitcoin Bearish Sunday Update:
CRYPTOCAP:BTC short taken from 116K, and now BTC is already trading near 108K. I’m still holding my short position.
First target is 100K, then looking for 95K → 90K.
🔸 Market View:
No matter if BTC pushes into 112K–115K, the structure remains bearish. The CPI data outlook is also bearish for markets, adding more pressure. September will be brutal. Everyone is talking about the CPI data being very bearish, but I believe this is just a sell-the-news event. Be careful — I already told you the market is ready to dump.
🔸 Outlook:
I continue to hold my short from 116K and will update as targets get hit. The bigger picture stays bearish until we see real capitulation in the lower zones.

$BTC: -$4000 in 10min – panic or opportunity?Here's our take:
🔹 Historically, such sharp CRYPTOCAP:BTC drops used to cause -20% to -40% crashes in altcoins.
Now, some alts are holding, others correcting mildly, and a few are even rallying.
🔹 In the last 24 hours, $840M was liquidated.
Roughly 80% were long positions.
Historically, reversals often start after $1.1–1.3B in total liquidations.
🔹 BTC Dominance (BTC.D) and Tether Dominance (USDT.D) are forming readable, consistent patterns.
👉 Current thesis: OKX:BTCUSDT will likely continue its movement inside the falling purple channel.
If price reaches $107–108K, we’ll consider closing our short bot to reassess market conditions.
💬 What’s your perspective? Share below.
______________
◆ Follow us ❤️ for daily crypto insights & updates!
🚀 Don’t miss out on important market moves
🧠 DYOR | This is not financial advice, just thinking out loud.

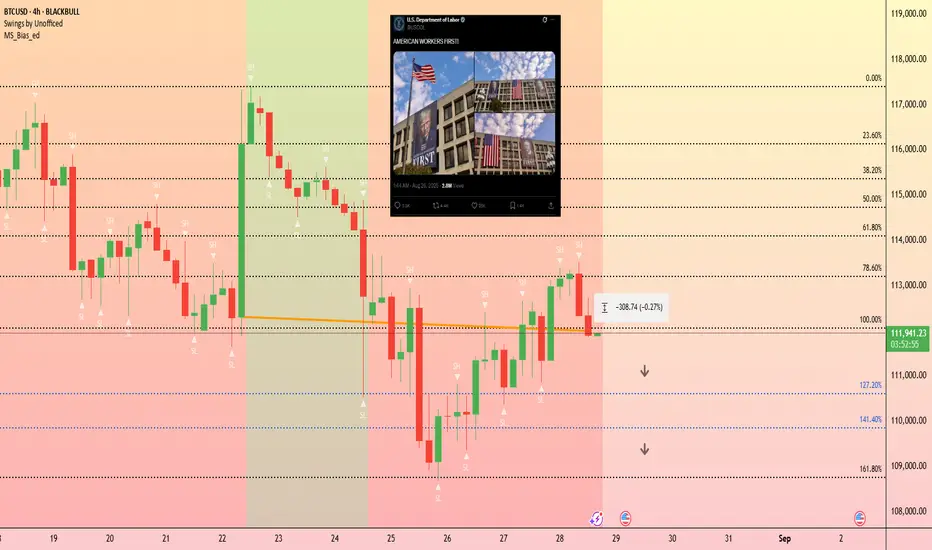
How Potentially Manipulated NFP Data Could Affect BTC's PricBitcoin rallied last Friday after Federal Reserve Chair Jerome Powell's prepped the market for an interest rate cut in September.
However, these gains have faded, with Bitcoin back to where it started last Friday; around $112,000.
The market's focus is now shifting to the upcoming U.S. Non-Farm Payroll (NFP) report, scheduled for release next week, which could greatly influence interest rates expectations.
Strong job data may reduce the likelihood of a September rate cut.
And with an Orwellian portrait of Trump now hanging from the Department of Labor Building, and his administration potentially pressuring the Bureau of Labor Statistics to inflate job numbers, this scenario is becoming a real possibility. If this happens, we could expect price action to test the lower Fibonacci retracement levels, such as the 141.4% at around $109,900 or further at $108,700.
Bearish BTC is coming; Candle confirmation at 110k is neededAfter falling below 110k, I believe BTC is going to have the ''Last Kiss'' scenario to confirm its bearish momentum. While it has come up again towards 110k, I believe it's going to confirm the bearish scenario and goes for 107k, 105k and 103k in a short period. But for a long overview, 95k is probable.

BTC - Short Trade Update - Ready to PlummetWe secured the top entry around 117,000 - successfully snagging that top price.
Currently Bitcoin has fallen below this key trendline channel.
Adjusted trading path possibilities:
Scenario 1:
Short - 110,000 to 34,700-35,000
Long - 35,000 to 82,000
Short - 82,000 to 7,300-9,000
Scenario 2:
Short - 110,000 to 43,000
Long - 43,000 to 74,000
Short - 74,000 to 7,300-9,000
Scenario 3:
Short - 110,000 to 7,300-8,000
Suggestion:
Watch for interactions at these bounce levels, consider hedging with longs at those Long ranges (remain short for main position) on ETH (correspondence with BTC price timing).
Let’s see how this progresses.
All the best.

BITCOINBTC is showing signs of weakness after breaking structure on the daily timeframe. I’m watching for price to retrace into the 4H FVG before continuing lower
This is just my personal view — not financial advice. What do you think? will BTC respect the FVG and drop, or push higher? 🚀📉

Bitcoin ManiaAt these price levels we sit at and the fundamentals, I have to be bullish overall. Although, I have an issue with wanting to call a top/be a contrarian. I see the possibility of a bitcoin top at the 120k and have a tighter band of 115 to 118k to guide me in the short term and at a larger level the 120k to 110k.
Ironically in my view it would be contrarian to be in a long right now, but could be the best trade of the day being at the lower 115k support and possibility of a strong reversal up to 120k.
At the moment, I am out of my "riskier" ETH and ADA longs to see what the market does at this price level. Ready to jump back in for some fun if we can setup with a nice structure.
not financial advice

BTCUSDT SHORT SETUPBitcoin H4 TF Trade Mapping Update
Selling Now On Fair Value Gap Price 115.400
Next Zone Selling CISD PRICE 117.00
Next Selling BTC Zone Order Block 118.00 / 119,300
Manage Trades Properly And Follow For More Charts And Trades

Bitcoin 15-Minute Trade SetupAfter a sharp sell-off from the high of 124,571.2, Bitcoin has been consistently forming a series of lower lows and lower highs, indicating sustained bearish pressure.
Recently, we observed a break of structure (BoS) at 116,72, followed by a corrective pullback on the 15-minute timeframe. This pullback presents a short-term trading opportunity.
Entry: 115,310.9
Stop Loss (SL): 115,000
Target (1:4 RR): 116,551
Interestingly, the 116,551 level also aligns with a potential rejection zone on the 4-hour point of interest (POI), which could reinforce this setup.
Trade Idea:
Looking to take advantage of the pullback for a risk-defined entry with a favorable risk-to-reward ratio. Monitoring how price reacts around the 4H POI will be key in managing this trade.

BTCUSDT H1 MARKET UPDATE A Clear Setup Bearish Signal
Bitcoin Sell From Bearish FVG Box
Bitcoin Sell From Bearish Order Block
Bitcoin Sell From Bearish FVG Box
Bitcoin Sell From Bearish Engulfing
Manage Your Trade Properly Follow Us For More trades

LAUSDT Forming Bullish WaveLAUSDT is currently displaying a bullish wave pattern on the chart, signaling a strong continuation setup that may lead to a significant upside breakout. This wave formation often suggests growing momentum and accumulation, where each successive pullback is followed by a higher low. Combined with strong volume inflows, the technical structure supports a bullish thesis in the short to mid-term.
The price is steadily climbing, forming clear impulsive waves with corrective pullbacks—indicating that buyers are consistently stepping in. This kind of bullish wave pattern, especially when supported by volume and investor activity, often precedes large moves. The current projection shows potential gains of 80% to 90% if price follows through with the wave structure and breaks above key resistance levels.
LAUSDT has started gaining attention among traders due to its technical clarity and well-defined trend behavior. With the crypto market entering a more optimistic phase, setups like this become increasingly reliable. Traders and investors are advised to monitor wave continuation, breakouts above recent highs, and overall volume confirmation to time entries effectively.
✅ Show your support by hitting the like button and
✅ Leaving a comment below! (What is You opinion about this Coin)
Your feedback and engagement keep me inspired to share more insightful market analysis with you!

JUVUSDT UPDATE\#JUV
UPDATE
JUV Technical Setup
Pattern: Bullish Flag
Current Price: \$1.566
Target Price: \$2.40
Target % Gain: 65.88%
Technical Analysis: JUV is forming a bullish flag on the 1D chart after a strong impulsive move, consolidating within a tight range. Price has held above \$1.40 support with increasing bullish momentum, and a breakout above the flag resistance could trigger a sharp rally toward \$2.40.
Time Frame: 1D
Risk Management Tip: Always use proper risk management.

BUY BTCUSD Bitcoin going for a quick scalp and will keep it simple and trade the trend as usual trying to catch the best entries with minimum drawdown

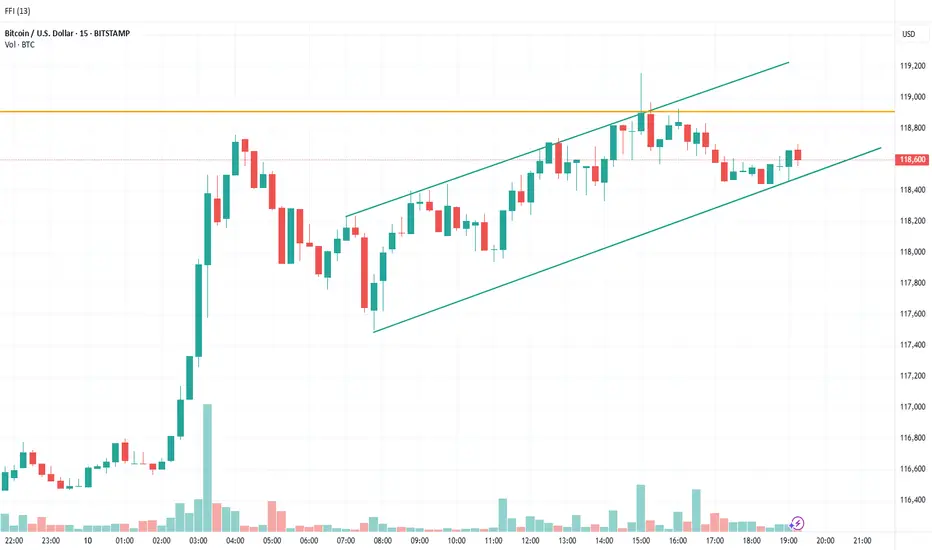
Trading Bitcoin using 15-min TF with 4-hour ConfluenceI am forecasting the price direction for Bitcoin using the price action movement which shed light on the market maker price manipulation and psychology. The current price movement in Bitcoin is bullish and is trading within a upward range on the 15min TF and will confirm the upside to retest the ATH if break above the confluence zone highlighted by the orange color line.
BTC/ USDT DOM.. more downside? This is USDT on the weekly.. as you can see last June and July even before this is a big level of support for USDT DOM.. Wont be surprised for some more down side here for the crypto market. I know its easy to say now after it lost 111k but I just got home and wanted to look deeper into it. Play it level by level obviously.. fib by fib but don't be surprised to see some down side.. Also you're only down if you bough in the last 2 days and that being said don't buy something that ran up to ATH and think its time to buy.. you kinda deserve it.. but lets see what happens. I hope I'm wrong

BTC - Short Trade / Crash Update and DetailsPer my previous post here are the details on my personal trade. Note this is NOT financial advice, and this is my own personal trading plan only. Please use your own judgement.
Entry - 116,300 to 116,600
Stop Loss - 121,800
Target 1 - 95,700
Target 2 - 61,500
Target 3 - 35,000
Target 4 - 8,000
Note that Bitcoin should move up from the 35,000 target to 88,000 making a corrective wave on HTF.
At this point I will post an update and advise my own strategy and if I long 35,000 to 88,000.
Happy trading
