BTC forecast - Two short-term trades!Today we will consider two potential trades that we plan to trade on the BTCUSDT chart.
The logic of the trading situation on the first trade:
The first wave of the Bitcoin price rebound is not yet complete. The price of BTCUSDT is moving in a consolidation wedge. Buyers will try to organize another wave of growth.
Entry - $29341
stop - $29107
TP-1 - $30600
TP-2 - $31750
The logic of the trading situation on the second trade:
The price completed its first wave of growth within the global rebound. However, after the correction, a second wave of growth is expected. Bitcoin price is moving in a wide consolidation channel and we expect a test of the lower trend line of the channel.
Entry - $27455
stop - $26562
TP-1 - $29100
TP-2 IS $31750.
In this case, before entering into a position, we should calculate the probable amount of losses on the stop orders of two positions ahead. And just after that make a decision on how much of the deposit to enter into the trade. Let us remind you that now we trade counter-trend deals, which are more risky than trading along the trend.
Bitcointrading

Bitcoin weekly support and targets !
Bitcoin is sitting on the 31 100$ mark. We are currently bullish and are looking for a breakout of the main resistance at 31 886$.
Lets look at the zone of interest for this week.
Its possible so a retrace the the 3 lower support 30 836$, 28 797$ and 37 136$.
If we Break the around the 32 000$ , we look for bullish action.
Target 1 : 33 831$
Target 2 : 35 535$
Target 3 : 37 861$
Be ready for movement and be careful the market is very volatile these days.
- Frank

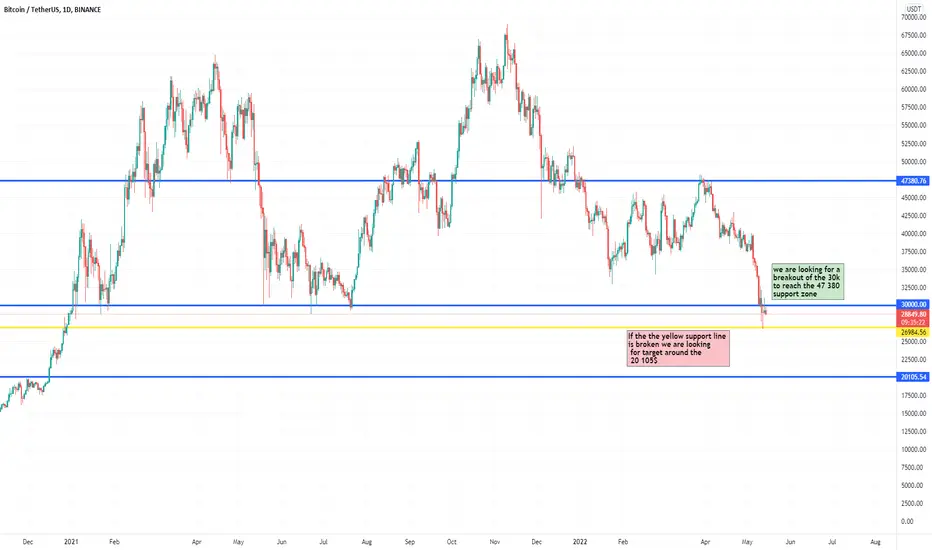
Bitcoin to 20 000$ or 50 000$ ?
We had crazy price action in the past few months and its not over.
We have 3 blue line supports area : 47 380$, 30 000$ and 20 105$. We are near the 30 000$ resistance, if its broken we are bullish and the target is the upper resistance.
If not and the yellow smaller resistance we are bearish until we enter the lower support.
What you believe its going to happen next ? let me know in comment
Enjoy your weekend
- Frank
Bitcoin road to a new high...Hello cryptofolks
Bizzare I dea for Bitcoin here
Will get invalidated if the IHS pattern doesn't come out
Looking for bottom around $19k
-Goodluck
Forza Luna holders

Bitcoin medium term analysisHello
We are watching the Bitcoin bounce from the areas of 26k dollars that I previously identified, and how you see the chart, we have a high probability that the Bitcoin will rise to the areas of 40k dollars in the medium term.

LONG-TERM BITCOIN PROJECTIONHi Guys
We have possibly hit the bottom and here's an idea you may find very interesting that could predict a rough route Bitcoin could take to see new ATH's.
THE LONG ROAD AHEAD
First off the chart: KRAKEN; WEEKLY; BTC vs USDT. The red, yellow and green lines represent areas of support and resistance. The pink dotted line represents a 50% price point between the ATH and the recent low (possibly ATL for 2022). Th blue horizontal Line represents the lowest weekly close since 2021. The White lines represent a price projection.
Unless you've been living under a rock, you would of heard about the Wyckoff Approach, which outlines how massive financial machines buy up or sell off assets.
I found an interesting Reaccumulation Schematic. (See Reaccumulation Schematic 2 in the website bellow)
halotrader.medium.com
This schematic shows very similar price movements (so far) with the weekly price action of bitcoin. Not 100% of course but similar enough to compare.
I traced the exact lines onto the chart and came up with this scenario.
I'm 100% confident the exact lines will NOT be followed but COULD be a helpful guide to judge price direction.
Please Like if you agree and comment with your thoughts.
Many thanks,
Casey
DISCLAIMER: NOT PROFESSIONAL ADVICE.

BITCOIN GOING TO REACH 100000$As per my fibb analsis bitcoin going to reach 10m in few months wait for strong buy

Bitcoin: Hit the Mark! 🎯Wow! We have anticipated this meeting since June 2021: Bitcoin has finally hit our blue trading area, which we generally use to mark long-term entry opportunities in our chart analyses. Now, we expect Bitcoin to dive a bit deeper into the blue trading area between $27816 and $10988 to finish wave v in magenta. Then, it should move upwards again, crossing the supports at $29247 and $32937.

BTC is getting ready to flyif you dont invest now please dont when it hits 60k because then its too late.

BTC Bitcoin: Finding The BottomHello friends, today I am completing a technical analysis on the 1M linear scale chart for Bitcoin (BTCUSD).
Many people are asking me on where I see the Bitcoin price bottoming out before the next possible bull run. In case you still think a bull run is going on, please wake up!
I put together the price along with the RSI, MFI, MACD and Stochastic RSI as well as including in Volume, VPVR and Fibonacci Retracement. Based on my review and analysis, I see price coming down to $3K-$7K range over the next year. The MFI is worth a watch on the monthly chart as the MFI hasn't reached no where near the oversold region, which it has in the past. MACD had a bearish cross in January 2022 which I discussed in a post in February 2022. See below:
In early December 2021, I posted a chart with a "no hopium" discussion around why I think BTC is headed much lower. That was when BTC was over $56K. Since the making of the "No Hopium" Discussion post on December 2, 2021, Bitcoin price is down 45%. In number terms, if you had $100,000 in Bitcoin, you would be down to $55,000. That's a $45,000 loss. Be careful and focus on the charts rather than some of the folks that make stories to earn followers. See below:
This is a monthly chart so be patient and I don't see the next bull run until the end of 2023 into 2024. That's my personal opinion.
What are your opinions on this?
If you enjoy my ideas, feel free to like it and drop in a comment. I love reading your comments below.
Disclosure: This is just my opinion and not any type of financial advice. I enjoy charting and discussing technical analysis. Don't trade based on my advice. Do your own research! #cryptopickk

Will Bitcoin Get to $1 Million?Highlights
There is a -0.70 Pearson Correlation Coefficient between the supply of bitcoin and its price. This negative correlation is more logarithmic than linear. As the supply gets closer to zero the price will rise quicker in raw numbers. This logarithmic relationship extended forwards in time to zero supply gives a Bitcoin price of around $460,000
There is a 0.85 Pearson Correlation Coefficient between the transaction volume of Bitcoin in USD and its price. Showing a strong positive relationship
Transaction Volume in Bitcoin in USD has been largely rising with the price, but the number of transactions has been relatively low in comparison, staying between a range of 200k and 400k in the last 5 years. Suggesting that big players are transacting in larger numbers but the quantity of transactions isn’t rising to the same degree.
Most Americans have heard of Bitcoin, so how much more awareness is there left to drive up demand?
A study found that the main determinant for cryptocurrency prices is the relative cost of production. If the mining cost for Bitcoin rises too high then the upper price estimations will become limited
There is a fundamental problem with the argument that Bitcoin will reach $1 million.
Introduction
There have been many investors, large and small, who have claimed that Bitcoin could hit $1 million per bitcoin Jones, C. (2021). The timelines vary. Some don’t have one and others say in the next couple of years (Cuthbertson, 2022), Kharpal, A. (2021).
In this report, I will be discussing their claims and any merit they may hold. I will attempt to dispute these claims from a fundamental point of view.
Just to point out before I begin, I accidentally deleted all the data that I used for the calculations after I had done the analysis. If you want the analysis and the data - just reply to this post.
Background
The reason some estimate Bitcoin reaching such a high price is the supply is limited. The problem with this argument is, that the supply of everything is limited. Yes, even the US Dollar. The magic money machine is limited. So, for this argument to work the limitations of the supply have to be meaningful. Supply and demand go hand in hand. But I would say, in my opinion, demand is more important than supply. If I create a painting, I then duplicate the painting into ten copies. The supply is ten. But to be frank, who would want to buy a painting that I have drawn? Nobody. So even though the supply is limited the demand is non-existent, so it doesn’t matter. The price of those painting would be determined by the market price. That is the last sold price on the free market. But I haven’t sold any since the demand is zero, so the price is also zero.
Let’s look at it the other way round.
If I don’t create any painting, but the demand for my paintings is extremely high, then the moment I create any painting the price will be very high as well. As I increase the supply, the price should eventually go down. The market's interest is first, in my opinion, that drives prices, second is the supply. Of course, to have a healthy market you need both to be sufficient. Supply on its own means nothing. It just means something exists nothing else. Demand on its means there is interest. So, the potential is there. The moment supply matches the demand that interest turns into something and that something is valuable.
So, the problem I have with this argument is, that the supply of Bitcoin on its own means nothing. Only when combined with demand does the argument have any potential merit. Assuming ceteris paribus, the only three ways the price of Bitcoin could go any higher is if the demand increases with the supply remaining constant. Or the supply falls with the demand remaining constant. Or the demand increases with the supply falling. The supply of Bitcoins is falling right now, it has since the beginning. So, the next thing to establish in this logic is, is the demand increasing, stagnating, or falling? This answer will tell us if the price carries on going up, Ceteris paribus and if that price will reach $1 million.
Before I get to that, just out of interest I thought. Is there a correlation between the supply of Bitcoin and its price? Assuming demand remains stable, let's see if the supply will change the price.
Supply Analysis
I got the monthly close data for the Bitcoin price and the number of Bitcoins in circulation.
The first assumption I had was the total supply of Bitcoin taken away from the total number of bitcoins in circulation is the left-over supply. That is a big assumption, since some long-term investors may not have their Bitcoins in circulation. Also, another problem is that quite a few Bitcoins in circulation may not even be accessible and may have been lost. So, the real leftover supply of Bitcoins would probably be lower than what I had calculated. Regardless this is just a simple analysis to find a correlation so these assumptions in my opinion are not that important. I doubt I would from, let’s say, a strong correlation to a weak one once the assumptions are violated.
The data set was from 2014 to 2022 (finance.yahoo.com. (n.d.). There were in total 91 data values. During a Pearson Correlation, the value was -0.70. This suggests there is somewhat of a strong negative correlation between the leftover supply of Bitcoins and the price. However, there are a few problems. The first and most obvious one is, that this method of analysis assumes there are no other variables involved that, in this case, affect the price. Another problem is correlation doesn’t mean causation. So even though there may be a correlation between the supply and price that doesn’t mean one is affecting the other. This is more pronounced once you realise that the 2017 large price increase in Bitcoin may have been done by market manipulation (Rooney, 2018). The same may be said of the 2021 increase. If these price increases are due to market manipulation or even just a demand increase rather than the supply affecting the price, then the relationship between supply and price maybe even less pronounced than the data suggests. However, the main problem is that even though the correlation coefficient is -0.7. Once you look at both graphs plotted against their time. It doesn’t seem to be a correlation. The supply of bitcoins decreased from a high of 7.6 million in 2014 to a low of 1.97 million in 2022. That’s a -74% decrease. While the Price increased by over 10711% during that time. If we flip the supply data, we see a mere 289% increase. Once we do a scatter plot of the supply vs price, we see that the decrease in supply against price is not very linear. The supply decreases from 7.7 million to 4.8 million and in that time the price rose from $338 to $1071. But after the price rose above $10,000 in 2017 and then went on to $60,000 in 2021. The supply didn’t decrease as much. This decrease seems more logarithmic than linear. The R^2 value was 0.89. If I get the logarithmic line and extend it near zero. So, the supply of Bitcoins left is almost gone. The price of one bitcoin is only around $460,000. So, analysing the relationship between the supply of bitcoins and their price gives us an estimated maximum value of one bitcoin at around $460,000. Not $1 million. I must admit this analysis is very brief and basic, but the main point you should take is, that as the supply dwindles out, the price in raw numbers, would be expected to increase. So, smaller supply decreases will lead to larger price increases as the supply gets closer to zero.
Demand Analysis
Now it's time to analyse the demand for bitcoin and see if it is going up. The main measurement I will use for this is the transaction volume. I will then relate it to price the same way I did for the price. Looking at the transaction volume in USD for Bitcoin, we see that the chart seems quite similar to the price. Once you do a Pearson Correlation the coefficient comes out at 0.85. Suggesting a strong positive correlation between the two. If the transaction volume of Bitcoin increases would that be a strong signal for a price increase? The answer is Yes. However, the number of confirmed transactions per Bitcoin has never topped 1 million. Since 2017, the range has been between 200k - 400k (Blockchain.com, n.d.) Suggesting that the transaction volume increase has been due to larger USD volume and not the number of transactions increasing. This could suggest that people are transacting with bitcoin but just with higher amounts. This could also mean that the interest in bitcoin from a transaction point of view is not exactly going up.
Also, another way to guess the demand for Bitcoin is the number of wallets created. Analysing this measurement, we see that the number of wallets is estimated to be over 100 million. However, the number of active wallets is most likely lower and those wallets that do exist probably do not have that much value. Furthermore, more and more people are becoming aware of bitcoin, but the real interest doesn’t follow suit. 89% of Americans have heard of Bitcoin but that number is not represented in transaction volume or even wallets in existence (Buy Bitcoin Worldwide, n.d.).
To conclude, the transaction volume can be a very good indicator of the future price of bitcoin. However, the real interest in bitcoin isn’t following the awareness and acknowledgement of bitcoin. In my opinion, the average person has heard of bitcoin but doesn’t seem to be interested in working or transacting in bitcoin. This doesn’t much from a price point of view but questions the future usage that many bitcoin investors claim. This would mean the demand is not necessarily going up to a significant degree. Especially to a degree that would allow for $1 million per bitcoin. To explain why this doesn’t mean much from a price point of view, many people think that buying power means the price will go up in a certain asset but that’s not the case. There could be 10,000 buyers in a particular asset and one seller. If the seller has more monetary power, then the price of the asset would most likely go down. So even though the number of people using bitcoin may not reach the level many bitcoin investors want, that doesn’t mean the price won't.
Also, though the the demand for bitcoin does seem to be increasing, it is largely been driven by larger investors who are transacting in very large volumes, hence why the transaction volume in USD I increasing but the number of transactions isn’t too the same degree, this may not be a problem for the price, since the large investors would have big buying power. But these large investors will not be able to manipulate the market since they will most likely be regulated. So the interest from the general public doesn’t seem increasing to the degree bitcoin investors want and even though big investors are getting into bitcoin, I doubt they will be able to pump the price up to $1 million.
Study on what determines cryptocurrency price
One interesting thing to note is, that there was a very good study (Hayes, 2017) investigating what drives the value of a certain cryptocurrency. This study found that the main determinant for prices is the relative cost of production. If the cost of mining bitcoin rises too high, then it will not be profitable for miners to mine and that would increase the transaction cost and time of bitcoin - leading to a price fall. This means to get to $1 million per bitcoin, the transaction costs need to be dramatically reduced for miners. If you do not see that happening, then you also shouldn’t see the price getting to $1 million.
Main Argument
Now to my main argument as to why bitcoin may never get to $1 million per bitcoin.
Let me set the stage, if we have a company that has one million shares to sell at $1. If I buy all the shares the company's market cap is at $1 million, but more importantly I have effectively “pumped” one million dollars into the asset, in this case, the company's shares. Using this logic, we can see why Bitcoin may never get to one million. The current market cap is 619 billion dollars. At 32,546 dollars per Bitcoin (coinmarketcap, 2019). For the price to get to one million the market cap would have to grow by almost 30 times. This means the market would be around 19 trillion. So, using the logic above, for Bitcoin to get to one million there must be almost 18.5 trillion dollars pumped into Bitcoin. A question now arises, is that viable? It took Apple almost 40 years to get to a market cap of just 2.47 trillion. Google, 15 years to get to around 1.5 trillion. The value of all gold ever mined is around 9.6 trillion (www.goldeneaglecoin.com, n.d.). So, to me, the market cap of Bitcoin getting to 19 trillion seems very unlikely, there just isn’t enough interest in the asset to get it there. One may say, well what if it isn’t seen as an asset but rather a currency.
That would mean more people would buy into it to use for transitions, but the problem is if the price keeps rising then the currency applications go down. Why would I sell my bitcoins to buy a car, let's say, if a week later the price of bitcoin may go up 10% next week? The more volatility in bitcoin the less the viability as a currency, the less volatility means the harder it will be for the price to reach one million. So, the argument, that the currency applications will lead to one million is very weak. The logic is also very extremely weak, if the price rises then the currency applications are lowered, so how can one say currency application will lead to a large influx of capital that will drive the price to $1 million.
Conclusion
To conclude, the is a good relationship between the supply of bitcoin, the demand for bitcoin and its price. But even though I do see Bitcoin being a part of our future, these relationships do not point to $1 million per Bitcoin. I would keep an eye on the transaction costs for Bitcoin and how profitable it is for miners to get a good idea of where the market could be heading in the future. Also, I would stay away from the very high and unsubstantiated claim of $1 million per Bitcoin.
References
Cuthbertson, A. (2022). Bitcoin price passing $1 million means society has collapsed, early investor warns. The Independent. Available at: www.independent.co.uk .
Jones, C. (2021). One Analyst Has Bitcoin Reaching $4 Million. Forbes. Available at: www.forbes.com .
Kharpal, A. (2021). Bitcoin at $1 million? Some analysts are bullish but others warn of risks ahead. CNBC. Available at: www.cnbc.com .
finance.yahoo.com. (n.d.). Bitcoin USD (BTC-USD) Price History & Historical Data - Yahoo Finance. Available at: finance.yahoo.com .
Rooney, K. (2018). Much of bitcoin’s 2017 boom was market manipulation, research says. CNBC. Available at: www.cnbc.com .
Blockchain.com (n.d.). n-transactions. Blockchain.com. Available at: www.blockchain.com
Buy Bitcoin Worldwide (n.d.). How Many People Own, Hold & Use Bitcoins? (2022). www.buybitcoinworldwide.com. Available at: www.buybitcoinworldwide.com .
Hayes, A.S. (2017). Cryptocurrency value formation: An empirical study leading to a cost of production model for valuing bitcoin. Telematics and Informatics, 34(7), pp.1308–1321. doi:10.1016/j.tele.2016.05.005.
coinmarketcap (2019). Bitcoin. CoinMarketCap. Available at: coinmarketcap.com
www.goldeneaglecoin.com. (n.d.). Value Of All The Gold In The World | Golden Eagle Coins. Available at: www.goldeneaglecoin.com .

BTCUSD intraday trading & flying to the moon🚀 10 MAY 2022Bitcoin intraday trading alert
3 steps must fulfill before entry
1. 1st breakout done
2. Retracement done
3. 2nd breakout and see you in the sky🚀
Hope you like my Trading Alerts~
Cheers~

BTC Bitcoin: 1D Chart UpdateHello friends, today you can review the technical analysis idea on a 1D linear scale chart for the Bitcoin (BTC).
The chart is self-explanatory. The price has two potentials from the Support and Resistance Trend Line which is in confluence with the VPVR (Volume Profile). Volume overall is low and Ichimoku Cloud shows a red cloud upcoming (resistance). Lastly, zooming out, you can see a Double Top Formation and a Rising Wedge Pattern, which are both bearish. The RSI and Stoch RSI look like they are coming back down. MFI shows money exiting after the recent small pump. The Death Cross (50 simple moving average crossing 200 simple moving average) recently occurred on the 1D timeframe. The $39K-$42K area is a very important area to keep an eye on.
Shown in the chart: Trend line, Relative Strength Index, Stochastic RSI, Money Flow Index, Ichimoku Cloud, Support and Resistance Line, Death Cross, Simple Moving Average, Volume, Volume Profile, Rising Wedge Pattern, Double Top Formation.
If you enjoy my ideas, feel free to like it and drop in a comment. I love reading your comments below.
Disclosure: This is just my opinion and not any type of financial advice. I enjoy charting and discussing technical analysis. Don't trade based on my advice. Do your own research! #cryptopickk

Bitcoin at very important level#Bitcoin as anticipated hit $34k precisely which we have been calling for few days now, when everyone else online was screaming to go long and got trapped in a nasty fake out.
We currently are seeing #btc at 33.5k and is at the most important level in this cycle to determine its next directional flow. A break of $29,990 will most definitely send #bitcoin to 20-16.8k zone. Which is the next Higher TF demand zone.
Always remember, we are doing this completely for free , cause we have your best interest at heart for our fellow crypto investors. We are not “moon boys” or typical crypto influencers who ask you to buy every dip. Nope, We ask you to wait for precise levels and to buy as low as possible. The next buy zone is $20-16.8K, SET YOUR ORDERS AND BE READY.

bulls don't have any power in bitcoinbecause of :
1- FOMC meeting and increasing interest rate
2- bearish trend in 7 month
3- divegence in volume
I believe in a drop in price to AT LEAST 30k .

Bitcoin - what to do after the dump?Bitcoin dumped. What to do now?
I have mentioned it multiple times – the next bull run will be triggered by a new giant downtrend for DXY. But FED increasing the rates is not in our favor… so let’s see the supports below us:
2022 bottom – everyone screamed for bullish December 2021, but we had a red December followed by a small crash in January 2022, causing panic and 10 000$ calls. The current price action has many similarities with January (also after a FED event) and the lows from the year opening are our support now at around 32500$. A must hold level, breaking of which will lead us to the rows below…
2021 bottom – you must remember the June-July 2021 dump after the memecoins season, right? Well, there is still a possibility for a revisit of these lows. They should hold, otherwise Bitcoin will do a test of the previous bull market high at around 20 000$.
Where to flip bullish? Don’t try to catch a falling knife. I will be full bull only when Bitcoin flips all daily moving averages as support (MA50, 100 and 200) + the 21 weekly EMA, also known as the bull market marker.
Trade safe and don’t overleverage!

BTC Perspective analysisNice to meet you, everyone
I'm an alt trader
I'm analyzing and recommending things that are similar to my personality among many alt coins

BITCOIN HOLDING ASCENDING CHANNELAs you can see currently we have held our ascending channel again with another higher low. With the main channel its in (bold white lines) being as small as it is, its giving bitcoin the ability to fully cool off all indicators and oscillators while moving price action upwards still giving a bullish divergence.
As you can see, there another long term trend line i have that we have been finding bottom with too that line stems back from the first candle of the last market cycle that took us from about $153 up to $19,750. Which if you ask me, holding a 7 year old trend line that primarly has been tested a support and also starting the last market cycle bull run. That's a confirmation of a strong bitcoin bull.
Because i have been hearing more talk about this recently...
For all those that think Bitcoin is going to drop down to $28k or even lower than that...
1. HYPOTHETICALLY SPEAKING, to complete a bear flag here (despite all the bullish indications i am about to give) an extrapolated move measured from the $69.9k top down to the wick low of $32.8k , this equates to a move of -51.50%. Which when extrapolated to the recent high of $45k and extended downward would leave us at $23.5k. But for this type of move downward to occur we would be looking at a black swan event that would be like Bitcoin mining being banned in the EU and in the US which would leave miners with very little options on where they can go to mine. But this kind of event could substantiate the extrapolated price movement.
Any other catalysts that are plausible to make a "black swan-like" price movement event would be something that is so detrimental to bitcoin that it would be a "Going to $0" catalyst.
So there is a very small chance if we have one of the few possible scenarios that is a catalyst that creates a market move such as it did from April 2021 though July 2021 when China made its multi-step move to Ban Bitcoin in every way it was able.. THAT COULD PUSH PRICES DOWN AT MAX ANOTHRR 51.5%.
BUT THIS IS STILL HIGHLY UNLIKELY.
We wont be going back to or below $28k because..
2. There is no such technical pattern known as a Triple Bottom, such a pattern would be a double bottom breakout failure into a first re-test. If that re-test is a higher low, you can look for a higher low pattern upward from there. If the re-test in the range of exactly the double bottom (within a few hundered pts) then you would be looking at a very weak bull and has a high probability of dead cat bouncing off then bottom on that third time and then would soon after fail its breakout attempt and it would break.
3. We wont be going back under $28k and that i can say with 99.9% confidence that it wont happen. We would need much more than an exhausted bull to make it happen. We already started creating higher lows starting during out first bottom back in 2021. You can make a trend line actually that would start from the wick low @ $28.5k and then use a second wick low after @ $29.3k. COINCIDENTALLY ENOUGH that same trend line, that would be looking for a 3rd bounce to become a confirmed trend, are one in the same. This would be a third higher low at @ $32.8k wick low and candlebody close @ $35k (.5 fib ext.). A 4TH higher low came with a large single wick down @$34.9k and the candlebody low was @$37.1k.
Even with this most recent drop that ended up breaking above the .55 fib ext level (@$44.6k), we still have bottomed with another higher low. No large wick downs, and candles have been no lower than $37.5k
So, theres a quite obvious trend that is ascending for the lows creating higher lows and the bears have run out of attempts to push us lower.
3a. The third confirmed bottom having that wick down to $32.8k had the significance of that blown up due the bigger significance of the candlebody holding above the .5 fib ext. WHICH IS HUGE! Whenever price action has tested the .618 fib ext and been rejected, it always goes back to test mid-cycle support at the .5 fib ext. If we break below, close below then usually we have out next candle confirm the .5 fib ext as new resistance to continue lower. But when the .5 fib ext holds support especially candlebody support above, and we continue to make higher lows, and higher highs this trend would hold up to the re-test of the .618 fib ext again. Upon this macro retest of the .618 fib ext, 1 of 2 things happen, a. We blast through the .618 resitance (especially if the first macro attempt that we got rejected off DID BREAK this level just did not hold it) or b. We would get rejected a third macro time which would bring an almost certain probability that we would go back to re-test the .382 fib ext level to test support there. Of which this level usually correlates to the .618 fib retracement level.
4. We have multiple major trend lines that have been supporting out higher low moves since our we started, and since our move up from 3800, up $69k, looking at the macro, the overall chart patterns made are symmetrical triangles, ascending triangles, and smaller ascending channels within larger ascending channels.
All of which are within the main overall structure of a bullish ascending traingle that uses the .618 fib ext level as the flat top of resistance. So long as we keep the higher lows on a macro scale.
5. MANY of the Bitcoin On-Chain Data Metrics are showing that bitcoin is primed for a new move to the upside. There are also many chart indicators that have flipped back to bullish at the bottom.
Eventually with all the bullish chart patterns that have been formed, in the middle of forming or are yet to be created, will be coming up to be broken betweem now and the end of 2022
The entire move dowm from $69.9k has been completely manipulated by market makers and FUD from the SEC. But with all the smoke and mirrors, it takes a special eye to see these ikinds of things. But Bitcoin has created one huge bullish divergence into ascending triangle using the .618 fib ext level will be broken and held as support again
All in all,
No, we wont be going back down to $20k or lower,
No we wont be going back down to $28K to bounce a third time.
I see it highly unlikely that we see price action break below $30k.
I see it as unlikely that we are even to break below the .5 fib ext. @ $35k

Bitcoin 113 000 new ATHBINANCE:BTCUSDT
Here is continuation my previews idea (check bellow) about new ATH on Bitcoin price this year or beginning 2023 on regular chart
And LOG scale
What do you think?


bitcoin price predictionjust based off percentages from last year from may on. just adding another perspective. short term bear, mid-long term bull.

One small step for Satoshi, one giant leap for CryptoShort explanation,
Math will never lie unless you can't do math.
This calculation has been going on since the day we started and so far it's perfectly correct.
What I want to share with you is the following: Gold is always 1 and 9 or 4.5. Gold at a top is 9 and thus the end of a bull run. Gold at a bottom is always 1 and therefore the end of a bear run.
Gold between these 2 (top and bottom) is neutral, we continue with the trend or not.
The lines between them are called noise numbers. Here you often lose the most money or as we call it SATS.
The answer should be clear enough. Study the map.
kind regards, the Woelf of crypto street.
Whale you later!

BTCUSD Bullish DiversionYesterday the world was going to collapse
Because Bitcoin had a major pullback.
Today it gives a chance to get in take the bull.
Bullish Divergence on the 1 hour chart makes for some
Interesting opportunities.
