BTCUSD: This isn't the Top by any meansBitcoin remains slightly bearish on its 1D technical outlook (RSI = 41.137, MACD = -3097.700, ADX = 33.471) as even though it appears its trading on a macro bottom, just over the 1W MA50 (1W RSI = 45.068), it hasn't broken out yet. The market undoubtedly took a psychological hit with February's drop but despite the voices calling for a new bear market, we are here to show you why this Cycle hasn't topped yet and is still far from doing so.
This metric measures BTC's temporary stops/ tops during a Bull Cycle. It is a Halving-to-Halving method, starting on the most recent Halving and ending on the next one. Stop 1 is where the starting Halving takes place and the market pulls back. Stop 2 is the next pullback on the 0.236 Time Fibonacci level. The 0.382 Fib prices Stop 3 and basically the Cycle Top. This has been happening on both previous Cycles exactly as described and on the 2012-14 Cycle it just had to be adjusted a little before the 1st Halving due to the Cycle being much shorter since it was the earliest. Nevertheless, it fits the Stop points perfectly.
Note also that distance from the Halving (Stop 1) to Stop 3 has always been 76/78 weeks. This suggests the we can have a new Cycle Top by October 20th 2025 the latest.
## If you like our free content follow our profile to get more daily ideas. ##
## Comments and likes are greatly appreciated. ##
Bitcointrading

Bitcoin Index-3 Strength index. Tells us what ? Bull Or Bear ?This post will include the same chart as a Month, Weekly, Daily and 4 hour
The 3 indicators are
RSI - RSI, or Relative Strength Index, is a momentum oscillator used in technical analysis to identify overbought or oversold conditions in the price
TSI - The True Strength Index indicator is a momentum oscillator designed to detect, confirm or visualize the strength of a trend. - the True Strength Index (TSI) does show trend direction.
ADX - the Average Directional Index (ADX) shows the strength of a market trend, NOT its direction. The base line is 25 - Above is strong trned, below is weaker trend
ADX is Yellow - DI + is orange ( positive price index) - DI - is Red ( Negative price index
MONTHLY
The main chart is the monthly chart - the vertical lines Mark Years
Note how ATH's are all Above the Rising upper trend line.
From the Left,
2013 ATH - Note how RSI and TSI both peaked BEFORE ATH, as did the DI+ on the ADX indicator. The ADX itself turned down Later
2017 ATH saw a similar pattern
2021 was slightly different. RSI and TSI peaked on the March ATH but the true cycle ATH was in Q4 ( Nov) , as are most BTC Cycle ATH - Note the sudden drops in both ( probably due to deleveraged)
The DI+ on the ADX did the same but note how the ADX itself peaked in NOV - The ADX seemingly being more accurate on showing us Cycle Top by Trend.
Currently,
The RSI has not entered Fully OVERBOUGHT as in previous cycles. Has Fallen below Overbought entry line in recent weeks. Maybe leveling out
TSI ( orange) is falling since Jan, showing a bearish trend - Falling towards its own average.. PA has been falling in this time.
ADX has also slowed and flatten out, showing a weakening of trend. NOTE - ADX does not show us Trend direction...So, in recent months, we have seen a DROP in PA.
Weakening of this trend could be pointing towards a reversal ?
Also look at the orange DI+ line in ADX....It is getting Lower on each ATH, harder to move higher as Price increase makes BTC harder to move
THE WEEKLY begins to show us more info
This starts to get interesting here
Note that in 2021, It was as we saw in the monthly Except the ADX fell after the March ATH and did not rise again untill half way through 2021 when the Bear Kicked in Fully. The ADX here is showing the strength of that Bear Market as Luna, FTX and 3 arrows collapsed.
The RSI and TSI remained flat Till Jan 2023, when we saw PA beginning to recover. Notice I said RECOVER. I said it at the time and I say it again..Jan 2023 till September was recovery from avery deep Bear market. This is backed up by the fact that the ADX remained Flat untill Late August 2023. Showed No TREND
Then we saw ADX rise, TSI rise off Neutral and RSI begin to head towards Overbought.
All 3 then Dipped in Mid 2024, Rose again to End of 2024 and since then, we have seen the RSI and TSI drop below their averages, head to Neutral
ADX continied to rise as DI+ Dropped, showing us this was a Bearish Trend after all.
However, since beginning of March, the ADX has been showing a weakening of this trend. Still Bearish as the rise in DI - shows, but it is getting weaker.
DAILY begins to show us what could be heading for a new trend, maybe
BTC PA dropped since Feb as did the RSI and TSI, though they have recently stopped doing that and have tried to bounce but still remain below Neutral.
The reason for this is shown in the ADX that has continued to rise untill March, Keeping that Bearish trend Active and strong. This is confirmed by the DI - ( red ) being above the DI +
Even though this trend has weakened, DI + remains flat showing that a change in trend does not appear to be happening to quickly.
Note how the ADX has turned and is beginning to rise higher as the TSI and RSI flatten out
Hpwever. DI - also remain flat.
Change could be near. It is not happening yet but......
The 4 hour chart is full of Noise but given whet we just seen, it may be relevant to see it
It is Volatile but we can see on BTC PA how PA slowed its drop from March and has ranged with a reducing high Low.
We can see how the RSI and TSI rose, dipped and Rose to their current positions near Neutral.
We can see on the ADX, in the centre , was the Last Bearish push, BTC PA Dropped sharply but the trend weakened quickly. the Bears are getting tired.
We see the attempt by the BULLS around the 11 march to push PA higher.
This failed..but showed us the bulls are still here.
The Fact that the ADX is below the DI lines is a sign that a Trend no longer exists or is very weak
The previous Bearish Trend is possibly exhausted.
We have signs that Price recovery is possible from here though I think we will wait a bit longer before we see it.
My conclusion is that we maybe seeing the beginning of a change , a reversal, but it may take a little while before we see the Fruits fully. Possibly up to 5 - 6 weeks or more.
The shorter term data shows we could make a push to top of range ( or near) but that could get rejected.. We need more strength for the long term
But I suggest you read this, look at these charts and make up your own mind.
Because they are hard to read in many ways, Trends can spring up any time, in any direction.
We can only look at them and think..
I wish you well

BTCUSD: TSI shows that this is the LAST BEST BUYBitcoin is neutral on its 1W technical outlook (RSI = 46.997, MACD = 3171.400, ADX = 55.280) as it found support on the 1W MA50 last 3 weeks and is trying to capitalize on this with a bullish reaction. The rebound is closer than ever and in our opinion based on the True Strength Index (TSI), this may be the last best buy opportunity of this Cycle before it tops. The 1W TSI is now on its long term Buy Zone, last time it was there was on the August 5th 2024 bottom.
The TSI basically marks bottoms and tops on the last 3 Cycles in particular. More specifically, it makes 5 tops in total, every time it approaches 1.00, it is a signal to sell and wait for it to approach -1.00. We are now as mentioned the closest we've been to -1.00 in 7 months and we came here from Top 4. The Cycle technically has one more Top (5) to give so practically the current levels are the last best buy opportunity of the Cycle.
From top-to-bottom, the 2014-2017 Cycle lasted 1470 days, the next one (2018-2021) 1430 days, so if there is a declining rate of 40 days on each passing Cycle, we can start expecting a new Cycle Top by September 2025. The price can be at least 130k be then.
## If you like our free content follow our profile to get more daily ideas. ##
## Comments and likes are greatly appreciated. ##

Bitcoin BEARISH chart - Some reasons to remain AlertAs I have said many times, I always look to Both sides. Bullish and Bearish.
This way, I manage to always know what I am going to do should a Market Direction change.
I got caught out once before..NEVER AGAIN
So, While so many, including Me, look towards Further gains in 2025, there are some indications that A TOP has already been reached.
There is NO guarantee that another will come in.
The First Clue to a change towards BEARISH is in the main chart.
PA got rejected off the very same Trend line that rejected PA in 2017 and 2021, on all occasions, pushing PA into a Bearish Drop.
That alone should make you Think hard.
Next, we have the NUPL chart ( NET UNREALISED~ED PROFIT LOSS )
The Arrow points towards the line, that once crossed has shown us that the high possible Profits available begin to Tempt traders to lock in profit..to SELL.
Once above this line, the next line has NEVER been crossed. ALL profit taking occurs in this Zone. You Will also notice how in 2021, when we had 2 tops, the NUPL reached High, Twice and then fell as traders Took the profits.
We have just had 2 tops and have just dropped out of the profit taking Range.
We may return, we may not. We have to wait but all the while, understanding the more profit taken now, people who buy at current price ranges will have to wait Longer to claim this same level of profit, assuming that the price Rises from here....Or they are in Loss...
The SOPR ( Spent Outpuit Profit Ratio ) , shows us that these profits have been taken
The thing to see here is the level of Selling, or taking of profit. The SOPR line is down near Neutral,
This shows the Selling has Stopped. if we look back at the previous chart, we see that the level of profit is dropping. Less reason to sell....and while PA Drops as it is, there is even more possible LOSS incurred. The people who bought the Top are now getting worried.
Also notice the "labels" Top ( Bearish signals) and Bottom ( Bullish signals)
We had a Bearish warning around 6 weeks before current Top.
The Bullish signal on the bottom line Stopped about 4 weeks ago and you will notice how the "line" has dropped below the neutral line, indicating people accepting Losses, just to get out....
Again, this does not mean we will continue Lower but it is a Loud Warning Bell
Fot the Level pf profit to return, we need one of Two things, or Both, to happen
1) Price to Drop so we can Buy Low and wait for PA to rise again and so make profit
2) Buy now. ( Buy the Dip ) and Wait and Hope the Market goes to the prices some people say will happen ( Some are Stupid for this cycle BTW )
The MVRV chart helps us see where that Market is heading.
MVRV = Market Value to Realized Value. It is an indicator used to assess whether Bitcoin is overvalued or undervalued
I am not going to get to techie here but that yellow line is called Z Score and we are in ATH territory when it is above the green MVRV, as can be seen in the chart
We are currently Dropping FAST and Z Score is very slightly BELOW the MVRV line.
This happened in Summer 2024 and we recovered as you can see.
This Means Bitcoin is becoming Less Overvalued but a Long way from Undervalued
What I see here more than anything is how the recent High was up on that line where the 2021 ATH was rejected from. It was the same level of Value that made people say, "OK, This is great, I am out" and Sell.
Again, understand, the higher the BTC price goes, the heavier it is to move. We may not manage to get a Bitcoin Way up where that 1st 2021 ATH was. Hugely over Valued.
THIS is what I am watching more than anything
So, are we in a Bear Market ?
NO - But it would be easy to fall into a Mini Bear here, or longer one, if the market does not recover by mid June Latest
Why ?
Because, as ever, for me, The weekly MACD is the -- THE thing to watch
If that MACD drops below neutral when it arrives at Neutral, That is a Big red Flag....
But , in an ideal world, we should be able to understand the possibility of that happening BEFORE it does.
The charts above help with that - How mush profit is available, is it being Taken, what potential for more
March as a monthly candle, is very likely to close RED, as mentioned in other posts, It is APRIL that will really decide where we go next. It needs to be GREEN, even if only marginally.
My decision point is if the MVRV continues to Fall past that 236 fib line.....and stays below
Then the MACD and SOPR
If Capitulation begins - I BUY MORE - at the Bottom ( possibly around 65K - But I do not expect hat this year......
Bear Markets are not all bad....................
Have AI sold any Bitcoin Yet ?
NO - thankfully, I still hold enough profit on my earlier buys to cover the smaller losses I may make while I begin to buy again now, which I am doing, in small quanties...Just incase we move higher soon..Because, as I said before, I look to both sides....and I am more Bullish than Bearish right now.....But open to change.
I hope you all understand this logic

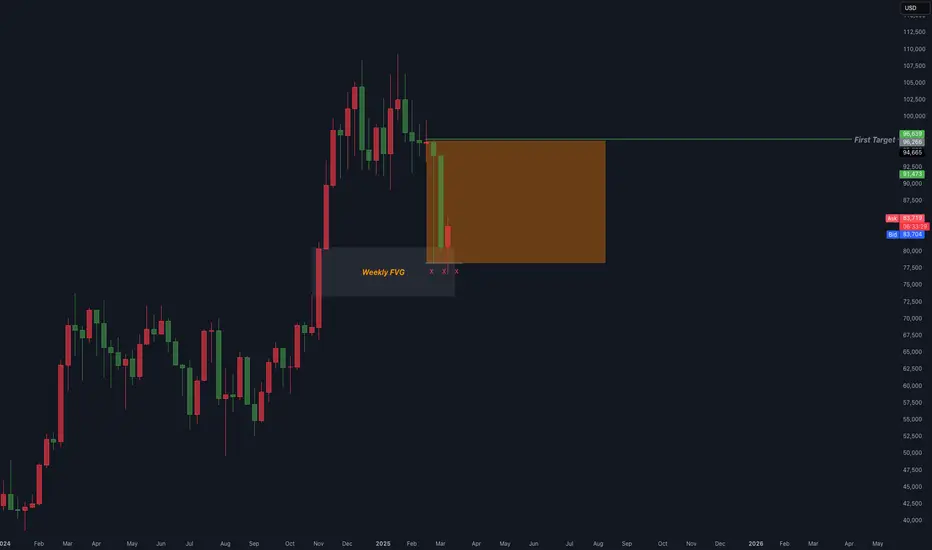
I think there is potential for BTC longs in the week ahead.BTC is at a weekly FVG and has strong BSLQ at the first target, which could push the market to the upside. This is just my humble opinion and not financial advice.
Bitcoin 50 SMA time snaps and Low to ATH since 2014 - UPDATEIn a similar vein to the chart posted earlier today about the patterns between the 50 and 100 SMA, this post is using the 50 SMA ( RED) and the time spent above and below PA.
Alongside this, we have the day counts for PA LOW to PA ATH since 2014
After 2013 ATH and once the 50 SMA dropped below PA, it spent 399 days below PA
After 2017 ATH and once the 50 SMA dropped below PA, it spent 329 days below PA
After 2021 ATH and once the 50 SMA dropped below PA, it spent 420 days below PA - This is an impressive stat as it includes the Deep Bear that we experienced after the Luna, 3 Arrows & FTX crashes, includes the raising of interest rates and the utter presecution by Banks and SEX in the USa.
The fact that the drop below PA was only extended by 35 days ( average) Max shows a strength in Bitcoin sentiment. It could NOT be broken
In 2015, once the 50 SMA has risen above PA, it remained there for 938 days
In 2019, once the 50 SMA has risen above PA, it remained there for 1001 days
In 2023, once the 50 SMA has risen above PA, we have been above for 756 days of an expected average projection of 966 days
This projects that PA will Drop Below the 50 SMA in about October 2015, After the ATH as previously.
This points towards an ATH in Q4 - this has some confluence with the previous post though open to suggestion.
Next is the simple PA LOW to ATH and Back to LOW day counts
2013 ATH to Cycle Low was 665 days then 847 days to Cycle ATH
2017 ATH to Cycle Low was 350 days then 1064 days to Cycle ATH
2021 ATH to Cycle Low was 378 days then, using the average of the two previous day Count from Low to ATH, gives us 952 days to Cycle ATH
This puts an ATH in JUNE 2025 !
I do not think this is realistic in anyway however, Anything is possible currently.
I do however think that June is about when PA could seriously begin to make Moves higher, with intent to reach a Cycle ATH.
The reason being, the weekly MACD will have reached Neutral by then ( if not in mid May )
So while this chart offers some confluence to other ideas, it also offers another ATH date that is way earlier than any previous cycle ATH - While I feel this is unlikely to happen, we Must keep open minds.. the adoption of BTC by main stream now may well accelerate the PA cycle.
We shall wait and find out.
Be prepared for ALL occasions....including the arrival of an early Bear. - THAT will be in another post, at some point soon
Stay safe

BTCUSD: Phase 4 of Bull Cycle just started.Bitcoin is about to turn neutral again on its 1D technical outlook (RSI = 44.562, MACD = -3343.000, ADX = 34.423) as it is making a big 1W comeback on this week's candle following a nearly perfect touch of the 1W MA50. Every test of the 1W MA50, as well as every test of the S1 1W RSI level, has been a straight buy opportunity inside the Bull Cycle's Channel Up since the very begining of the November 2022 bottom.
As first the price action was concentrated on the lower half of the Channel Up (green zone) but since February 2024 it has been primarily on the upper half (blue zone) as the rallies got more aggressive, with the only exceptions being the 1W MA50 tests such as the current one (green Arcs). Every bottom rebound has increased by at least +98.76%, so that gives us a peak estimate of TP = 150,000. An temprary high around 120k and pullback to 100-90k is a possible scenario based on all previous rallies/ Phases. Phase 4, which should technicall be the final of the Bull Cycle, has just started.
## If you like our free content follow our profile to get more daily ideas. ##
## Comments and likes are greatly appreciated. ##

Nifty, BNifty, Stock 1hrs Trade SetupFollow Time frame 1hr, identify candle Hanging man on resistance and Inverted hammer on support, entry after candle closed, and enjoy the profit.. look at setup in picture....

BTCUSD: Last 1W MA50 rebound to the top of the CycleBitcoin remains bearish on its 1D technical outlook (RSI = 40.004, MACD = -3484.800, ADX = 36.461) but today we see the first recovery attempt. The technical reasoning behind it is that the market is testing its 1W MA50 and in due time it will price the new HL of the Bull Cycle and form the bottom that will hold for the rest of the year until the cycle's very top. This is no different than the last two Cycles, the 1W RSI is even rebounding on its S1 level. Based on that pattern we are looking at a potential Cycle peak between 150k - 200k.
## If you like our free content follow our profile to get more daily ideas. ##
## Comments and likes are greatly appreciated. ##

Crypto summit disappoints, Bitcoin teeters on support Bitcoin surged on March 3 after Donald Trump announced a strategic crypto reserve, only to erase gains following erratic tariff announcements the following days.
Friday’s White House crypto summit, expected to be a turning point, fell flat. Trump met with top crypto executives, promising to ease Biden-era regulations, but offered only vague commitments. Instead of rallying, the market has declined further.
A silver lining for Bitcoin came with Friday’s weak jobs report, increasing the likelihood of Federal Reserve intervention. Historically, Bitcoin benefits when interest rates fall. Although this is yet to be reflected in the price.
Technically, BTC/USD is testing the first support on the pitchfork indicator, with the money flow index suggesting no buying pressure at the moment. A drop below Monday’s low of $81,620 could invalidate any bullish outlook.

march rally coming for bitcoin BTCUSD BTC!Bitcoin's price action is also influenced by broader financial cycles and patterns that are more subtle.
Here's a look at those:
General Financial Cycles:
Market Sentiment Cycles:
Like all financial markets, Bitcoin experiences cycles of fear and greed. These psychological waves drive price fluctuations, with periods of euphoria leading to overbought conditions and subsequent corrections.
These cycles are often amplified in the cryptocurrency market due to its 24/7 nature and the prevalence of social media.
Economic Cycles:
Bitcoin's performance can be influenced by macroeconomic trends, such as inflation, interest rates, and global economic growth.
In times of economic uncertainty, some investors may turn to Bitcoin as a hedge against traditional assets. Conversely, during periods of strong economic growth, capital may flow into more traditional investments.
Adoption Cycles:
Bitcoin's adoption by individuals and institutions follows a pattern of gradual growth, punctuated by periods of rapid acceleration.
As adoption increases, liquidity improves, and the market becomes more mature, which can influence price volatility and long-term trends.
"Secret" or Less Obvious Bitcoin Cycles:
On-Chain Data Cycles:
Analysis of Bitcoin's blockchain data reveals patterns in investor behavior, such as accumulation and distribution phases.
Metrics like:
Hodl waves: which track the age of bitcoin held in wallets.
Entity adjusted dormancy: which shows when older coins are being moved.
These can give indications of underlying cycle activity.
Liquidity Cycles:
The flow of liquidity into and out of the Bitcoin market can create its own cycles.
Periods of high liquidity can fuel price increases, while periods of low liquidity can exacerbate price declines.
The availability of stablecoins, and the actions of large market makers, effect these cycles.
Technological Adoption Cycles:
The development and adoption of layer 2 solutions, and other technological improvements to the bitcoin network, can create their own cyclical impacts on the bitcoin price.
These cycles are less predictable, but can have profound long term effects.
It's important to understand that these cycles are interconnected and can overlap, making it challenging to isolate their individual effects. Additionally, the cryptocurrency market is still relatively young, and its cycles may evolve over time.

BTC Bullish Continuation (Another Top OR New Prominent High?)BTC price seems to exhibit signs of overall bullish continuation as the price action may form a credible Higher Low on key Fibonacci and Support levels.
There might be a possibility that BTC may break it's All Time High Price of 109588. It might be worth observing price the action further if 109588 breaks. A potential break may be indicative of another top OR new prominent high (if the range considerably breaks).
Trade Plan :
Entry @ 97389.73
Stop Loss @ 87000
TP 1 @ 107779.46 (Before All Time High)
TP 1.5 - 2 @ 112975 - 118169.19 (After All Time High)
Ride Further with Caution if TP1 hits and move Stop Loss to Break Even if TP1 hits as well.

BTCUSD: Bottom formed. Road to $150k started.Bitcoin has turned neutral on its 1W technical outlook (RSI = 50.811, MACD = -265.000, ADX = 36.155) as it recovered some losses from last week. The most important outcome is that both last week and so far the current one, the 1W candle entered the long term Support Zone comprised of the 1W MA25/MA50 and rebounded over it. This is the Zone that has produced all HL bottoms of the 2 year Channel Up. As the 1W RSI is also about to enter its multiyear Buy Zone, we expect the bottom to be formed within 4-6 weeks max and then start the standard +97.97% rally it printed on all three prior bullish waves. The trade is long, TP = 150,000.
## If you like our free content follow our profile to get more daily ideas. ##
## Comments and likes are greatly appreciated. ##

BTCUSD: Historic comparison shows hyper rally about to begin.Bitcoin turned neutral again on its 1D technical outlook (RSI = 55.581, MACD = 979.600, ADX = 19.348) as it recovered last week's selloff and rebounded on its 1D MA200. Technically the pattern since 2024 is identical to 2020 as you can see on the chart above. The moment Bitcoin crossed again above its 1D MA50, a new hyper rally started. This suggests that a final target inside the 160,000 - 200,000 Zone is quite possible to take place.
## If you like our free content follow our profile to get more daily ideas. ##
## Comments and likes are greatly appreciated. ##

Bitcoin Halving to ATH data -2 year UPDATE-conflicting results
I havw Noticed in recent days, people "Boosting" A chart I posted in Dec 2022, called "BITCOIN Halving cycles and Pump %"
So I thought I would update it and see where we are now.
In it, i said 2024 would be a Good year.
Well, we got that in many ways and not surprisingly but we have seen some things that point towards this being a VERY different cycle and I will explain some of them here
So, as the title suggests, Lets Look at the Halving to ATH - For a start, I need to explain the issue we have with 2021 - 2 major ATH and a divided community about which one was the REAL ATH and so on. There are plenty of reasons to accept the NOV 2021 ATH as the real one, mostly because it was the highest price !
It was also a similar day count from previous Halving to ATH and so I am working with that.
The Current Bitcoin ATH was 280 days after Halving. A Lot Less than any previous day count from Halving to ATH..
We are however, still under the 365 count we had in 2012 Halving to ATH - So...for me, the possibility that we have NOT seen Cycle ATH still exists for many reasons..
And yet, at the same time, I am Very aware that this Cycle has seen accelerated adoption because of ETF's etc,,,,,,so, please Keep an open mind.
Using the day Count system and the Nov 2021 day count, we could expect this Cycle ATH around Oct 2025 - probably safer to say Q4
But how High ?
The % rise from ATH to ATH is an interesting topic here.
2012 to 2017 ATH saw a 1144.6% Rise in PA
2017 to 2021 ATH ( Nov ) saw a 326,3% rise in PA - This is 3.5 X SMALLER than the previous Rise.
Using that 3.5 Smaller calculation, that gives us an % rise of 92.4% and an ATH of around 121K for this cycle. Kind of contradicts expectations and this alone could point towards that fact we may have already be near reacheing cycle Top !
(I have posted a Far more detailed chart about this and will be updating it soon)
BUT, the Crunch comes when we look at the Halving to ATH, as mentioned in the title
I wrote in Dec 2022
2012 Halving 10K% rise after
2016 Halving 3,5K% rise after
2020 Halving 700 % rise after
Projected PA in 2024 /5 would also be 700%
BUT, Bitcoin is far more public now and the Halving Pumps will be talked about aLot. Could the Next halving actually be pumped a Lot earlier than previous dates
We got earlier Pumps due to ETF expectations, as can be seen by how far of the Curve PA rose in 2024 - This has completely changed how strong PA was at Halving and how Much further it could rise.
In facr, if you look back over previous Halvings, PA has been FLAT by comparison.
And so, Since the Bitcoin Halving in March 2024, to the current ATH, we have only seen a 62.8% Rise
If PA Had been on the Curve in the chart at the halving date, we would have seen a 397.8% eise to the current ATH
This Highlights a Massive change in how PA is rising But, at the same time, We would still most likely be in the Range we are now in.
And Lastly, I want to show you this
I mentioned in Dec 2022 how Bitcoin PA could expect a 700% Rise in Price from Halving to cycle ATH
I was WRONG
From Where PA was at Halving to the Expected ATH mark on Rising trend line, it will be 651% rise and around 500K
So, in conclusion, despite a massive change in how PA approached Halving and how Shallow the rise in PA has been compared to previous cycles after Halving, we are Still in a VERY Good place.
However, if you Look at just the ATH to ATH dats calculation, we may already he near TOP....
Take you pick - For Me, I am holding out for Q4 but I have safe guards in place should it turn out we have peaked early.
But do remember, this is a Projection..No guarantees......But we can hope
Stay safe and Love your Neighbour

BITCOIN UPDATE TODAYHere's the latest update on Bitcoin:
Current Price
The current price of Bitcoin is around $83,780.61, with a daily high of $93,721.37 and a daily low of $82,464.84 .
Market Trends
Bitcoin's price surged 10% after President Trump's Crypto Strategic Reserve announcement, with some analysts predicting a potential breakout past $100,000 ². However, others warn that the rally may be temporary due to regulatory hurdles.
Key Levels
- Resistance: $90,000 - $100,000
- Support: $80,000 - $83,000
News
President Trump's executive order established a Crypto Strategic Reserve, which will initially include Bitcoin (BTC), Solana (SOL), Ripple (XRP), and Cardano (ADA) . This move is seen as a positive development for the cryptocurrency market.

THE ROAD TO 68K BTC.P/USDT 4 HOUR In this idea I expand upon my previous idea posted in December on the 8th. The previous idea showed the rudimentary course we would take according to the formation set of Ascending scallops.
In this chart I outline the key supports, resistance, and the projected bottom point we will bounce from to head back up.
Seems we have fallen from a large scale rising wedge and are now inside of descending broadening wedge. This is all in line with my previous idea and is moving as expected. We do not have long to go before we reach our bottom target if we do in fact move as projected.
Only time will tell, Happy Hunting - TND

GST is winding upThis is one of the places you might be able to start stashing little amounts of money and create big wealth with. Not Financial advice.

BITCOIN ($BTC) DIPS TO $82K—FEAR OR FORTUNE?BITCOIN ( CRYPTOCAP:BTC ) DIPS TO GETTEX:82K —FEAR OR FORTUNE?
(1/9)
Good Morning, TradingView! Bitcoin ( CRYPTOCAP:BTC ) slumped to $ 82,000, lowest since Nov ‘24 💰 Market’s glum, let’s unpack this crypto dip! 🌐
(2/9) – PRICE SLIDE
• Drop: $ 82K, 20% off $ 109K high 📊
• Month: Altcoins down 30%+ 💧
• Fear Index: 10/100, rock bottom 😟
CRYPTOCAP:BTC ’s shivering, gloom’s thick!
(3/9) – TECH TELL
• 200-Day MA: $ 81,500, support holds 🌟
• RSI: 28, oversold, bounce hint 🚀
• Past: Aug ‘24 $ 49K to $ 100K 📈
CRYPTOCAP:BTC ’s teetering, rebound or rubble?
(4/9) – MARKET MOOD
• Fear: Lowest since FTX ‘22, $ 16K 🌍
• History: Extreme fear sparks rallies 🌞
• Outflows: $ 1B from ETFs, trade woes 💼
CRYPTOCAP:BTC ’s testing, panic or patience?
(5/9) – RISKS IN PLAY
• Trump: Tariff talk, no crypto juice ⚠️
• Volatility: Bear turn stings 🐻
• Stablecoins: Inflows, sideline cash 🔒
CRYPTOCAP:BTC ’s wobbly, can it dodge the funk?
(6/9) – SWOT: STRENGTHS
• Base: $ 82K holds, tough nut 💪
• Past: Fear flips to gold, $ 100K+ 🏋️
• Liquidity: Central banks ease 🌿
CRYPTOCAP:BTC ’s gritty, battle-tested!
(7/9) – SWOT: WEAKNESSES & OPPORTUNITIES
• Weaknesses: Sentiment sinks 😕
• Opportunities: Fear buys, rate cuts 🌏
Can CRYPTOCAP:BTC vault past the blues?
(8/9) – CRYPTOCAP:BTC ’s $ 82K dip, what’s your take?
1️⃣ Bullish, $ 100K rebound soon 😎
2️⃣ Neutral, Holds, risks linger 🤷
3️⃣ Bearish, $ 70K slide looms 😞
Vote below! 🗳️👇
(9/9) – FINAL TAKEAWAY
CRYPTOCAP:BTC ’s $ 82K slump spooks, fear at 10 🪙 $ 1B ETF outflows sting, but history hints bounce, gem or gloom?

To Thine Own Shoe be True - $BTC's Other Foot is About to FallBitcoin’s Floor Must Be Lower – Chart Physics and Market Psychology at Work
In this video, I explain why Bitcoin has no choice but to find a lower floor, despite many traders believing the worst is behind us. While price is briefly going to appear to confirm support, this is just part of the process before it comes back down and breaks through it on the third test. The real focus here isn’t whether this level holds for another day or two—it’s about why Bitcoin must go lower before it can establish true support.
For a long time, Bitcoin has been floating over clear air with no real structural support. When price climbs too high without building a strong foundation, it eventually has to fall back down to fill the gaps. Right now, the market is in denial, desperately trying to hold Bitcoin in the $90,000 range, but this isn’t about what traders want—it’s about chart physics and liquidity. When there’s nothing left to hold the price up, it must seek a lower equilibrium.
Psychologically, traders don’t want to accept that Bitcoin might have to revisit $70,000 or lower to reset before moving higher. But markets don’t move based on hope—they move based on supply, demand, and liquidity positioning. Right now, there are no meaningful buyers willing to absorb the sell pressure at this level, which means Bitcoin has nowhere to go but down. Once it finally breaks through, it will likely move quickly, as there’s no real support structure beneath it.
Know thy shoe.
The shoe will find the ground.
(My sincerest apologies about the volume ladies and gentlemen. The problem which I thought I had corrected from a prior video still exists in this video. It is an issue I'm hoping Trading View can correct before too long on their end… The problem originated on my end, but there was nothing I can do after it was recorded, and I had to get this video up there - I believe it contains important time sensitive information…
Please try listening with the volume turned all the way up or perhaps with headphones until the problem can be corrected.
My system issue has been corrected for the future, but Trading View if you can, please tweak this on your end and amplify it. This video is extremely worthwhile..)

BTCUSD: These are historically the best conditions to buy.Bitcoin has turned oversold on its 1D technical outlook (RSI = 27.940, MACD = -1745.600, ADX = 37.260) and neutral on its 1W (RSI = 50.407). These are historically the best conditions to buy. Neutral long term, oversold short term. Last time the 1D RSI was oversold was on the August 5th 2024 low, which was the bottom of Bitcoin's prior consolidation phase. At the time, the market was again inside a Channel Down, and the rebound after the August bottom, immediately targeted the 0.786 Fibonacci. Consequently, our first target is the 0.786 Fib at the top of the Channel Down (TP = 102,000) and after it breaks, we expect a rally similar to October-December 2024.
## If you like our free content follow our profile to get more daily ideas. ##
## Comments and likes are greatly appreciated. ##

Actual Bitcoin Cycle!!!This is the possible count for the current BTC cycle; we should see a correction in this zone according to the sub-trend before resuming toward new highs near 142k.

BTCUSD: Is it possible to reach 160k by May?Bitcoin remains neutral on its 1D technical outlook (RSI = 50.148, MACD = -503.300, ADX = 40.137), consolidating under the 1D MA50. This neutral state indicates that it is still a buy opportunity, as long as it stays under the 1D MA50. The similar consolidations (Rectangle patterns) of January 2024 and March 2023 indicate that when the 1D MA50 is reclaimed, Bitcoin gives a bullish breakout signal that targets the 4.0 Fibonacci extension. As you notice, thos phase since November 2022 are cyclical and replicate the price action over and over again. Go long, TP = 160,000 potentiall by end of April beginning of May.
## If you like our free content follow our profile to get more daily ideas. ##
## Comments and likes are greatly appreciated. ##
