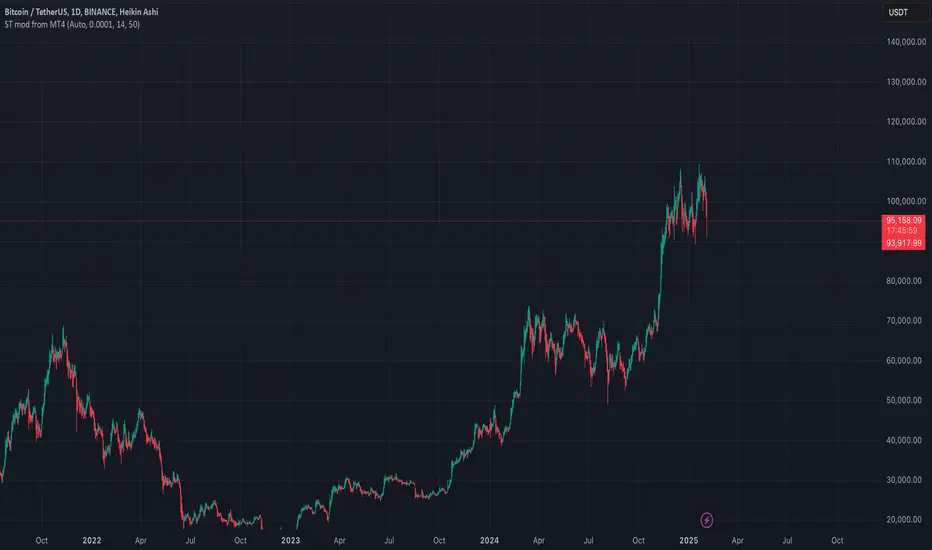
BTCUSDT BUYING SETUP IN 4-H TAHello Guys Here Is Chart Of BTCUSD
Support: Around 94300 - 94000
Target: 98500
Resistance: Around 98600 - 99000
This setup indicates potential bullish momentum, provided Bitcoin successfully holds the support level and breaks above the resistance.
Bitcointrading

BTCUSD: The magic of the .618 Fib signals $165k.Bitcoin is about to turn neutral again on its 1D technical outlook (RSI = 44.436, MACD = -739.700, ADX = 52.589) in an attempt to form a new bottom for February on its 2 month consolidation phase. This consolidation phase is technically no different than all others since the 2023 Bull Cycle started. We have had three such consolidation phases, two longer, one shorter but all started after market tops on a +1.0 Fibonacci progression: 1st on the 1.618 Fib, then on the 2.618, the 3.618, which brings us to the current ATH on the 4.618 Fibonacci extension. Technically the next one should be on the 5.618 Fib (TP = 165,000) then only thing that's open is whether it will follow the 2023 longer consolidation or 2024 shorter. If it follows the longer, then the 165k target may coincide with the Cycle Top towards September.
## If you like our free content follow our profile to get more daily ideas. ##
## Comments and likes are greatly appreciated. ##

BTCUSD: Crossing of 4H MA100 brings enormous rally.Bitcoin has turned neutral on its 1D technical outlook (RSI = 50.096, MACD = -559.600, ADX = 41.025) as it is rising aggressively today and just hit the 1D MA50. This is its major Resistance level, which when crossed has caused the two main rallies of 2025 so far. The first (Dec 30th-Jan 7th) crossed the 0.618 Fibonacci before pulling back, while the second (Jan 9th-Jan 20th) made a full +20% rally. As you realize, if we do get a 1D candle close over the 1D MA50, the target for the modest scenario of Fib 0.618 is TP1 = 103,500 and if it continues (which as some point it will since the Bull Cycle has at least another 6-9 months more) for the good case scenario of +20%, the target will be TP2 = 113,000.
See how our prior idea has worked out:
## If you like our free content follow our profile to get more daily ideas. ##
## Comments and likes are greatly appreciated. ##

BTCUSDT Trade LogBTCUSDT – Bullish Breakout in Sight! 🚀
Market Vibes: With US equities and XAU (Gold) on the rise, BTC sentiment is looking strong too! Price action is channeling, but these dips show buyers stepping in. That’s a big confidence booster for me to ride this wave up. 🔥
Long Setup:
• Entry: Look to buy on any minor pullback or a break above the current 1H Kijun zone.
• Stop Loss: Place just below the channel support (risk 1% of account).
• Target: Eye a 1:2 or 1:3 RRR toward the next supply zone.
Confidence Boosters:
• Equities rallying? Check! ✅
• Gold pumping? Check! ✅
• BTC channel support holding strong? Check! ✅
Let’s see if this bullish momentum can keep pushing us higher! Keep an eye out for volatility around any macro news—stay safe and trade well. 🤞🔥

BTCUSD: 4H Bull Flag targeting 103,000Bitcoin is neutral on its 1D technical outlook (RSI = 44.119, MACD = -816.800, ADX = 35.629) as it may have reached the 4H MA50 today but remains ranged inside a Channel Down since February 4th. According to the 4H RSI, this is technically a Bull Flag pattern like the one on Dec 26th-30th that was also formed during a 4H Death Cross. The Bull Flag bottomed and rebounded to the 1.382 Fibonacci extension. We can be bullish (TP = 103,000) at least on the short term.
## If you like our free content follow our profile to get more daily ideas. ##
## Comments and likes are greatly appreciated. ##

Bearish Movement for London Session Then HUGE Retest 100KWe should see an impulse move down during the London session, then a large reversal that will start the wave to 100k levels throughout this next week. BITSTAMP:BTCUSD BINANCE:BTCUSDT COINBASE:BTCUSD

$30,000 drop or $30,000 rise ?!!!This wedge can change the market outcome. If Bitcoin cannot break this wedge from above, we will see a $30k price drop. If the price breaks this wedge from above, we will see a $30k price increase. Now that most traders are disheartened by the crypto market and are selling their assets cheaply, I suspect that the price will go up.
Give me some energy !!
✨We spend hours finding potential opportunities and writing useful ideas, we would be happy if you support us.
Best regards CobraVanguard.💚
_ _ _ _ __ _ _ _ _ _ _ _ _ _ _ _ _ _ _ _ _ _ _ _ _ _ _ _ _ _ _ _
✅Thank you, and for more ideas, hit ❤️Like❤️ and 🌟Follow🌟!
⚠️Things can change...
The markets are always changing and even with all these signals, the market changes tend to be strong and fast!!

BTCUSD: Falling Wedge close to breaking to $105.5kBitcoin is marginally bearish on its 1D technical outlook (RSI = 44.917, MACD = -782.200, ADX = 41.331) but neutral on both 1H and 4H, as it is close to conclude a Falling Wedge. Today the price held the 1H MA50 for the first time after a test of the pattern's top, which increases the chances of a bullish break out. Buy only if the break out happens and target the 2.0 Fibonacci extension (TP = 105,500), which happens to be just under the R1 level.
## If you like our free content follow our profile to get more daily ideas. ##
## Comments and likes are greatly appreciated. ##

Bitcoin(BTC/USD) Daily Chart Analysis For Week of Feb 7, 2025Technical Analysis and Outlook:
On Monday, during the current week’s trading session, Bitcoin reached the Mean Support level of 91800 and consistently hit the targeted Outer Coin Dip at 96000. This development indicates a likely pullback to retest the Mean Support level of 91800, with the possibility of further decline down to the Outer Coin Dip located at 89000 before a potential resurgence in the bull market.
Conversely, the anticipated pullback does not materialize. In that case, the cryptocurrency may experience upward momentum, retesting the Key Resistance level at 106000 and potentially extending to challenge the completed Outer Coin Rally at 108000 and beyond.

BTCUSD: Is it about to explode while the Dollar tanks?Bitcoin remains bullish on its 1W technical outlook (RSI = 62.733, MACD = 8478.500, ADX = 61.463) but neutral on 1D, which suggests that it is a buy opportunity long term. What can really help the price explode from this point onwards though, is a strong drop on the DXY, which has already shown signs of peaking. Based on the last 2 Cycles, it is out of the Accumulation Phase and is has completed the fake-out, which traps investors into thinking that higher prices are coming. This is where a bearish reversal has taken place in the past, lasting 399 days until its bottom, which is where BTC tops. Get ready for a full 2025 Bitcoin rally.
## If you like our free content follow our profile to get more daily ideas. ##
## Comments and likes are greatly appreciated. ##

BITCOIN: Pattern gets repeated again and again and again.Bitcoin is on the most desirable buy levels long term as apart from only being neutral on its 1D technical outlook (RSI = 47.257, MACD = 281.800, ADX = 29.399) it just validated today the enormous buying zone that was waiting on the 1D MA100. This is a level that has worked as a buy entry over and over again these 2 years of the Bull Cycle. The last time it did was exactly a year ago on January 22nd 2024. The result was a +90% rally. If this gets repeated again the exact same way, then a new ATH at 170,000 is more than plausible.
## If you like our free content follow our profile to get more daily ideas. ##
## Comments and likes are greatly appreciated. ##

ShortYeah, it's pretty wild how quickly narratives shift, isn't it? A lot of these analysts seem to latch onto whatever fits their current agenda or the latest trend, and it's often the same people with different predictions based on the same factors. Like, one minute it's all about Trump's influence sending Bitcoin to the moon, and the next it's about geopolitics making a radical change in the market.
It seems like people can’t resist connecting anything and everything to Bitcoin’s price. It's like trying to predict weather patterns based on random social events.
It’s clear that a correction is overdue, and as usual, retail investors are going to jump in near the top, hoping to catch the momentum. But when the market starts to pull back, they’ll get stuck holding the bag as prices drop. The more they buy now, the more likely it is that the market will keep falling.
We warned you in the previous post about the crash, BitcoinDo you remember the last post where we warned you about the upcoming crash?
Today, reality has become even harsher.. Bitcoin has crashed below $100, and Tram Coin has plummeted into oblivion!
🔥 Unfortunately.. for those who didn’t read the previous post:
It was the golden opportunity to exit before the disaster..
Now.. regret and loss for those who ignored the warnings!
💡 If you want to know how low Bitcoin will go.. read the previous post!
And if you don’t want the market to crash on you.. hit follow so you don’t miss any important warnings or analysis!
💔 The fear of loss is worse than the loss itself..
Don’t let procrastination or neglect make you a victim..
Follow the analysis and always be prepared for any scenario!
📉 The market shows no mercy..
So, are you ready for the next move?
This is the post I warned you from.. If you were following me and read it, you wouldn’t have lost!

BTCUSD: Repeating the late 2024 bullish pattern to 150,000Bitcoin turned bullish on its 1D technical outlook (RSI = 59.434, MACD = 1198.600, ADX = 26.499) as it found support on the 1D MA50 and is rebounding. The emerging pattern is a Channel Up and coming off an Arc consolidation in December, it draws strong comparisons with the price action after August 2024. The 1D MACD shows that once BTC rebounded on the 1D MA50 (October 10th 2024), the indicator formed a Bullish Cross, which is exactly what is happening now. This paved the way for the parabolic rally that peaked near the 3.5 Fibonacci extension. That shows that this is the time to engage in a confirmed long position again and target at least the 3.0 Fibonacci extension (TP = 150,000).
## If you like our free content follow our profile to get more daily ideas. ##
## Comments and likes are greatly appreciated. ##

BTC / USDT:Approaching trendline resistance - A breakout ahead ?BTC/USDT: Approaching Trendline Resistance – A Breakout in Sight?
BTC/USDT is gearing up for a potential breakout 📈 as it approaches a key trendline resistance level 📊. The price has been consolidating, forming a strong setup for an explosive move 💥. If Bitcoin manages to break above this resistance, we could witness a significant bullish rally 🚀. Stay alert and wait for confirmation before making a move.
Key Insights:
1️⃣ Trendline Resistance: BTC/USDT is nearing a crucial trendline that has acted as a barrier in previous attempts. A successful breakout could mark the beginning of a strong uptrend.
2️⃣ Volume Surge: Watch for a noticeable increase in trading volume during the breakout, signaling strong buying momentum 🔥.
3️⃣ Bullish Indicators: RSI and MACD are showing bullish momentum ⚡, supporting the case for a breakout.
Steps to Confirm the Breakout:
✅ Look for a 4H or daily candle closing decisively above the trendline.
✅ A volume spike during the breakout will confirm strong buyer interest.
✅ A retest of the broken trendline as new support strengthens the breakout.
⚠️ Beware of fake breakouts—sharp rejections or wicks above the resistance level can indicate weakness.
Risk Management Strategies:
🔒 Use stop-loss orders to manage risk effectively.
🎯 Ensure position sizing aligns with your overall trading strategy.
This analysis is for educational purposes only and not financial advice. Always DYOR 🔍 before making investment decisions. Stay ready for the next big move!

Bitcoin is still BullishPrice of Bitcoin still expected to break 1,09000$ mark and go above and make a new ATH.

BTCUSDT Long SignalHello everyone i want to share my swing signal at bitcoin.
i am only using price action + Fibonacci for tools.
Open long position at 105580
Stop loss 104780
Take profit, first profit at 110000 and then i will close half of my position and ill let price action to hit at 11500.

Bitcoin and green November? BINANCE:BTCUSDT
✅Before we start to discuss, I would be glad if you share your opinion on this post's comment section and hit the like button if you enjoyed it.
Thank you.
Bitcoin made retested downtrend line on D1. According to my "Take profit" indicator we bounced at real value price in June. Usually when we touch this line we going to test take profit line on D1 timeframe. Marked this zone on a chart. Also my indicator "Direction" showed signal to buy, so now im waiting Bitcoin around 25-29K in this range and signals to take profit on this both indicators and others.
Possible Targets
➡️After retest trend line and fundamental value line - 25000 - 29000
➡️When we touch take profit line in this ill looking to open local short
➡️Watching on FOMC rate at the beginning November and continuation local uptrend.
In December Ill expect test 20K again
Hope you enjoyed the content I created, You can support with your likes and comments this idea so more people can watch!
✅Disclaimer: Please be aware of the risks involved in trading. This idea was made for educational purposes only not for financial Investment Purposes.
* Look at my ideas about interesting altcoins in the related section down below ↓
* For more ideas please hit "Like" and "Follow"!

BITCOIN: Just bounced on the former 4 year Resistance.Bitcoin is staging an incredible rebound on the nearly 4 year HH Resistance Zone, while being on a bullish 1D technical outlook (RSI = 61.575, MACD = 1366.600, ADX = 28.907) and a borderline overbought 1W, which really sets the tone for the rest of the bull market. This turns the former Resistance Zone into a Support, as this is the first test and bounce since it broke in November after the U.S. elections.
Symmetrically, the rally since August 5th 2024 looks like the rejection since November 8th 2021. Like the rejection reached the 2.0 Fibonacci extension, we expect the current bullish wave to do the same thing. A TP = 200,000 can be easily achieved under these conditions.
See how our prior idea has worked out:
## If you like our free content follow our profile to get more daily ideas. ##
## Comments and likes are greatly appreciated. ##

Next target for Bitcoin BTC price is $110k but there is a nuanceCRYPTOCAP:BTC price has reached $90000 - this is something incredible, considering that just 8 years ago we were trading #BTCUSD for $900) X100 is easy money if you save it)
And the coolest thing is that this is just the beginning)
However, no one on our planet has yet canceled the effect of gravity so everything that takes off will be attracted to the ground
OKX:BTCUSDT price needs a correction, at least to $77-78k. And even more so, this correction is needed for altcoins, so that the “fresh” capital that entered the cryptocurrency market through #Bitcoin CRYPTOCAP:ETH CRYPTOCAP:SOL CRYPTOCAP:DOGE CRYPTOCAP:TON can flow into low-cap #Altcoins
It may hurt a little at first, but it will be pleasant later
Use the correction period to monitor altcoins very closely to determine which ones are being redeemed, where there is strength and support, and the greatest chance of further growth
Or follow us, we regularly give tips;)

BITCOINUSD TECHANICALL ANALYSIS FOR H1 (READ CAOTION)hello trader's. what do you think about bitcoinusd
current price: 105000
Today BitcoinUSD Just Touch The Last High Area 105700 We See Some Retestmint in BitcoinUSD it can be good Retest in BitcoinUSD Now we Have H1 Channel Pattern So bitcoinusd going to toching Resistance zone 106500 then bitcoinusd Fall Down side to Support 101500 then expected 97500
support 95500.94500
resistance zone. 10580o . 107000
please like comment and follow

Bitcoin - Weekly Forecast - Technical Analysis & Trading IdeasMidterm forecast:
73777.00 is a major support, while this level is not broken, the Midterm wave will be uptrend.
Technical analysis:
A trough is formed in daily chart at 88963.75 on 01/13/2025, so more gains to resistance(s) 102643.85, 108293.92, 110000.00 and more heights is expected.
Take Profits:
99607.07
102643.85
108293.92
110000.00
115000.00
118110.67
120000.00
125000.00
130000.00
134142.91
Total Profit: 5567500 point (55%)
Closed trade(s): 506200 point Profit
Open trade(s): 5061300 point Profit
Trade Setup:
We opened 11 BUY trades @ 94545.07 based on 'Hammer' entry method at 2025-01-13.
Closed Profit:
TP1 @ 99607.07 touched at 2025-01-15 with 506200 point Profit. (5%)
Open Profit:
Profit for one BUY trade is 99606.37(current price) - 94545.07(open price) = 506130 point (5%)
10 trade(s) still open, therefore total profit for open trade(s) is 506130 (5%) x 10 = 5061300 point (50%)

BTCUSD: This is a consolidation and we've seen it before.Bitcoin is neutral on its 1D technical outlook (RSI = 51.151, MACD = -617.400, ADX = 24.376) as it hasn't escaped the right range it's been trading in since late December. The 1W MACD has converged but hasn't made the Cross yet and as long as it doesn't, based on the time cycles, this is most likely a short consolidation that has happened almost exactly during the same time both in January 2024 and 2023. When the 1W MACD made the Bearish Cross, we had the long consolidation phases. By next week we should see this consolidation break to the upside. Our target is the same with the early 2024 breakout, a +195% rise from the bottom (TP = 150,000).
## If you like our free content follow our profile to get more daily ideas. ##
## Comments and likes are greatly appreciated. ##
