BTC - Key insight you must pay Attention to!📊 This is a weekly Bitcoin chart with a key insight you should pay close attention to:
In a bullish trend, you’ll always notice higher highs being formed. Once price breaks the previous high, it's typically a strong confirmation of bullish continuation, as shown by the BOS (Break of Structure) levels marked in blue on the chart.
🔻 The BOS level must not be broken to the downside — if that happens, it signals a trend reversal from bullish to bearish, just like what occurred at the red zone I highlighted.
✅ Currently, Bitcoin has broken its previous high to the upside, which indicates the bullish trend is continuing.
🎯 Next target: $150K.
⚠️ However, if BTC pulls back for a retest and fails to bounce quickly, it will be considered a strong sell signal. That would likely lead to a correction back down toward the $80K zone.
Best regards:
Ceciliones🎯
Bitcoinusd

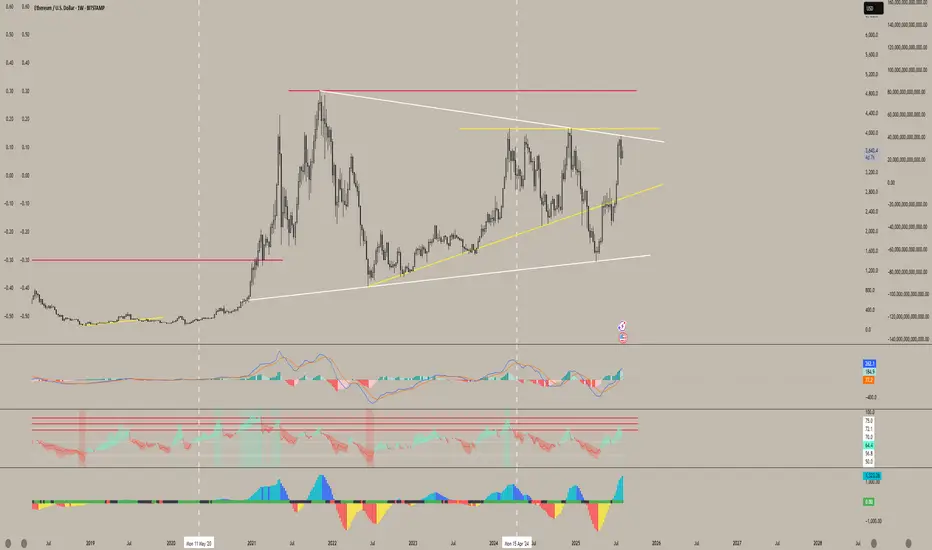
ETH is knocking like Walter White on that $4K levelOnce we break past this point, there’s little to no resistance-we should all be expecting an all-time high. Altcoins are going to melt people’s faces off when we break past $4K. With rate cuts anticipated, don’t miss out on this move.
ETH is holding extremely strong right now in relation to BTC, while other altcoins are still seeking their lows for this cycle. With rate cuts expected in September, ETF flows, and growing institutional interest, I believe ETH will have a crazy rally.
Once we break past this resistance from the trendline dating back to the 2021 high and close above $4K, I think we’ll start to see ETH blow past Bitcoin-and altcoins will follow.
I still believe ETH will outperform others for now, but once we get those rate cuts, I feel the bleeding will stop-and by then, the ship will have sailed.
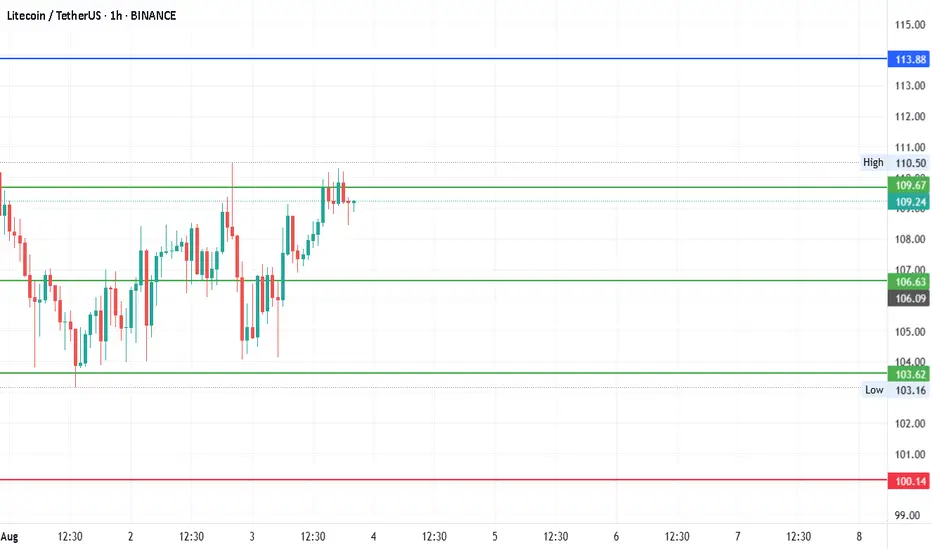
#LTCUSDTDate: 03-08-2025
#LTCUSDT - Current Price: 109
#LTCUSDT Pivot Point: 107 Support: 104 Resistance: 110
#LTCUSDT Upside Targets:
Target 1: 113
Target 2: 117
Target 3: 120
Target 4: 124
#LTCUSDT Downside Targets:
Target 1: 100
Target 2: 97
Target 3: 93
Target 4: 89
#Crypto #Bitcoin #BTC #CryptoTA #TradingView #PivotPoints #SupportResistance
#TradingView #Nifty #BankNifty #DJI #NDQ #SENSEX #DAX #USOIL #GOLD #SILVER
#BHEL #HUDCO #LT #LTF #ABB #DIXON #SIEMENS #BALKRISIND #MRF #DIVISLAB
#MARUTI #HAL #SHREECEM #JSWSTEEL #MPHASIS #NATIONALUM #BALRAMCHIN #TRIVENI
#USDINR #EURUSD #USDJPY #NIFTY_MID_SELECT
#SOLANA #ETHEREUM #BTCUSD #MATICUSDT #XRPUSDT #LTCUSDT
NASDAQ Week 32 OutlookOn the US Nas 100 1-hour chart, a bearish breakout from a symmetrical triangle suggests downward momentum. The Fair Value Gap at 23,500.0 is a pivotal level—watch for a breakout and retest here to confirm sell entries. Aim for the target at 22681.1, with a stop-loss at 23,740.4 to protect against adverse moves.

Let's learn & Apply Elliott Wave Rules on chart: BTCUSD BitcoinHello Friends,
Welcome to RK_Chaarts,
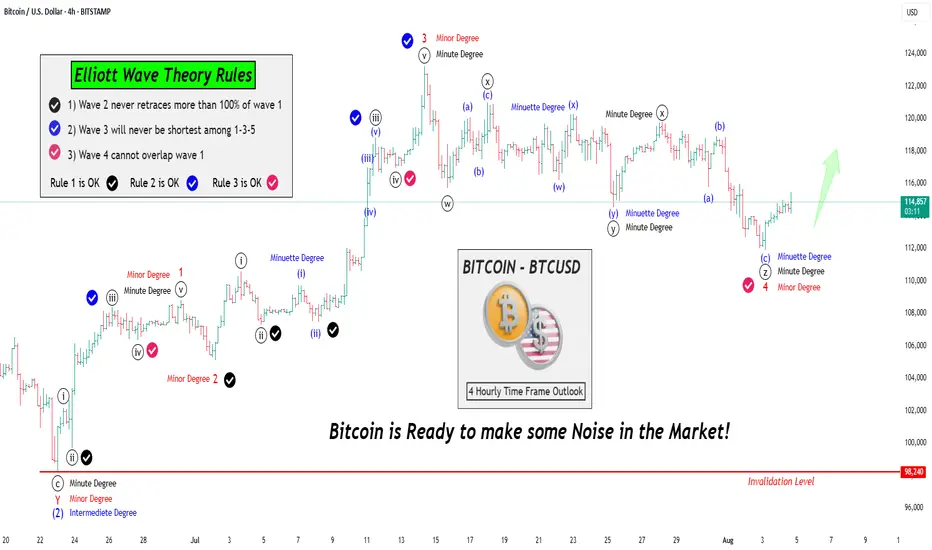
Friends, Today we are going to learn 3 Rules of the Elliott Wave theory, there are three principles and some patterns. Impulses move in a 1-2-3-4-5 pattern, either as an impulse or a motive wave. However, within impulses, there are three rules:
Rule No 1:
Wave 2 will never retrace more than 100% of Wave 1.
Rule No 2:
Wave 3 will never be the shortest among Waves 1, 3, and 5; it can be the largest, but never the smallest.
Rule No 3:
Wave 4 cannot overlap Wave 1, except in diagonals or triangles; in impulses, it cannot overlap.
We've checked these three rules and marked them with separate tick marks on the chart with different colors, making them clearly visible. You can review the chart and verify these rules yourself, learning how wave principles are applied and checked.
We've explained all this through a drawing on the chart, so we won't elaborate further here. Moving forward, let's analyze what the wave theory suggests about the current market trend. This entire analysis is shared for Educational purposes only.
I hope you'll consider this educational post as a learning resource, Definitely, I encourage you to review the chart as an image or picture to better understand the concepts we've worked hard to explain.
Our effort will be successful if you gain a deeper understanding and learn something new from this post. If you find this helpful and informative, our hard work will have paid off. Please keep this in mind as you review the material.
Now let's explore how wave counts within wave counts, or lower degrees within higher degrees, unfold through complete wave theory patterns and following theory Rules all the times.
Let's take a closer look at the Bitcoin chart we've analyzed using Elliott Waves. From this perspective, it's clear that the Intermediate Degree Wave (2) concluded around June 23rd.
After this, we observe that the internal wave counts of the lower degree, specifically Wave 1-2-3 (in red) have completed their cycle of Minor degree. Furthermore, Red Wave 4 of same Minor degree has been moving sideways, characterized by a downward trend.
Notably, the fall of Red Wave 4 is classified as a Minor Degree movement. Interestingly, this downward movement appears to have terminated in an even lower degree, namely the Minute Degree, which we've marked in black as ((w))-((x))-((y))-((xx))-((z)) that means Wave 4 of Minor degree (in Red) is complete.
Given that Red Wave 4 Minor has reached its conclusion, it's highly plausible that Wave 5 has initiated. This development suggests that Bitcoin is poised to make a significant move.
Moving on to the analysis, we observe that:
- Rule 1: Wave 2 has not retraced more than 100% of Wave 1, so this rule is intact.
- Rule 2: Wave 3 is not the shortest among Waves 1, 3, and 5, so this rule is also valid.
- Rule 3: Wave 4 does not overlap Wave 1, so this rule is also satisfied.
Bitcoin is all set to shake things up! We eagerly anticipate further rallies in the market.
This post is shared purely for educational purpose & it’s Not a trading advice.
I am not Sebi registered analyst.
My studies are for educational purpose only.
Please Consult your financial advisor before trading or investing.
I am not responsible for any kinds of your profits and your losses.
Most investors treat trading as a hobby because they have a full-time job doing something else.
However, If you treat trading like a business, it will pay you like a business.
If you treat like a hobby, hobbies don't pay, they cost you...!
Hope this post is helpful to community
Thanks
RK💕
Disclaimer and Risk Warning.
The analysis and discussion provided on in.tradingview.com is intended for educational purposes only and should not be relied upon for trading decisions. RK_Chaarts is not an investment adviser and the information provided here should not be taken as professional investment advice. Before buying or selling any investments, securities, or precious metals, it is recommended that you conduct your own due diligence. RK_Chaarts does not share in your profits and will not take responsibility for any losses you may incur. So Please Consult your financial advisor before trading or investing.
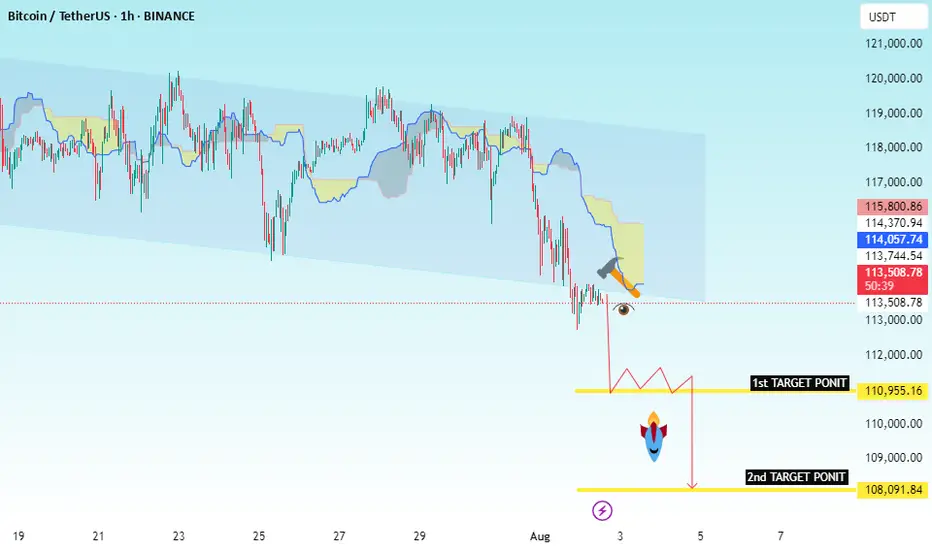
BTC/USDT Bearish Continuation SetupChart Identification:
Timeframe: Likely 1H or 4H
Pair: BTC/USDT
Indicators: Ichimoku Cloud
Pattern: Price broke down from cloud resistance and is retesting previous support
Setup: Bearish continuation with consolidation before next leg down
---
✅ Trade Setup (Sell):
🔹 Entry Point:
Sell Entry: Below 113,500.84
This level marks the neckline of a small consolidation zone.
Wait for clean candle close below this level.
---
🎯 Target Levels (Take Profit):
1. TP1: 110,955.16
Previous minor support
2. TP2: 108,091.84
Key support/demand area
---
🧠 Optional Confirmation:
You can wait for:
Bearish candlestick pattern at 112.1K zone
Rejection of retest near 113.7K–114.3K (top of cloud)
---
📌 Summary:
> BTC/USDT Short Setup
🟢 Entry: Below 113,500.84
🎯 Target 1: 110,955.16
🎯 Target 2: 108,091.84
Bearish bias as price remains below the Ichimoku cloud and shows signs of continuation.
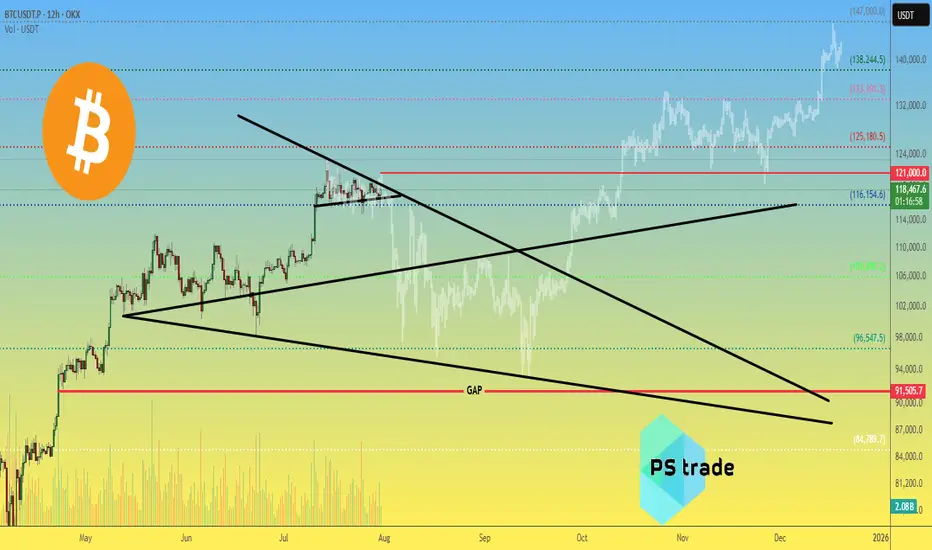
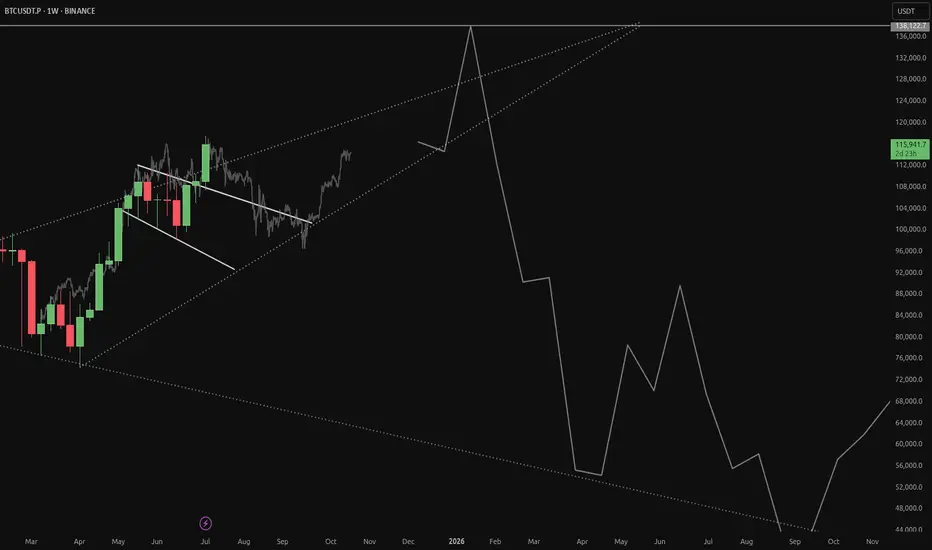
Bitcoin BTC price analysis by the end of 2025🕯 July is coming to an end, with 3 weeks of OKX:BTCUSDT consolidation between $117k–121k.
Tomorrow begins the last month of summer — and it promises to be "hot" as, according to our earlier published calendar Trump's administration plans to send letters with new, increased tariffs to "all countries" on 01.08.
💰 Also, take a look at Bitcoin Monthly Returns. In our view, 2025 resembles 2020 the most.
What do you think?
👉 According to this dynamic, the real "hot" may come not in summer, but late autumn.
💰 We've also tried to find a price fractal for #BTCUSD that fits the current structure — and for now, it looks plausible:
◆ In the coming days, CRYPTOCAP:BTC should not rise above $121k.
◆ A low of correction might hit mid-September around $93k.
◆ A cycle top for #BTC could arrive to the end of 2025, near $147k.
📄 Now that you've seen our version — share your forecasts on future #BTCUSDC price action in the comments 👇
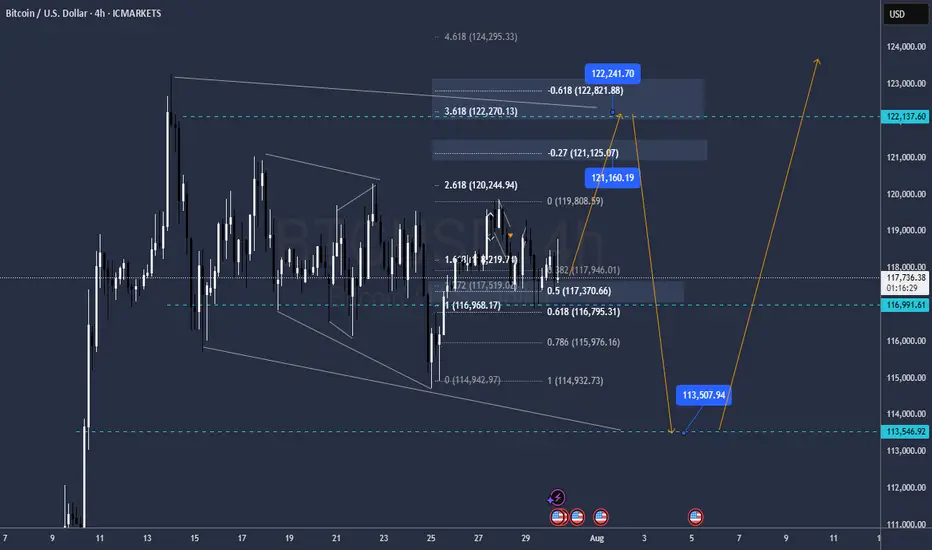
BTC FOMCOnce Again Ive the same view on BTC
There is a chance that it will go down now towards 113.500 straight so the internal buy towards 122.600 should be taken with low risk
if that level is reached the sell to 113.500 is prettyu much asured and also on 113.500 the buy to all time highs 127.500 and 133.000
GG
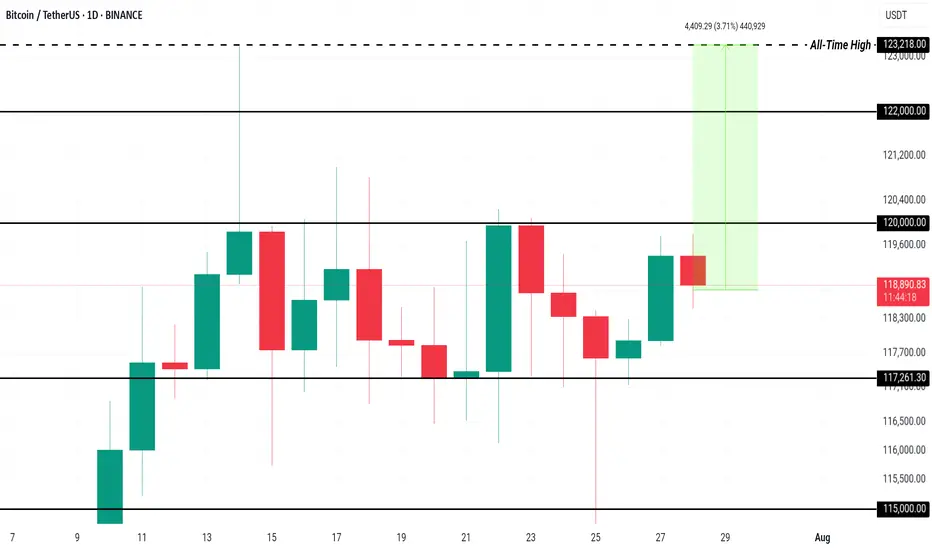
Here’s Why Bitcoin Price Could Rewrite History in AugustBINANCE:BTCUSDT price is currently hovering at $118,938, within a consolidation range between $117,261 and $120,000 . While this range has held steady, the possibility of breaking through $120,000 is high if investor sentiment remains strong.
The current sell-side risk ratio for BINANCE:BTCUSDT is at 0.24, well below the neutral threshold of 0.4 and closer to the low-value realization threshold of 0.1. This suggests that the market is experiencing consolidation, with investor behavior indicating a pause in large sell-offs.
Historically, August has been a bearish month for BINANCE:BTCUSDT , with the median monthly return sitting at -8.3%. However, given the current accumulation trend and the low sell-side risk, Bitcoin may defy its historical trend this year. If Bitcoin can secure $120,000 as support, it would likely push past $122,000 and move toward the ATH .
However, there remains a risk that the market could turn bearish if investors shift their stance due to unforeseen market factors. In this case, BINANCE:BTCUSDT could lose support at $117,261 and slide to $115,000, reversing the bullish thesis.
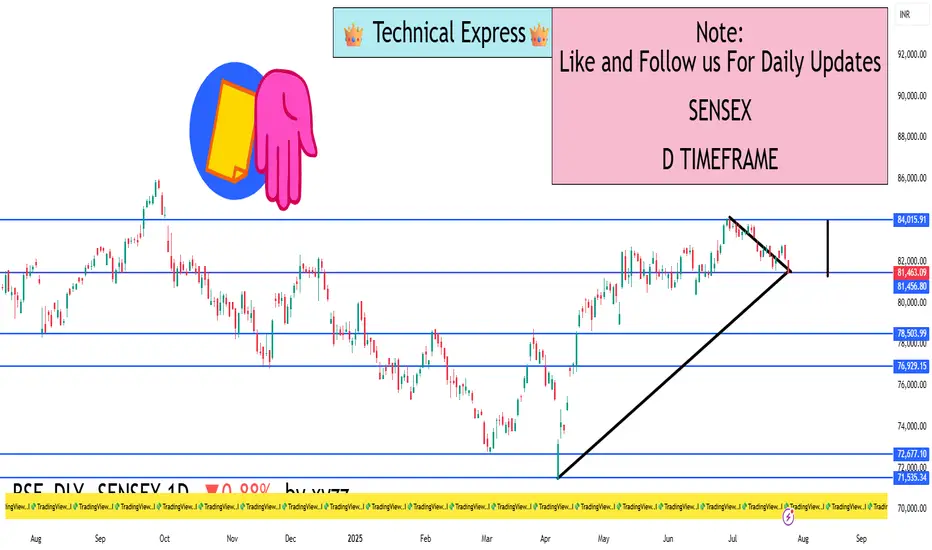
SENSEX 1D Timeframe📉 SENSEX Daily Overview (as of July 25, 2025)
Current Price: Around 81,460
Daily Change: Down by approximately 720 points (–0.9%)
Day’s High: About 82,070
Day’s Low: About 81,400
Previous Close: Around 82,184
📊 1-Day Candlestick Analysis
The candle for today is bearish, indicating strong selling pressure.
The price opened near previous levels but faced resistance at around 82,000.
Sellers dominated most of the day, pushing the index toward the 81,400 support zone.
🔍 Key Support and Resistance Levels
Level Type Price Range
Resistance 82,000 – 82,200
Support 81,400 – 81,000
If Sensex breaks below 81,400, the next target could be around 80,500 or 79,900.
If it holds above support and bounces, it could retest 82,200.
🧠 Technical Trend Analysis
Short-Term Trend: Bearish
Medium-Term Trend: Neutral to mildly bullish (as long as above 80,000)
Market Structure: Lower highs forming, suggesting pressure building on bulls
Indicators (assumed):
RSI may be approaching oversold
MACD likely showing bearish crossover
Volume increasing on red candles—indicating strong sell interest
📌 Sentiment & Market Context
Financial stocks (like banking, NBFCs) are under pressure.
Global cues (such as interest rate uncertainty and geopolitical concerns) are impacting investor confidence.
FII outflows and weak earnings in key sectors are adding to bearish momentum.
The broader trend remains range-bound, but with short-term downside bias.
✅ Strategy Suggestions (For Traders & Investors)
Swing Traders: Wait for a reversal candle (like a bullish engulfing or hammer) before considering long positions.
Breakout Traders: Watch for breakdown below 81,000 for continuation of the fall.
Positional Traders: Can wait to enter near 80,000–79,500 if the market holds that key level.
🔄 Summary
SENSEX is under pressure with a drop of 720+ points.
Technical structure suggests caution, especially if 81,000 breaks.
Support: 81,000 – 80,500
Resistance: 82,000 – 82,200
bitcoin, Stay heavy on positionsbitcoin, Stay heavy on positions
Short-term overbought is noise. Focus on the bigger picture. Keeping my position heavy—no plans to reduce yet

Shiro is about to explode in the next few daysWith a real potential of +20,000%, Shiro is on track to join the top meme coins.
This year, the target is clear: $2 billion+ market cap — or even more.
This is your chance to buy the bottom.
Don’t wait until it hits $500 million market cap to jump in.
Remember Pepe... Floki...
Those who got in early made life-changing gains. The rest just watched.
Do your research, check the chart, and get in while you still can. BINANCE:BTCUSD COINBASE:ETHUSD COINBASE:SOLUSD CRYPTO:SHIROUSD BINANCE:SHIBUSDT

Bullish bounce?The Bitcoin (BTC/USD) is falling toward the pivot and could bounce to the 1st resistance.
Pivot: 111,241.55
1st Support: 98,383.98
1st Resistance: 127,752.45
Risk Warning:
Trading Forex and CFDs carries a high level of risk to your capital and you should only trade with money you can afford to lose. Trading Forex and CFDs may not be suitable for all investors, so please ensure that you fully understand the risks involved and seek independent advice if necessary.
Disclaimer:
The above opinions given constitute general market commentary, and do not constitute the opinion or advice of IC Markets or any form of personal or investment advice.
Any opinions, news, research, analyses, prices, other information, or links to third-party sites contained on this website are provided on an "as-is" basis, are intended only to be informative, is not an advice nor a recommendation, nor research, or a record of our trading prices, or an offer of, or solicitation for a transaction in any financial instrument and thus should not be treated as such. The information provided does not involve any specific investment objectives, financial situation and needs of any specific person who may receive it. Please be aware, that past performance is not a reliable indicator of future performance and/or results. Past Performance or Forward-looking scenarios based upon the reasonable beliefs of the third-party provider are not a guarantee of future performance. Actual results may differ materially from those anticipated in forward-looking or past performance statements. IC Markets makes no representation or warranty and assumes no liability as to the accuracy or completeness of the information provided, nor any loss arising from any investment based on a recommendation, forecast or any information supplied by any third-party.

BTC/USDT – 4H Chart Technical AnalysisBTC/USDT – 4H Chart Technical Analysis
Market Structure & Trend
Overall Trend : Bearish (clearly defined by a consistent downtrend channel).
Current Structure : Price is in a corrective downtrend within a descending channel, after multiple rejections from the supply zone.
Key Technical Zones
1. Supply Zone
Strong rejection zone where the price previously reversed sharply.
Still acting as resistance, located around the upper range.
2. Demand Zone
Currently being retested for the fifth time, weakening its strength.
Recent price action shows liquidity sweep and swing low break inside this zone, potentially trapping early longs.
Fair Value Gaps (FVG) & Fibonacci Levels
1D FVG sits below the current demand, aligning with:
Golden Pocket (0.618–0.65 Fib).
Acts as a high-probability bounce zone for long entries if demand fails.
A break below this FVG could open up deeper downside toward the 0.786 Fib or beyond.
Psychological Levels
105,000 – Major resistance & potential take-profit area for long positions.
100,000 – Key support and liquidity magnet if the demand zone fails.
Volume Profile
High Volume Node: 102,000 – 106,800 — price tends to gravitate here, indicating potential consolidation or resistance.
Low Volume Area: Below 100,500 — suggests thin liquidity, which may cause sharp moves if price drops into this range.
Scenarios & Trade Ideas
Bullish Scenario
If price holds above the demand zone (after multiple retests) and confirms on LTF:
Potential Long to local resistance.
On breakout, target the 105,000 psychological level.
Confluence: High volume area offers both support and a magnet.
Bearish Scenario
If price fails to hold the demand zone:
Enter short position targeting the 1D FVG and 100,000 psychological level.
If that breaks, expect sharp continuation due to low volume below.
Conclusion
Price is at a pivotal point — currently balancing on weakened demand after multiple retests. Watch for LTF confirmation:
Above demand = bullish recovery setup.
Below demand = bearish continuation toward 100,000 and the FVG.
Manage risk tightly due to the proximity of both key zones.

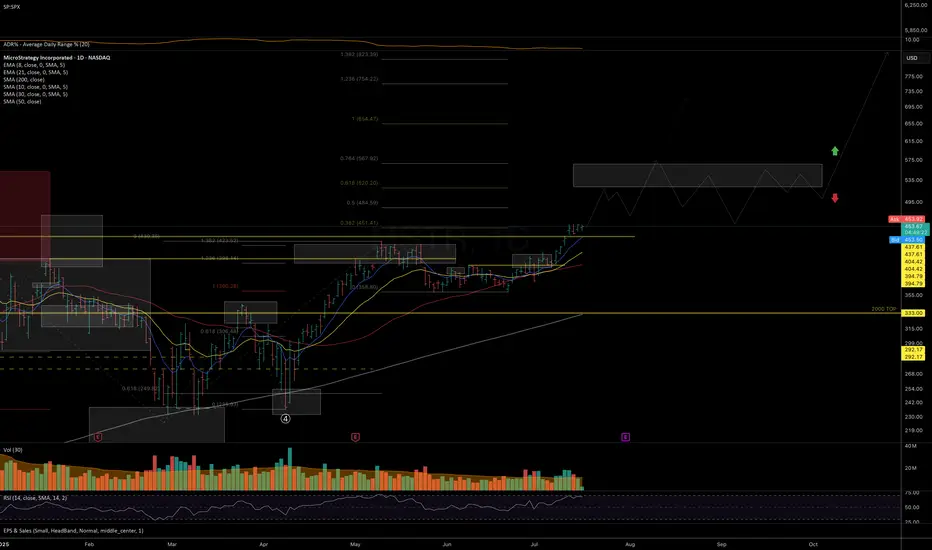
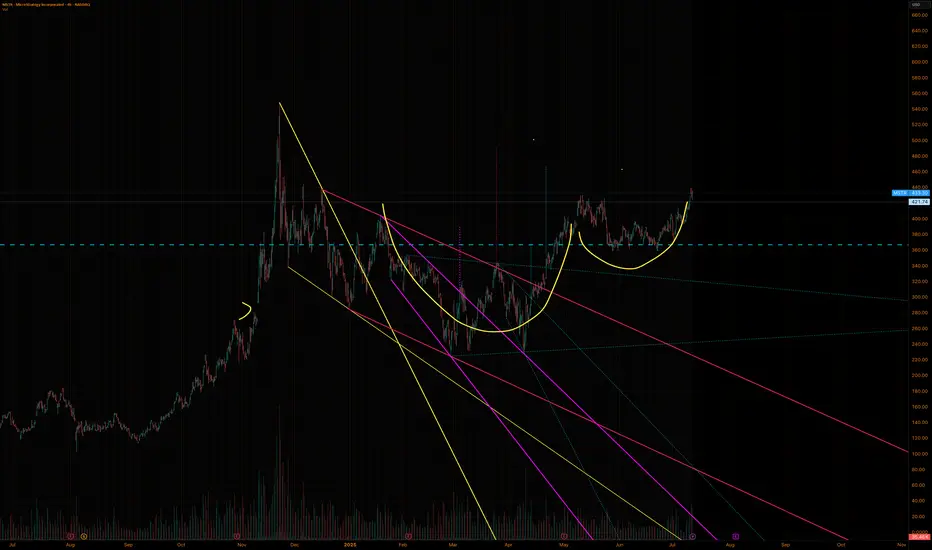
MSTR – On the Path to New ATHI was initially skeptical about the recovery structure unfolding since the April lows — it looked like a possible macro lower-high before deeper correction (as outlined in my previous idea).
However, given the strength in underlying #BTC price action (covered in my recent video-idea on crypto trend structure) and clear signs of constructive consolidation and accumulation during the July breakout, Isee strong odds for follow-through toward the 520–570 resistance zone in the coming weeks.
This move may align with CRYPTOCAP:BTC testing its macro resistance near 130K (see my macro BTC analysis on the idea section).
If NASDAQ:MSTR can break above 570 and sustain a close above it, it opens the door to a potential immediate follow-through toward the 650–755 macro resistance zone. But a scenario for more prolonged consolidation around 570 would in fact serve as a solid base for more stable and prolonged next long-term leg higher.
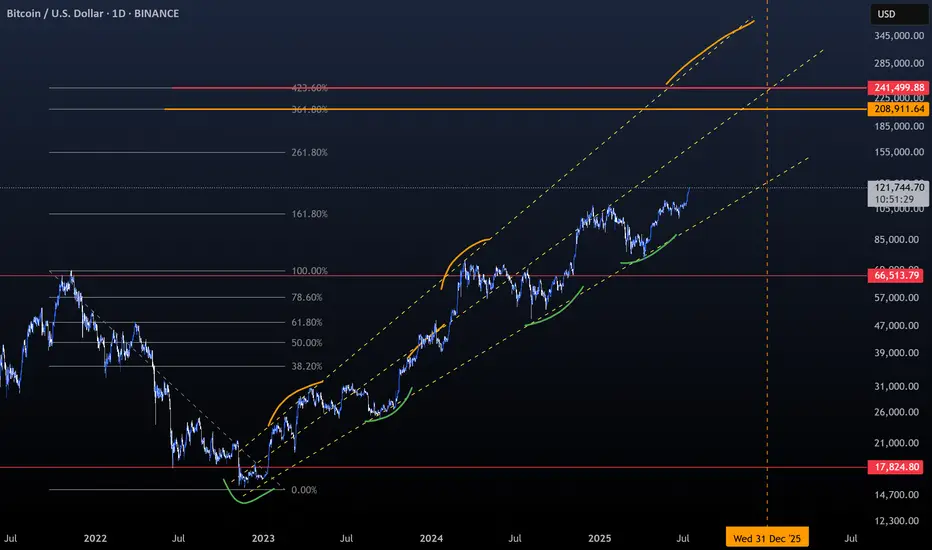
Bitcoin Early, Not LateA simple graphic with all annotations included :
- Trend.
- Fibonnacci.
- Middle Line.
- Support and Bounces.
- Resistances and dips.
- Everyone gets Bitcoin at the price they deserve.
- Not a price Prediction, keep things simple.
Happy Tr4Ding !
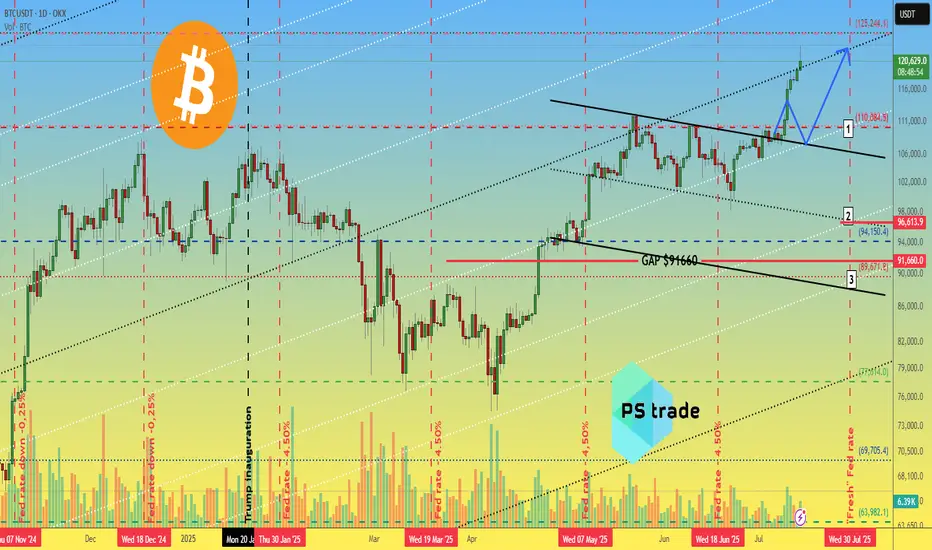
Bitcoin BTC price analysis📈 Two weeks have passed since the previous analysis of the OKX:BTCUSDT chart, and the market has decided to go with the 1️⃣ scenario.
Less than 3% remains to reach $125,000, and the price could easily get there by inertia, but that's a minor detail.
CRYPTOCAP:BTC is updating its ATH, and total liquidations on the crypto market over the past 24 hours are “only” $750 million, of which almost $450 million is accounted for by #Bitcoin.
Weak, very weak... Previously, longs were liquidated for $2+ billion, and it was reported that the actual amount of liquidations was significantly higher due to the fact that the exchanges' data was not fully disclosed. (For the sake of objectivity, at that time, the lion's share of liquidations was accounted for by altcoins, but now this is not the case).
◆ During this time, Trump introduced new tariffs — the market was “on a roll” — it swallowed it and didn't even notice the news.
◆ Tomorrow, July 15, the US CPI will be announced — the forecast is for inflation to rise from 2.4% to 2.6% (although there are rumors that the situation in the US economy is much worse and this may "come to light" tomorrow).
◆ July 16 - PII announcement - these indicators may act as a “cold shower” to bring the market out of its euphoria.
◆ From July 14 to July 18, the US Congress is considering three key crypto laws, including the GENIUS Act. Major players consider this a powerful driver. Perhaps the current growth has already “played out” and priced in expectations for news.
🪐 And this trading week will end on 18.07 with the start of Mercury retrograde, even the US Congress is postponing all important matters, and you still don't believe in it ))
🖐 Long positions are certainly beneficial, appropriate, and in line with the trend at present, but it is advisable to hedge them with stops, because as mentioned above: the price is rising, and there are few liquidations. During the previous decline in the cryptocurrency market, there were significantly more liquidations of long positions, and they may wish to repeat this.
And with the #BTCUSD price correction, there will be a fixation: some will have profits, and some will have losses in stablecoins, which would then be logical to reinvest as capital in altcoins. First in something more voluminous and less risky, and in the last stage, they will pump everything in a row)
But until then, we still need to survive and preserve our deposits.
So, in your opinion: correction to one of the levels:
1️⃣-$110k 2️⃣-$97k 3️⃣-$90k
or
is everything written above complete nonsense, and the market growth has only just begun to “take off”?
BTC Weekly Update -as of Jul14🕰 Timeframe:
📆 Date:
🔎 Market Overview:
💼 Massive Institutional Inflows:
▪️ Over $1.1 billion in net capital inflows have entered spot Bitcoin ETFs in recent days, bringing the total weekly inflows to $2.72 billion so far.
▪️ The total assets under management (AUM) across all Bitcoin ETFs now exceed $150 billion, representing over 6% of Bitcoin’s total market capitalization.
⚖️ Favorable Political and Regulatory Support:
▪️ The ongoing Crypto Week in Congress is reviewing key legislative proposals like the Genius Act and the Clarity for Digital Assets Act, both of which offer promising regulatory clarity for the crypto industry.
▪️ Additionally, former President Trump’s executive order to establish a “Strategic Bitcoin Reserve” signals strong official political support for Bitcoin adoption.
📊 On-Chain & Sentiment Indicators
📦 Exchange Reserves:
Bitcoin reserves on centralized exchanges are at their lowest levels in years, suggesting a trend toward long-term holding (HODLing) and reduced selling pressure.
🧠 Fear & Greed Index:
The sentiment index remains firmly in the “Greed” zone, even hitting its highest level since May, indicating strong bullish sentiment among retail and institutional investors.
🌀 Whale Activity:
Whale wallets continue to show heavy accumulation, with large and steady transfers into private wallets, further supporting a bullish on-chain trend.
📈 Technical Setup
🔵Trend: Ranging upward
🔸 Key Support: 118,000➖ 115,000
🔸 Key Resistance: 125,000➖ 130,000
🔸 Indicators Used: RSI above 70
🧭 Next Week – Key Points
🔹 Watch for the outcomes of Crypto Week legislation in Washington — this will be a key driver for market direction.
🔹Monitor ETF capital inflows — if daily inflows stay above $500M, the bullish trend will likely strengthen.
🔹 Track the Federal Reserve's interest rate policy and the USD outlook, especially in response to inflation or other macroeconomic factors.
🔚 Summary: Final Analysis
📌 After reaching a new all-time high above $122K on July 14, Bitcoin’s bullish trend has strengthened. Strong institutional inflows and political support have reinforced the foundation for growth.
● Key Level Ahead: $125,000
● Outlook: If price consolidates above resistance, we could see a move toward $135K and beyond.
● Weekly Bias: Bullish, with potential for a pullback before continuation upward.
✅ If you like this analysis, don't forget to like 👍, follow 🧠, and share your thoughts below 💬!

Cup and handleAfter many months, we now have a cup and handle formation. Regardless of Michael Saylor's constant buying, we have a bull flag in play that takes us to $491 USD.
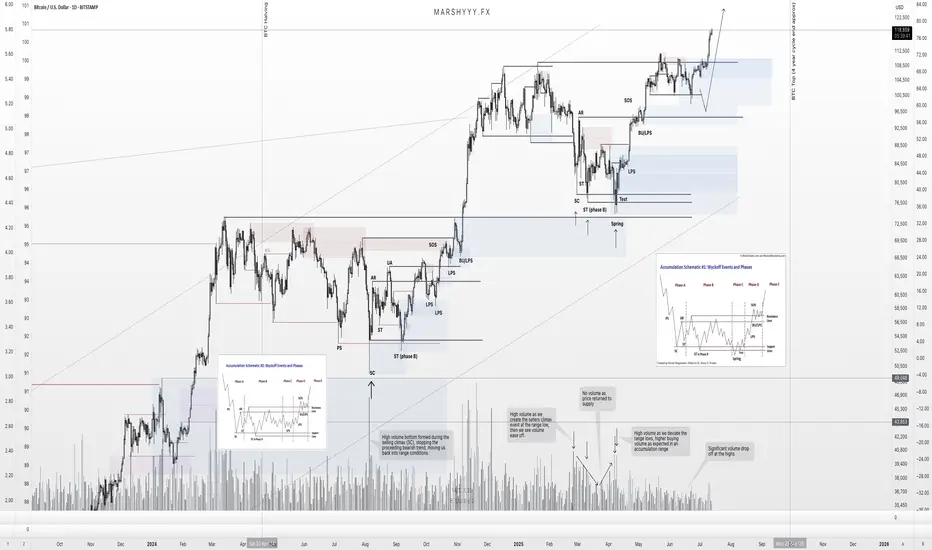
BTC – Textbook Pullback. New ATHs. What’s Next?Back in mid-June, I published a BTC update calling for a local correction into HTF demand while most were screaming bear market and waiting for deeper breakdowns.
Price action played out exactly as forecasted.
BTC swept the $100k swing low, front-ran my first demand zone by $400, and launched into a powerful reversal — just like it did back in April, where it also front-ran the key HTF demand before rallying.
That move took us straight into new all-time highs (ATHs) — now trading comfortably around $118k.
🧠 What Happened?
✅ Liquidity sweep of the prior low
✅ Front-run demand zone (perfect HTF structure)
✅ Strong bullish reaction and higher high
✅ Confluence from USDT.D rejection at 5.25%
✅ Alts showing signs of strength as BTC rallies
The entire setup aligned perfectly across BTC, USDT.D, TOTAL, and OTHERS.D — all of which I’ve been tracking in tandem.
🔮 What Now?
With BTC now in price discovery, I expect continuation higher — but not without the possibility of a short-term pullback.
📉 A potential retest of the $108k zone isn’t off the table. This level aligns with:
- Prior breakout structure
- Range high retest
- Local demand before continuation
But even if we go straight up — I remain HTF bullish into the final phase of this cycle, supported by:
- USDT.D structure still bearish
- BTC.D showing signs of distribution
- ETH.D and OTHERS.D gaining momentum
- Altseason rotation already starting to pick up
🧭 The Macro Outlook
The 4-year cycle projection still points to a Q3 2025 top — likely between August late and September based on historical cycle timing, but this could deviate.
That gives us a window of 2–3 months for this final leg to unfold — and it’s already in motion.
Stay focused. Stick to your plan. Ride the trend, don’t chase it.
Let me know what levels you're watching next, and whether you think we get that $108k retest — or we go vertical from here.
1D:
3D:
4D:
1W:
1M:
— Marshy 🔥
BTCUSDTBitcoin may be looking to complete the downward correction from the $101,000 price range to $99,000 and then begin a long-term upward trend. Pay close attention to the extent of the correction and don't give in to fear or greed.
In any case, it should go to $1300,000.
BINANCE:BTCUSDT

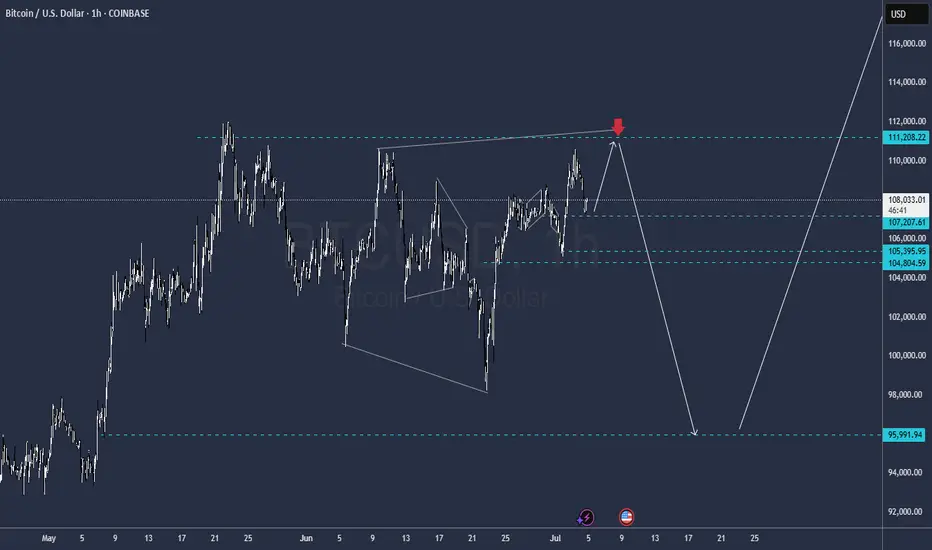
Bitcoin UPDATEThe sell is @ 111.200
I think it still has to make a new high, sell is not ready just yet
levels highlighted