Bitcoin Next MovePair : BTCUSD ( Bitcoin / U.S Dollar )
Description :
Rising Wedge as an Corrective Pattern in Short Time Frame and Rejection from the Lower Trend Line
Completed " abc " Correction
Break of Structure
RSI - Divergence
Bearish Channel as an Correction in LTF
Fibonacci Level - 61.80% / 78.60%
Bitcon


bitcoin buy attempt Buy: 28200 or lower
Stop: 27650
Notes
The model:
The Ingenuity Trading Model is a Geometric Markov Model with specific inputs related to Price, Time, Volume , and Volatility. The model attempts to predict local minimums and maximums in price on a daily and weekly basis. A fancy way of saying a trading system that detects specific patterns in price, time, volume, and volatility and indicates whether to buy or sell.
On winning trades after 1 day take at least ⅓ of the position off and move stop to breakeven

BITCOIN GOING TO BREAKDOWN?4h rising wedge with bearish divergence could bring the price to backtest 25k after making our first target of 28 k.
The same fractal as the ftse trade I posted a few weeks ago, it played out wonderfully.

The price of Bitcoin has soared driven by market optimismLast Friday, Bitcoin fell to US 19,569. How desperate the market was at that time, and how enthusiastic it is now. In just one week, the Bitcoin market has undergone a shocking reversal, breaking through the previous high in one fell swoop and reaching above US 27,000.
In terms of daily structure, Bitcoin has broken the previous horizontal pressure level. At this stage, it is in a vacuum zone. Bitcoin price analysis has been slowly rising since the beginning of this week, and more buying pressure has been observed in the market. Pressure.As tokens are supported by strong buying pressure and good technical prospects, market sentiment remains optimistic, and the bullish momentum is expected to continue, with the next level of pressure around 30,000.
From the four-hour level, it can be seen that the last downward pullback was at the position of 0.382. Next, I think the possibility of constructing an equidistant ABCD is very large. As shown in the figure, Point D is far from being reached. The rise in the past two days has formed a complete breakthrough in the previous chip-intensive area. If there is a pullback in a short period of time, I think the pullback may as well be an opportunity to participate in long-term.
In order to facilitate everyone to continue to follow up on my analysis and sharing, you can like and follow me; in addition, I will share the daily real-time strategy in the channel. If you can't follow up in real time, you may make operational errors.You can use the following methods to enter my channel for free to follow the latest news and follow up on market trends in real time.

BTCUSDTBITCOIN UPDATE ACCORDING TO OUR ANALYSE BITCOIN IS GOING WHERE WE ANALYSE
Friends, the advantage of waves is that you can use them on any time frame 🙆
⠀
Patterns form in any market and any TF. You just need to decide where you feel most comfortable working. My thoughts below 👇
⠀
🔴 15min - 1H takes a lot of time and engagement, it's tiring and leads to mistakes. Traders use high margin and often lose money + leverage.
⠀
🟡 1W - 1M is a very long time, it is more suitable for investors, and it requires a lot of capital. The patterns are clear and strong.
⠀
🟢 From experience I realized that my choice is 4H - 1D. No need to spend all day on charts, good work/life balance, good market movements, patterns are well distinguishable. It requires patience, which most traders do not have. It takes you to the next level if you have the discipline.
⠀
🚥 If 4H - 1D is for you, let's trade together!


BTC: Short at high levels and long at low levels
Yesterday, Bitcoin fell below the previous low during trading, hitting a new low. This indicates that the first phase of the decline is complete. However, there is a flaw in that it is still 500 points away from the critical support level of 21500. The probability of a rebound at this point is gradually increasing, but since the trend is still bearish, shorting at high levels is still the main strategy.
The trading strategy is to short at 23600, with a stop loss at 24200, and a target of 21500 to 21400. Alternatively, if it falls to 21400, go long with a stop loss at 20900 and a target of 23600.
Don't let past regrets interrupt your current plans, and don't let anxiety and worries disrupt your steps forward.
As winter fades into spring and the sun rises and sets, every moment is precious. By appreciating the present and living each moment to the fullest, we can reap the rewards of a rich and fulfilling life.
My Mid- Long-Ter Trade base on price behavior.The outcome is uncertain, but all we can do is manage risk.

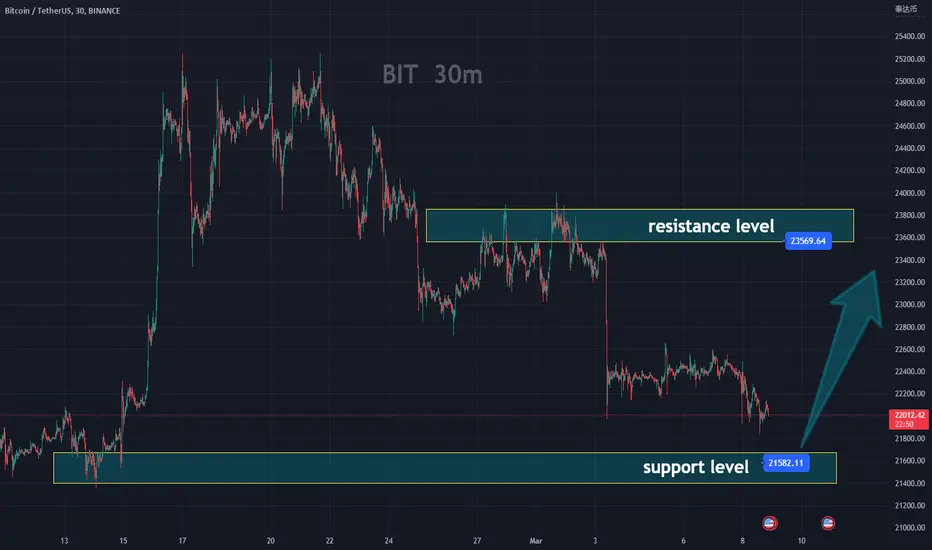
Bitcoin: Long at this position
Hello everyone, after a big drop, Bitcoin has been consolidating and today I'm sharing my view on Bitcoin using a 15-minute chart.
As you can see on the chart, there are clear and regular box ranges. Since there are such clear signals, we certainly can't ignore them. I have marked the specifics on the chart, and it will be clearer for you to compare it.
My trading strategy is to buy in the current range of 22300-21800, with a target near 22900-23800. This is relatively certain, and the probability of profit is relatively high .
The reason for this trading strategy is that I believe Bitcoin will rebound to fill the gap created by the recent big drop.
Thank you for your attention and support. I will continue to update my trading strategy. If you have any questions, please leave a comment and I will help you with the most reliable solution in a responsible manner.
Have a great day!

Buy position on Bitcoin with 5X LeverageUse proper margin and manage risk. by 5X lev the stop loss will be about 5%. It is recommended risk free the position after hitting TP1 and save profit in TP1

Bitcoin Catastrophic Move On FOMC DayBTC/1H forming a parallel downwards channel
After 3rd touch at 25.2 and jebating everyone with that Ascending Triangle. bitcoin invalidated the triangle and started bleed down slowly to ~24K showing Bears are comin into the market again and bulls are running out of fuel.
Please Boost,Comment,Follow if you find this video informative!Really motivates me to do more.
There are some buy pressure still which I think bulls can try to push the price back to 24.8 for the last time before a catastrophic move to the downside ~22.4 or even a capitulation candle to 21.1
Detailed explanation with lot more to covered on video
Thanks for watching

DODOUSDTDODO also has an important feature called SmartTrade. This enables a decentralized liquidity aggregation service that routes and compares liquidity sources to quote the optimal swap rate for trading tokens. Another unique feature of the platform is Crowdpooling. Here, liquidity markets are available, allowing projects to distribute tokens equally without interference from bots. The grouping feature also allows users to create their own market making strategies.

CAN SOLANA HIT 24 DOLLARS?
In this video, see my analysis of the price movement of Solana, follow me on tradingwiew for more videos like this.
See you Zlatko

AW Bitcoin Analysis - My Thoughts on Current Price Action...Another update after reviewing the waves earlier, there are just a few more things to consider.
Wave 2 might have ended but we need to see price action fall below 21,533 from current levels.
The reason I say this is because impulsive moves typically have very shallow retracements.
At the same time Wave v of Wave 1 was sharp.
We also have big rejection candle from the recent spike that hasn't really resolved in any direction yet.
All in all, I still think there's a chance we could fall from these levels.
Remember to use Disciplined Money Management Principles to ensure longevity as a trader.
If you don't know the long term pattern shouldn't you be doing your research instead of just following the crowd?
Just remember: I am not a financial adviser; I suggest using this only as a guide. Always do your own research.
***AriasWave is not the same as Elliott Wave so your counts may differ to mine if you happen to use it.***

Bitcoin price, "FUD around BUSD", U.S. Economic Data This Week:The trading week started with a rather "active news background":
"Paxos (BUSD miner) will face a lawsuit from the SEC in connection with the issuance of unregistered securities (stablecoins).
With a total capitalization of $16B, BUSD is the 3rd largest stablecoin, with 90% of the stablecoin concentrated on Binance.
BUSD also accounts for 21% of all customer reserves on Binance.
The issuance of new BUSD has been suspended, and exchange for fiat dollars is still possible."
"Such a "regulatory raid" on Binance's partner may be a retaliatory operation by the US authorities to try to destroy the business of the offshore exchange Binance, after CZ became the starting point of the FTX fraud disclosure in November 2022 and refused to cooperate with USDC."
At the moment, it looks like another batch of FUDs "to bring" the market down to the desired levels. Securities are bought with the aim of making a profit from the asset's appreciation in the future, and the essence of stablecoins is a stable exchange rate, a stable trading deposit, without profit. The US dollar is not considered a security, right?)
In recent months, the cryptocurrency market has been strongly correlated with the SP500, which is directly dependent on US macroeconomic indicators.
U.S. Economic Data This Week:
- CPI Inflation (Tues.) 🔥.
- Retail Sales (Wed.)
- Ny Fed Manufacturing Index (Wed.)
- PPI Inflation (Thurs.)
- Philly Fed Manufacturing Index (Thurs.)
- Jobless Claims (Thurs.)
- Housing Starts (Thurs.)
We are most interested in the new inflation rate that will be announced tomorrow, Tuesday, February 14, 2013. After all, it's one of the main indicators that the FED wants to take control of and talks about at every speech is inflation at 2%.
Last month, the inflation rate dropped to a projected 6.5% and the cryptocurrency market exploded with growth on 12/01/2023.
Our expectations for tomorrow, 14.02.2023:
- inflation at 6.2 percent or more - falling prices on the crypto market
- lower-than-expected inflation < 6.2% may cause smooth growth.
Anyway, the crypto market has been growing very well for more than a month. Against the background of the previous downtrend for more than a year, the growth in January can be called phenomenal.
Personally, we do not have enough price correction to continue the growth.
There are two fractals on the chart:
1. We published the white one last week, and it is now working well and indicates that a drop to the liquidity zone of $18900-20400 is possible. For us, this is currently the main scenario, and it is in this liquid zone that we plan to buy long positions.
2. The blue scenario is in case super-positive CPI figures are announced tomorrow. Accordingly, the buy zone for long positions will be $21200-22300.
Which trading scenario for the coming week is more to your liking? Share your thoughts in the comments below the idea
_____________________
Did you like our analysis? Leave a comment, like, and follow to get more

BTCHello traders.The price range of $20,500 will be a good position to buy.
If the $20,000 support is broken, the $19,000 range will be an excellent position for long-term buying.

SHORT - BTCUSDHere we could have two potential area's where the bears could take #BTC back down to form a new low around 10K

Bitcoin 200ma Buyers and ShortersIn the history of bitcoin, the 200ma on the weekly has been a good place to buy before a great rally upwards. This time, buyers of the 200ma weekly were in loss to about 30.5%. Shorters of the 200ma weekly got a 2R trade. Price is now at their entry again. This is tracking the long entries that have been waiting for a significant rise since the drop.
R is risk. The number in front is the multiple of that risk. Risk is calculated by how much price goes in the opposite direction of your bias after your entry, before finally going in your favor. This is the concept of actual risk.

Return to the mean HI again and welcome to my new update.
We have seen very weak year ending in stock and crypto market.
So I refresh chart while remaining almost the same.
Trends went sideways, however I personally see more downside in Q1 and maybe Q2 period.
This would lead to achieve my long-term buy zone.
Everything important is matched in my daily chart.
Yours Emvo.
*This is not any financial advice.

BTC SHORT 16K BY ELECTION TIME NOV.2022THE SELL IS IN. We cannot get a solid close over 24.6k to push for a 30k test which alludes me to a dive down to the impulse at 15-17K.
The interest rate hikes in the past 6 months have just been another driver in KILLING the price of BTC and majority of cryptos. The banks are broke and are liquidating their initial positions for a possible lower buy in.
The US gov is also looking for crypto regulation which would further dampen the price as this is not what crypto was created for. They will speak towards this in the NOV elections as well. The US GOV wants to us USDC/ USDT
We tested 20K today 9/27/22 but it could not hold over.
BTC wants low LOW. It is in the bottom depths of consolidation towards a cheaper price.
19K flat is a safe buy in zone but you can look for a high 19.5K test to enter. This will not be a fluid drop but a choppy drop.
Anything lower than 16K = 12K SOS
SL: 20.1K
TP: 16K
RR: 1:2.5

Updated 8HR BITCOIN CONESeems like Bitcoin has developed a major resistance level inside the cone. Watch out for the break out above or below the resistance line.

NZDUSD BUYNZDUSD analysis is simple but effective
We wish you a successful trading week and always remember how to manage your capital and create your own strategy
