Silver = to the moon??? September 03, 2025Who’s Loading Up:
A top dog at Pan American Silver Corp., a heavyweight in North American silver digs, just scooped up a hefty chunk of shares.
Deal Size: This exec grabbed 50,000 shares at $22.50 a pop on August 28, 2025, dropping $1.125 million—talk about putting skin in the game!
Company Lowdown
Pan American Silver Corp. runs 10 mines across the Americas, packing 468 million ounces of silver and 6.7 million ounces of gold. Based out of Vancouver, they’ve got cash flowing like a river, fueling big bets like La Colorada Skarn and Escobal.
Sector Vibes:
• The Silver Institute’s calling for a fifth straight supply crunch in 2025, with photovoltaics and AI tech demand hitting all-time highs.
• Tariff threats, green energy boom, and a possible Fed rate cut in September 2025 could send silver soaring.
Big Funds Jumping In
Last quarter (June–August 2025), heavy hitters like Sprott Asset Management (+8% in Pan American), BlackRock Inc. (+5% in iShares Silver Trust), and Invesco Ltd. (+6% in VanEck Silver Miners ETF) piled into silver.
Buzz on X says Saudi Central Bank’s dipping its toes into silver via iShares Silver Trust (SLV), ditching its gold-only playbook.
London Vaults Drying Up
The LBMA’s silver stash is under siege from a supply deficit. With 150 million ounces short in 2024, the Silver Institute hints reserves might shrink 5–10% yearly if demand keeps raging, setting the stage for a price explosion.
1979 Boom & 2025–2026 Wild Cards
1979 Flashback: The Hunt Brothers’ silver grab, plus inflation and oil chaos, rocketed silver from $6 to $50/oz (+700%). Gold jumped from $300 to $850/oz on similar vibes.
2025–2026 Triggers:
Inflation’s sticky above 3%, the USD’s wobbling from tariffs, and a Fed cut looms in September 2025. Watch for U.S.-China trade wars, Middle East flare-ups, or a BRICS metals exchange—any could ignite a 1979-style silver rocket if deficits worsen.
Price Targets:
Short-Term (3 months): $60.00 (+46.9%)
Mid-Term (6–12 months): $120.00 (+193.7%)
Long-Term (18–24 months): $240.00 (+487.5%)
🤔🤔🤔🤔🤔🤔🤔🤔
Blackrock

BITCOIN: A TALE OF EXHAUSTED BULLSmart money tends to accumulate heavily when sentiment is at extreme fear, signaling belief in a rebound. It is often correct, though not consistently.
Much of the pessimism appears to be fully priced in at this point. Thus, a bullish scenario remains technically possible, although broader conditions still align with a bear-market environment.
Let's see.

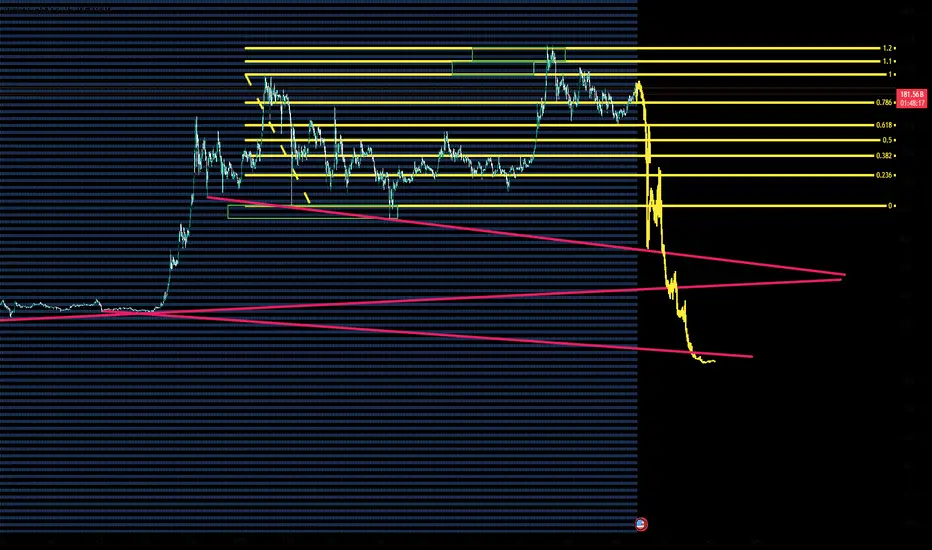
Market Makers Exposed : BAT VWAP Structure Points to 0.36The volume is the source, the price is the advertiser, and the time is the regulator and all three are currently aligned.
👉The highlighted box represents the price expected on November 30, 23:59.
This move is not random. It is simply price reacting to volume and VWAP structure.

BLK: more downside potential Price has immediate downside potential if it fails to reclaim the local resistance at 1090. A breakdown below 1050 would increase the odds of continuation toward the next key support levels at 1018 and 985–965.
Alternatively, a sustained break above 1090 would shift probabilities in favor of a larger bounce toward the declining 50-day MA.
Chart:

BlackRock (BLK) – Wave 3 in Motion📢 BlackRock (BLK) – Wave 3 in Motion | Institutional Strength + Fibonacci 3.618 Target Ahead 💥
📅 Timeframe : Monthly (Long-term Outlook)
📍 Current Price: $1,130
🎯 Wave 3 Target: ~$3,710 (3.618 Fibonacci Extension)
🧭 Structure: Wave 3 of a larger 5-wave cycle in progress
🌀 Wave Theory Confluence
BlackRock is currently unfolding a strong impulsive structure as part of a long-term Elliott Wave cycle:
Wave 1: The early-stage rally from 2000 to 2007
Wave 2: A textbook 0.382 Fibonacci retracement during the 2008 financial crisis
Wave 3: The current wave, extended and projected to reach 3.618x the Wave 1 length (~$3,710) — a typical signature of a strong institutional-driven Wave 3 impulse ⚡
Wave 4 & 5: Projected after this major expansion, with intermediate corrections expected
This fractal symmetry suggests BLK is nowhere near a cycle top yet , with significant upside potential over the next several years 📈
📐 Fibonacci Levels & Projections
🔹 Wave 2 respected the 0.382 retracement , a classic spot for shallow corrections during strong trends
🔹 Wave 3 Extension Target sits at 3.618 — ~$3,710 — backed by both Fibonacci math and historical wave behavior
🔹 Mid-channel resistance may create short-term corrections before final push to the target
🧠 Smart Money Concepts (SMC)
✅ Reaccumulation Phases: Price consolidations in 2015–2016 and 2022–2023 reflect institutional reloading zones, not distribution
✅ BOS (Break of Structure): Recent break above 2021 ATH confirms new markup phase 🔥
✅ No major supply zones above, indicating price could expand freely until price discovery finds new resistance closer to the projected 3.618 extension
📊 Price Action Analysis
Clean higher highs and higher lows on the monthly chart
Large-bodied bullish candles show strong trend momentum
Minor corrections respecting prior resistance-turned-support zones = confirmation of demand ✅
Breakout from compression range suggests volatility expansion and strong directional bias
💼 Fundamental Tailwinds
BlackRock remains the world’s largest asset manager , positioned at the heart of global capital flows:
AUM over $9T 📦
Massive institutional & ETF exposure (iShares)
Strong penetration into passive investing & ESG funds
Beneficiary of rate cut cycles and equity bull markets
Strategic leadership in tokenized assets, AI-enhanced portfolio management , and climate investing
These macro and innovation-driven tailwinds align with the explosive potential of Wave 3 , fueled by both capital inflows and earnings expansion 🧮
🎯 Summary
BlackRock is in a textbook macro Wave 3 expansion , with all signs aligning:
✅ Elliott Wave Impulse
✅ Fibonacci Extension to 3.618
✅ Institutional Accumulation Confirmed
✅ Price Action Breakout
✅ Rock-solid Fundamentals
A correction (Wave 4) may develop later around or after $3,700 — but for now, the path of least resistance remains up . Long-term investors and swing traders should monitor retracements for potential add-on positions before price enters Wave 5 later in the decade.
⚠️ Disclaimer: This analysis is for educational purposes only and is not financial advice. Always do your own research and manage risk accordingly. 🛡️
#BlackRock #BLK #ElliottWave #SmartMoney #Fibonacci #TechnicalAnalysis #PriceAction #WaveTheory #InstitutionalTrading #SwingTrade #LongTerm #StockMarket #AssetManagement #Breakout #Wave3 #BullishOutlook #Fundamentals #TradingStrategy #MacroView

Blackrock Inc (BLK) | Institutional Footprints Revealed📈 BlackRock (BLK) | Institutional-Grade Supercycle Analysis
Elliott Wave × Market Structure × SMC × Fibonacci × Macro Integration
This is a comprehensive high-timeframe structural map for BlackRock NYSE:BLK , integrating multiple institutional frameworks to define the current Supercycle position and its projected trajectory.
The objective is to identify where we are in the market cycle , where long-term capital will likely reposition , and where the next asymmetric opportunities lie .
1. Supercycle Positioning — Structural Context
BLK has completed a textbook extended Supercycle Wave III , reaching near the 2.618 Fibonacci expansion relative to Wave I .
The magnitude and duration of this wave strongly suggest that the market is now transitioning into Supercycle Wave IV , typically a multi-year corrective phase characterized by liquidity redistribution, volatility clustering, and structural rebalancing.
Wave IV historically aligns with:
Macro capital flow deceleration
AUM contractions during broad equity drawdowns
Repricing of risk premia across institutional portfolios
Rotation from cyclical equity exposure toward defensive allocations
This environment is already manifesting across major indices and B-Tier asset managers.
2. Structural Market Outlook — Wave IV Correction
Wave IV is unfolding through a complex corrective formation (likely W–X–Y) rather than a simple ABC.
This aligns with current market behavior: overlapping price structures, declining momentum, failed breakouts, and liquidity sweeps — all indicative of institutional distribution.
Key corrective targets (Fibonacci Alignment):
0.382 Retracement | $500-450
Structural demand + prior weekly inefficiency + rebalanced liquidity
0.5–0.618 Golden Pocket | $350–$300
High-probability reaccumulation zone used by discretionary and systematic funds
Confluence with multi-year unmitigated demand
These zones carry materially higher probability for macro accumulation and long-duration capital deployment.
3. Smart Money & Orderflow Alignment
The price action around the prior ATH displays:
A clean liquidity sweep above structural highs
Formation of a macro distribution range
Break of structure on the weekly timeframe
Unfilled fair value gaps to the downside, consistent with Wave IV corrective targets
Classic displacement patterns signaling institutional orderflow rotation
This behavior suggests the transition from expansion to correction has already begun, positioning the market in the early-to-mid phase of Wave IV.
4. Macro & Fundamental Confluence
From a macro-fundamental standpoint:
BLK’s earnings sensitivity to equity markets is significant
Periods of elevated volatility materially affect net flows and AUM stability
Regulatory and rate-cycle uncertainty persists
Secular growth drivers remain intact, supporting a strong Wave V recovery phase
The macro environment fully supports a medium-term corrective repricing before a long-term structural continuation.
5. Forward Projection — Supercycle Wave V
Upon completing the corrective leg, BLK enters the next structural expansion: Supercycle Wave V.
Probabilistic Wave V targets:
3.618 Fibonacci Expansion | $3,700–$4,000+
Supported by long-term earnings growth trajectory
Strong confluence with high-timeframe extensions and historical BLK trend behavior
This aligns with typical final-wave macro expansions that drive multi-year secular highs.
6. Executive Summary
Near–mid term (corrective):
Anticipating continuation of Wave IV into $500 → $300 liquidity zones
Expect volatility clusters, complex corrective behavior, and structural retests
Long term (expansion):
Initiation of Supercycle Wave V post-2027/2029 accumulation
Probable macro expansion to the $3.7k–$4k region
Aligns with both structural and fundamental models
This framework provides a clear roadmap for long-horizon investors, wave practitioners, and advanced SMC traders.
If You Found Value
We provide institutional-grade breakdowns combining macro structure, advanced Elliott Wave modeling, liquidity analysis, and high-timeframe confluence mapping.
For deeper insights, premium updates, or multi-asset coverage —
Follow and enable notifications for ongoing institutional-level analysis.
Share this chart if you believe traders deserve deeper, institutional-level insight.
Not financial advice. For educational purposes only. Do your own research.
#BLK #BlackRock #ElliottWave #SmartMoney #MarketStructure #Fibonacci #LongTermInvesting #Stocks #TradingView #WaveAnalysis #Macro #Liquidity #Investing #StockMarket #TechnicalAnalysis

BITCOIN 2025 - MAKE OR BREAKBTC is coiling. Liquidity is tightening. Momentum is fading. The market is soon to decide whether we break higher toward the next resistance leg… or lose key support and trigger a broader correction.
Two key dates stand out: November 6 and November 17.

Long BitcoinBitcoin! I took a small long. Minimal Stop-Loss: entry at 101850, SL at 99000. Lets see if this PIG tries to fill the Book again at 118k level ...

BTCUSDT Sell PossitionWe are in a downward channel, be careful and the selling position has the most gain.

AJ Down For The CountCross my line and we will get down. My money is on the put. Please comment and follow for more. We don't lose. Ripley!

XRP BIG DROPS - Do't blame this on a whale!Traditional pump dumps and market manipulation. Watch and see the sky fall out. Should be in Asian season on Tuesday. Believe don't be a not. PS- Ripley
Bye Bye - Dow & IndicesThis is not financial advice but a 100% true method of market structure and what to expect in the future. Watch and see.... Believe it or not!

No Doubt... Bitcoin Pull BackBitcoin is making it's move down for a massive explosion in 2026. watch this and let's see if it plays out perfectly. Follow for more!

TVSmotors will it break or trap!! 2970 close very imptvs motors trading at its ATH range RSI also at major lvls..

The Great Trap: How Billionaires Are Winning, and You're Not!The Great Crypto Trap: How Billionaires Are Winning—And You're Not
The ETFs, Saylor, and all of Trump's billionaire friends are getting richer—thanks to crypto.
Meanwhile, most retail traders are just trying to stay above water. Leverage trades are wiped out, charts feel rigged, and the market makes you feel like you're swimming against a riptide.
Why?
Because these rich guys have a plan: manipulate you and take your money. That’s how they stay rich.
Understanding their strategy is the first step to stop being their exit liquidity.
🧠 The New Battlefield
Crypto is no longer a playground for cypherpunks and tech rebels. It’s fully institutional now. We're not just trading against whales—we're fighting the same entities that own the media, control Wall Street, and write the rules.
So forget the old ways of thinking. The tables have turned.
🗓 The Sunday Rekt Routine
To maximize destruction, they need to avoid friendly fire. So they pump on the weekend when retail is free and optimistic, then dump on Monday to close the CME gap—like clockwork.
The playbook:
Weekend: Pump. Trap your long.
Monday: Dump. “Fill the gap.” Liquidate everyone.
Response:
Don’t fall for weekend FOMO. Exit Sunday afternoon. Wait until Tuesday to re-enter, once Monday’s high and low are set. Trade smart, not emotional.
📈 Top-of-the-Market FOMO
You’ve seen it before. Just before the crash, the media frenzy begins. Influencers say “Don’t miss this pump!” or “99% will miss the next big move!” The ETF gods hint at new inflows. It's a setup.
They're not hyping it for your benefit—they're offloading their bags in your face.
Just look at the charts:
BlackRock bought billions to drive BTC to 121K.
Then, in 72 hours, they dumped billions.
Saylor? Silent. No new buys. That’s not coincidence—it’s coordination.
Response:
Check the MACD, RSI, and Stochastic RSI on daily or weekly timeframes. If they're maxed out and the influencers are screaming green—it’s probably too late.
When they stop buying, the dump is already planned.
🧰 How to Outsmart Them
Watch the MACD for crossovers and divergence.
Monitor RSI zones—don’t long into extreme overbought conditions.
Use Stoch RSI to anticipate momentum shifts.
Rule: When everything is overheated, and FOMO is peaking—step back. Let them dump into each other. You’ll get your entry later, cleaner and cheaper.
⚔️ This Is War
Make no mistake: this is a war for your money.
They want yours. You want theirs.
Only the smart survive.
To be continued.
DYOR.

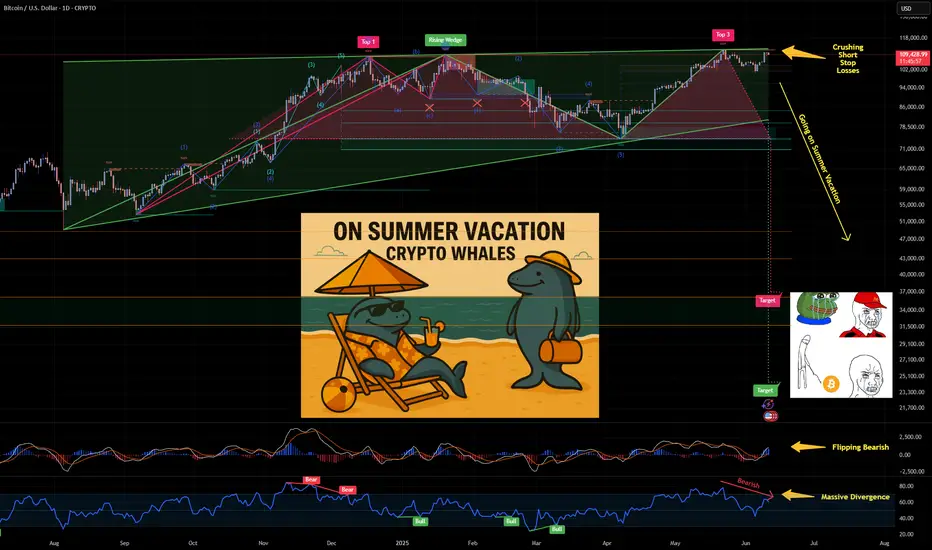
Bitcoin Whales Going On Summer Vacation🚨 Wake Up, Crypto World! 🚨
🔹 Bernstein calls $200K 🔹 CNBC eyes $130K 🔹 BlackRock boasts IBIT is the fastest-growing ETF 🔹 Saylor claims $1M BTC 🔹 Thiel-backed crypto exchange Bullish - has confidentially filed for a US IPO …
Does this sound like "Institutions secretly acquiring Bitcoin"?
NO. This sounds like a desperate call for exit liquidity.
The real accumulation already happened, behind closed doors, away from the headlines. Now they need buyers. Retail FOMO is their exit strategy.
Don't be fooled enjoy the Summer Vacation. 🌴
#Bitcoin #Crypto #ExitLiquidity #MarketCycles #TakeProfits
CRYPTO:BTCUSD INDEX:BTCUSD TVC:GOLD TVC:SILVER NASDAQ:COIN NASDAQ:MSTR
COINBASE and it's massive inverse head and shoulders...observed in Coinbase chart formation indicates it has potential to become a trillion-dollar enterprise!
With a Logarithmic projection heading towards $4000 per shares.
#COIN has a market cap off $66 Billion right now
It has as just entered the SP 500
Is in the process of receiving a Banking Licence
And is the main custodian for all the major #crypto ETF's
Those are the drivers why this is likely to be a four figure stock in the coming years.

$BTC, Bitcoin update: what is going on?🚨 Bitcoin Update: We've just seen a decent correction on CRYPTOCAP:BTC followed by a strong pump.
I’ve warned about this already — this pump is not organic. It's largely driven by institutions and Michael Saylor, using leverage.
📉 A healthy price movement should look like a staircase: move up, consolidate, reset the daily MACD, then push higher again.
Each rally should be followed by a slight pullback — that’s how sustainable trends are built.
❌ But this natural cycle is being disrupted.
Saylor and ETFs keep buying the top to prevent corrections. Some laugh and call it incompetence, but I believe it’s strategic.
These players don’t care about making money on trades.
Their goal is to inflate the value of their companies (or stock value), which are now heavily tied to Bitcoin’s price.
That’s why they don’t want BTC to consolidate.
Every time there's weakness, they step in to buy, preventing any pullback and forcing the price through resistances and fair value gaps.
🤖 The problem? Bots — which represent +80%+ of the trading volume — are not wired this way.
They sell when BTC is overbought and buy when it's oversold.
But with institutions disrupting this cycle, exchanges end up selling BTC, and whales scoop it up — leading to lower supply on exchanges.
Exchanges then have to buy BTC back at higher prices, sometimes even at a loss — often by printing billions in Tether (USDT) to compensate.
🎈 This entire mechanism is inflating Bitcoin’s price, exactly what Bitcoin maximalists want.
But it also kills the chance for an altseason, which usually comes after Bitcoin tops out.
📊 So what’s next?
Ideally, we get a consolidation to around $91K to avoid a major bearish divergence.
If BTC breaks below $90K, we could see GETTEX:82K — but given current conditions, that’s unlikely.
On the chart, RSI is high on daioly, Williams indicator is turning bearish and MACD too. These are all signs of a most needed consolidation. But as I explained, this is cancelled at the moment.
💰 Can institutions push BTC to a new all-time high?
Yes — they basically have unlimited capital and the money printer will turn back on by September.
But once again, altseason is postponed.
#Bitcoin #BTC #CryptoMarkets #MichaelSaylor #ETF #BTCAnalysis #Altseason #CryptoPump #MarketManipulation #BTCUpdate #Tether #CryptoWhales #DailyMACD #TechnicalAnalysis #CryptoInsights #Web3

Bitcoin: The Robot Taxi Driver We Didn’t NeedWhy Blockchain Is Driving the Future Without It
In the 1990 sci-fi classic Total Recall, Arnold Schwarzenegger’s character hails a futuristic taxi only to be greeted by “Johnny Cab”—a creepy, clunky robot driver that awkwardly talks while struggling to navigate.
Back then, audiences imagined a future where robotic taxi drivers would be commonplace. But instead, we got something far superior: fully autonomous, self-driving cars that render robot drivers unnecessary.
The same is happening with Bitcoin. It was revolutionary, sure—but much like Johnny Cab, it’s outdated, inefficient, and rapidly becoming irrelevant in a world driven by advanced blockchain technology.
Bitcoin: The Nostalgic First Step
When Bitcoin burst onto the scene, it felt groundbreaking—just like the idea of robot taxi drivers in the Total Recall era. It gave us a new way to transact, free from centralized banks. People were thrilled, seeing it as the future of money.
But here’s the problem: Bitcoin was never the endgame. It was merely the proof-of-concept—like Johnny Cab showing that, yes, you can put a robot behind the wheel… but does that mean we should?
As financial systems evolved, Bitcoin’s shortcomings became glaringly obvious:
✅ Slow transaction speeds
✅ High fees
✅ Lack of scalability
✅ Energy inefficiency
Meanwhile, blockchain technology—the real revolution—kept advancing, proving that we don’t actually need Bitcoin any more than we needed Johnny Cab.
Enter Blockchain: The Self-Driving System
Self-driving cars didn’t need robot taxi drivers, and blockchain doesn’t need Bitcoin.
Blockchain is the foundation—an autonomous, self-sustaining system that underpins everything from finance to supply chains to digital assets.
In fact, precious metals, equities, and commodities are all moving toward digitization—but not through Bitcoin. Instead, they’re being integrated directly into blockchain-based ecosystems that offer seamless, smart contract-driven transactions.
The result?
💨 Faster
💡 More efficient
🛠️ Scalable & adaptable
Bitcoin, on the other hand, is stuck in the past. It’s clunky, expensive, and increasingly unnecessary—just like a robot taxi driver frantically punching buttons while self-driving cars smoothly navigate the streets.
Why Bitcoin Will Be Left Behind
Much like how we skipped the “robot taxi driver phase” and went straight to autonomous vehicles, the financial world will soon skip Bitcoin entirely as blockchain technology takes over.
Everything digital is moving toward streamlined, automated systems—systems that don’t require Bitcoin as an intermediary.
So the real question isn’t, “Will Bitcoin survive?”
It’s: “Why would we even need it?”
Just like Johnny Cab in Total Recall, Bitcoin might be fun to look back on—but it’s not the future.
Blockchain is the self-driving car. Bitcoin is the unnecessary robot driver.
And in a world that values efficiency, guess which one we’re leaving behind? 🚗💨
INDEX:BTCUSD CRYPTO:BTCUSD NASDAQ:COIN NASDAQ:MSTR NASDAQ:MARA TVC:GOLD TVC:SILVER TVC:DXY SP:SPX NYSE:BLK NASDAQ:TSLA NYSE:GME INDEX:ETHUSD CRYPTO:XRPUSD CRYPTO:ADAUSD

Bitcoin $45k in 45 Days. Believe it or Watch It!Sometime people don't believe predictions because they need proof. Watch and learn people. Don't get caught holding the bag. Just ride the waves. No ema no alerts just market structure. I trade for fun and accuracy. This is a discipline sport so please watch and act accordingly. But this will play out exactly as expected. Go USA! #blackrock

Believe or Not- Blue SeasonBefore Donald Trump gets credit based on tariff's or anything like that I wanted to share the future of SPX 500 with everyone. It's definitely about to explode to a new all time high. Watch and learn. Market 101- Let's go USA!

BlackRock's Bitcoin ETF Can Be Unfolding A Bullish ImpulseBlackRock's Bitcoin ETF with ticker IBIT made a massive rally in 2024, which can be wave 3 of an ongoing five-wave bullish impulse. Despite the recent decline at the beginning of 2025, it's still above 42 invalidation level, and as long as it's above that level, it can be wave 4 correction, so we may still see that 5th wave this year.
The Elliott Wave Principle is a form of technical analysis that identifies patterns in market movements. A bullish impulsive wave is one of the most important and common wave structures in an uptrend. It describes how prices typically move in the direction of the main trend. A bullish impulsive wave consists of five waves labeled 1, 2, 3, 4, 5.

The BKRRF Chart is Truly Impressive Error at end of video. I believe I said 375 million would be the market capitalization in the best case price projection scenario. It is in fact, 3.75 billion, which is certainly not out of the question.
