BNB — Ascending Channels, Shakeout Pattern & Bull Market OutlookIn 2018 BNB formed a clear ascending channel. After moving inside this structure for several years, the market experienced a sharp shakeout in March 2020, which became the final capitulation before a major trend reversal. By late 2020 the price broke out above the channel, confirming the beginning of a strong bull market.
Since 2021 a new ascending channel has been forming. I expect a corrective move toward the lower boundary of this channel in the $300–$350 area. A similar shakeout to what happened in March 2020 may occur again around 2026, potentially acting as a final reset before the next major uptrend.
After this pullback, the next bullish phase could begin, with long-term targets in the $4,000–$5,000 range.
Key points:
2018: formation of the first ascending channel.
March 2020: sharp shakeout → final reset before the bull run.
Late 2020: breakout above the channel → start of the bullish cycle.
2021–present: formation of a new ascending channel.
Expected: retrace to $300–$350 + possible 2026 shakeout.
Long-term target: $4K–$5K after the new bull run begins.
Bnbanalysis

FireHoseReel | BNB Daily Analysis #23🔥 Welcome To FireHoseReel !
Let’s dive into Binance Coin (BNB) analysis.
👀 BNB 4H Overview
BNB has broken its newly formed support, activating our pre-breakout trigger with a strong 4-hour candle. Price is now moving toward the bottom of the range.
📊 Volume Analysis
After breaking the multi-timeframe support highlighted in the previous analysis, BNB’s volume increased significantly. If selling pressure continues, price could extend its move toward the range low.
✍️ BNB Trading Scenarios
🟢 Long Scenario:
A break above $876, accompanied by rising buying volume, strong momentum, and a fakeout of the current zone, could offer a long opportunity. This setup is high risk, so if taking a long, a maximum risk of 0.25% is recommended.
🔴 Short Scenario:
Waiting for BNB to form a new structure and identify fresh trigger zones would be the more logical approach for short positions. We remain patient until clearer short setups appear.
🧠 Protect your capital first. No setup is worth blowing your account. If risk isn’t controlled, profit means nothing. Trade with rules, not emotions.

FireHoseReel | BNB Daily Analysis #22🔥 Welcome To FireHoseReel !
Let’s dive into BinanceCoin (BNB) analysis.
👀 BNB 1D Overview
On the daily timeframe, BNB is forming a trading range of roughly 10%. If this structure continues, it will likely develop into a clear daily box and consolidation zone. The upper boundary of this range is at $923, while the lower boundary is at $823.
📊 Volume Analysis
After printing an ATH at $1,376, BNB’s volume dropped sharply. With volume currently compressed, the next expansion in volume could trigger a move larger than expected.
✍️ BNB Trading Scenarios
🟢 Long Scenario 1:
A break above $923, which marks the top of the trading range, accompanied by strong buying volume confirmation, could provide a solid long setup on BNB.
🔴 Short Scenario:
A break below $823, the bottom of the trading range, confirmed by increasing selling volume, could offer a valid short opportunity on BNB.
🧠 Protect your capital first. No setup is worth blowing your account. If risk isn’t controlled, profit means nothing. Trade with rules, not emotions.

FireHoseReel | BNB Daily Analysis #21🔥 Welcome To FireHoseReel !
Let’s dive into BinanceCoin (BNB) analysis.
👀 BNB 4H Overview
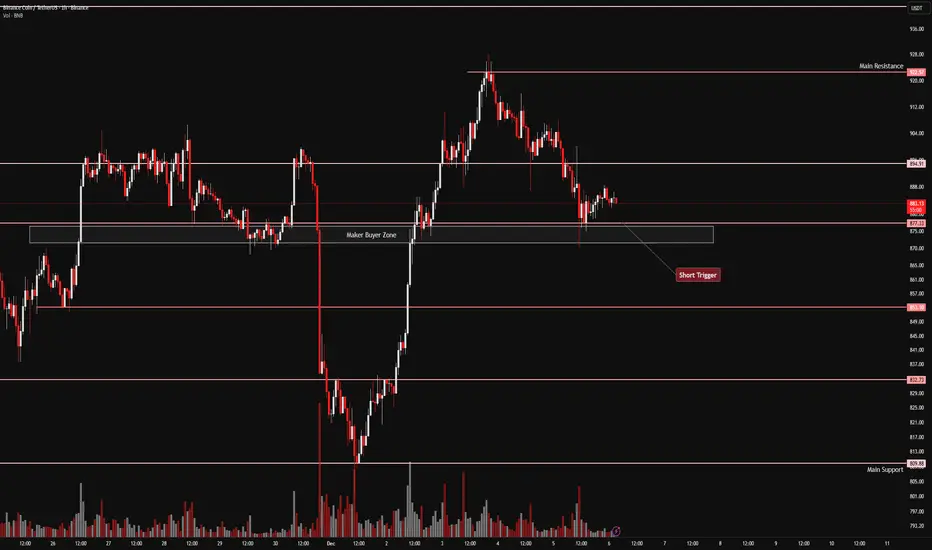
BNB was trading inside a 4H range where I had marked two trigger zones. The short trigger was activated with a strong sell-off candle, and a new trigger zone has now formed around $849.
📊 Volume Analysis
After losing the multi-timeframe support at $877, BNB’s volume shifted into strong selling pressure. This sell pressure slowed down as market makers stepped in around the $850 area.
✍️ BNB Trading Scenarios
🟢 Long Scenario:
A breakout above the multi-timeframe resistance at $899, supported by rising buy volume, could activate the long trigger. If $923 breaks, the position can be held for continuation.
🔴 Short Scenario:
If the market maker buy zone fails and support at $849 is lost with renewed selling pressure, the short trigger will be activated.
🧠 Protect your capital first. No setup is worth blowing your account. If risk isn’t controlled, profit means nothing. Trade with rules, not emotions.

FireHoseReel | BNB Daily Analysis #20🔥 Welcome To FireHoseReel !
Let’s dive into BinanceCoin (BNB) analysis.
👀 BNB 1H Overview
BNB is currently trading inside a small 1-hour range. A breakout from this box could expand the move and transition price action into a 4H structure. On the 1H timeframe, BNB is still trading below its main long trigger zone.
📊 Volume Analysis
During the holiday period, BNB volume declined. However, as we approach the end of the holidays, any increase in volume during the breakout can act as confirmation and justify entering a trade.
✍️ BNB Trading Scenarios
🟢 Long Scenario:
A breakout above $899 with volume confirmation could offer an early long opportunity. If the major resistance at $923 breaks, this position can be held for continuation.
🔴 Short Scenario:
A breakdown below the newly formed support at $861, confirmed by volume, could trigger an early short setup. If price then loses $810, the move can be extended to the downside.
🧠 Protect your capital first. No setup is worth blowing your account. If risk isn’t controlled, profit means nothing. Trade with rules, not emotions.

FireHoseReel | BNB Daily Analysis #19🔥 Welcome To FireHoseReel !
Let’s dive into BinanceCoin (BNB) analysis.
👀 BNB 4H Overview
BNB is currently moving inside a consolidation box on the 4H timeframe, with volume steadily decreasing inside this range. A breakout from either the top or bottom of the box could trigger a strong move. Price is now approaching the key resistance at $915.
📊 Volume Analysis
Price pushed into resistance with a clear volume divergence, and after sellers stepped in with increased selling volume, BNB was rejected downward. If selling volume continues to rise, the newly-formed support zone may break, allowing price to move lower.
✍️ BNB Trading Scenarios
🟢 Long Scenario 1:
A breakout above $915 with strong buying volume and a volatility-range break above 61.63 can provide a solid long setup.
🔴 Short Scenario:
A breakdown of the newly-formed multi-timeframe support at $864, confirmed by increasing selling volume, can create a valid short opportunity.
🧠 Protect your capital first. No setup is worth blowing your account. If risk isn’t controlled, profit means nothing. Trade with rules, not emotions.

FireHoseReel | BNB Daily Analysis #19🔥 Welcome To FireHoseReel !
Let’s dive into BinanceCoin (BNB) analysis.
👀 BNB 1H Overview
BNB reacted to its resistance yesterday and activated its long trigger. It is now still struggling with the same resistance zone, while we have slightly moved the resistance higher for the new trigger.
📊 Volume Analysis
BNB volume has formed a divergence with price. A clear resistance breakout requires rising buy volume for confirmation. Keep in mind that all valid breakouts need volume convergence—otherwise, a fakeout is very likely.
✍️ BNB Trading Scenarios
🟢 Long Scenario:
A breakout above the current resistance at $904, supported by increasing buy volume, could open a valid long setup.
🔴 Short Scenario:
A breakdown below the maker-buyer low at $877, confirmed with strong selling pressure on the 1H timeframe, could activate a short setup.
🧠 Protect your capital first. No setup is worth blowing your account. If risk isn’t controlled, profit means nothing. Trade with rules, not emotions.

FireHoseReel | BNB Daily Analysis #18🔥 Welcome To FireHoseReel !
Let’s dive into BinanceCoin (BNB) analysis.
👀 BNB 1H Overview
BNB is still holding the same position as yesterday, and due to the holiday period, the market hasn’t shown major changes. I’ve only adjusted the newly formed resistance slightly and moved it to $898.22.
📊 Volume Analysis
BNB volume was very low yesterday, but today it’s showing a moderate increase. Sundays usually bring more activity than Saturdays, so with rising volume, any trigger activation could lead to a faster move.
✍️ BNB Trading Scenarios
🟢 Long Scenario:
A breakout above the newly formed resistance at $898.22, supported by rising buy volume, could act as a risky long trigger. The next key long level lies around $922.57.
🔴 Short Scenario:
A 15-minute base has formed in this zone, which may offer a quick entry with a tight stop. The main short trigger is at $877.33—a confirmed break with volume could validate a short entry.
🧠 Protect your capital first. No setup is worth blowing your account. If risk isn’t controlled, profit means nothing. Trade with rules, not emotions.

FireHoseReel | BNB Daily Analysis #17🔥 Welcome To FireHoseReel !
Let’s dive into BinanceCoin (BNB) analysis.
👀 BNB 1H Overview
After the recent drop, BNB is currently ranging between $895 and $877. A breakdown below the range floor could trigger a deeper correction. This support also aligns with the 38% Fibonacci retracement, making it a valid technical level.
📊 Volume Analysis
Volume increased during the sell-off, then dropped sharply in momentum. A strong sell-off candle hit the maker-buyer zone, followed by range consolidation. Due to the holiday period, volume conditions remain weak.
✍️ BNB Trading Scenarios
🟢 Long Scenario:
A breakout above the range high at $922 could activate the next long trigger.
🔴 Short Scenario:
A breakdown of the current floor (maker-buyer zone), potentially driven by a long squeeze and sudden volatility spike, could open the door for a short entry after a pullback with tighter risk.
🧠 Protect your capital first. No setup is worth blowing your account. If risk isn’t controlled, profit means nothing. Trade with rules, not emotions.
FireHoseReel | BNB Daily Analysis #15🔥 Welcome to FireHoseReel!
Let’s dive into the Binance Coin (BNB) analysis.
👀 BNB – 1H Overview
BNB has successfully activated its long trigger and is now moving higher.
At the moment, BNB is forming a higher low compared to the previous bottom, which strengthens the bullish structure and keeps the upside continuation in play.
📊 Volume Analysis
After the long trigger was activated, BNB volume increased strongly, supporting the upward move.
If buying pressure remains sustained, BNB can continue its rally toward the next key resistance zone.
✍️ BNB Trading Scenarios
🟢 Long Scenario
The main long trigger is already active.
However, the risk-on long trigger will activate with a break above the current high, offering a more aggressive continuation setup.
🔴 Short Scenario
If BNB forms a lower high and a lower low below the $895 level, strong selling pressure could emerge.
That said, on the 4H timeframe, there is still a high probability that this short scenario may fail.
FireHoseReel | BNB Daily Analysis #14🔥 Welcome to FireHoseReel!
Let’s dive into the Binance Coin (BNB) analysis.
👀 BNB – 4H Overview
BNB is currently trading just below its major resistance at $900, a level that holds both strong psychological and technical importance.
A clean break above this zone could activate our primary long trigger.
📊 Volume Analysis
During the recent market crash, BNB faced heavy selling pressure, followed by strong buyer absorption, which allowed price to recover with rising buy volume.
If this buy-side momentum remains sustained, BNB will have a strong chance to break above the $900 resistance.
✍️ BNB Trading Scenarios
Here are the active scenarios you can use alongside your own trading strategy:
🟢 Long Scenario (Breakout Setup)
A confirmed breakout above $900, supported by a clear increase in buy volume, can provide a solid long entry opportunity.
🟢 Long Scenario (Low-Risk, Fast R:R Setup)
For traders seeking tight stops and quick risk-to-reward, wait for price to consolidate, then enter during the pullback with decreasing volume, followed by the first signs of volume expansion.
🔴 Short Scenario
A breakdown below $872, followed by the formation of a lower high, could create a multi-timeframe bearish structure. A confirmed structure break on that pattern may open a short setup.
❤️ Risk Management & Emotional Discipline
Crypto trading is highly risky. Without proper risk management and emotional control, trading is no different from gambling.
Logic must always come before emotions. Learn to manage your trades, and enjoy the process of trading with control and discipline.
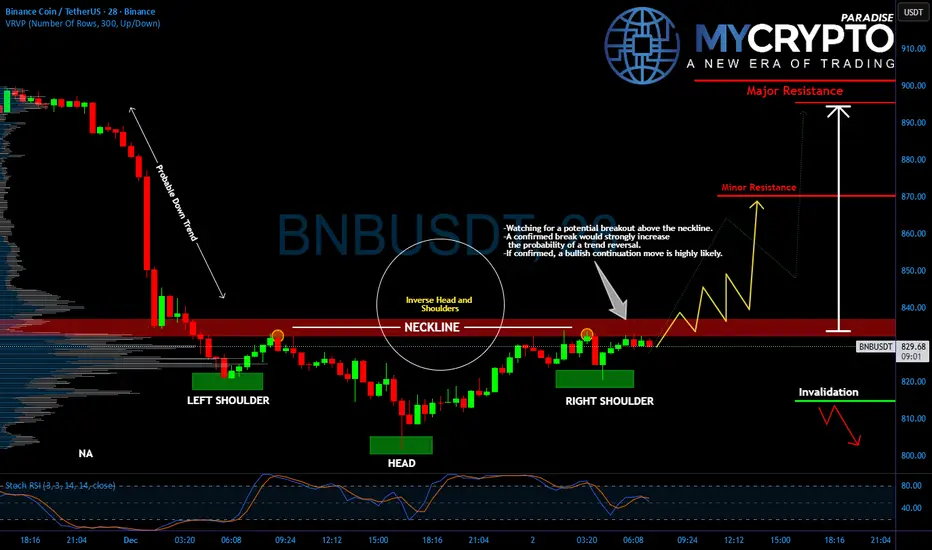
BNB Bulls Near Breakout: Reversal Pattern Emerges
Yello, Paradisers, is this the turning point for BNB? After the recent brutal drop, signs of a powerful reversal are emerging, and what we’re seeing now could trap late sellers in a dangerous spot.
💎#BNBUSDT has formed a textbook inverse head and shoulders pattern, signaling a potential bullish reversal after a steep downtrend. The neckline around the $834–$836 level has become a critical zone to watch. Price is currently testing this area, and a confirmed breakout above it could trigger a strong continuation move.
💎This structure forms after a sharp downtrend and often acts as a springboard for upside momentum when confirmed. If #BNB manages to break and hold above the neckline with volume, the next target lies near $870, minor resistance, with the $890–$900 zone acting as major resistance.
💎However, if bulls fail to break out and the price gets rejected from the neckline again, we could see a retracement back toward the $810 invalidation level, which would weaken the reversal setup and put short-term downside back in play.
💎The Stochastic RSI is also approaching overbought territory, suggesting bulls need to act quickly before momentum fades. Volume confirmation remains key here.
Stay sharp, the setup is clean, but it’s also a classic trap zone.
MyCryptoParadise
iFeel the success🌴
FireHoseReel | BNB Daily Analysis #11🔥 Welcome To FireHoseReel !
Let's dive into BinanceCoin ( BNB ).
👀 BNB is currently attempting to break a strong support zone at $873. A confirmed breakdown of this level could activate our short trigger.
📊 BNB volume has dropped sharply. One key reason is a completed multi-timeframe distribution structure, along with the impact of the current holiday period. The first strong volume expansion will likely define the next price direction.
🧮 The RSI oscillator remains in the 36.5 range, similar to yesterday. A breakout from this range, aligned with volume expansion, would confirm momentum entering BNB’s next move.
✍️ I will update the scenarios for you, though they remain mostly unchanged from yesterday, with only minor shifts in support levels.
🔴 Short Scenario: A clean break below the marked support with rising sell volume can provide a valid short setup. However, without RSI confirmation, risk should be reduced due to the possibility of a fake breakdown.
🛞 Risk Management & Disclaimer
Please remember to always use proper risk management and position sizing. Nothing in this analysis is financial advice. The market can change quickly, so always trade based on your own strategy, research, and risk tolerance. You are fully responsible for your own trades.

FireHoseReel | BNB Daily Analysis #10🔥 Welcome To FireHoseReel !
Let's dive into BinanceCoin Structure Analysis.
👀 On the 1H timeframe, BNB failed to activate our long trigger and has now broken its key support at $875, closing a candle below this level.
📊 BNB volume has dropped sharply, which actually helps clarify the chart. Whenever volume contracts like this, it often signals that the next major move is getting closer.
🧮 The RSI oscillator is now near its oversold zone.
If RSI breaks below and holds under the 36.5 level, it can accelerate bearish momentum and strengthen the downside move.
✍️ Below are the key scenarios for BNB, which you can use alongside your own trading setup:
🟢 Long Scenario:
A breakout above $902 with rising buy volume.
🔴 Short Scenario:
A break below $875 with increasing sell volume, combined with RSI falling below 36.5, can provide a clean short or exit setup.
🛞 Risk Management & Disclaimer
Please remember to always use proper risk management and position sizing. Nothing in this analysis is financial advice. The market can change quickly, so always trade based on your own strategy, research, and risk tolerance. You are fully responsible for your own trades.

BNB/USDT 1H AnalysisHi
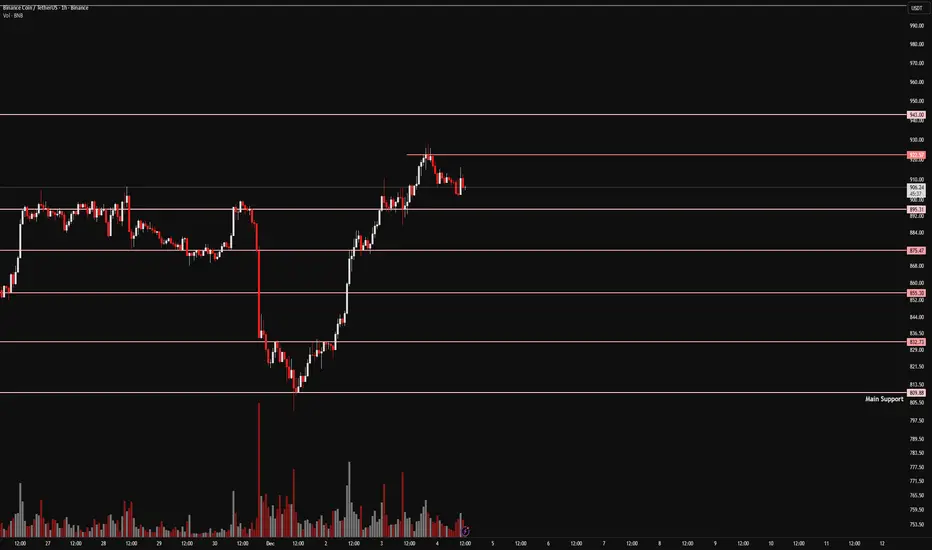
After a prolonged downtrend, BNB has broken its descending trendline, signaling a shift from bearish to bullish momentum. The price formed a symmetrical triangle pattern, completing at point D, which coincides with the lower boundary of the rising channel. Since then, BNB has been trading inside a clearly defined ascending channel, respecting both support and resistance levels.
Recently, a bullish flag has formed, representing a consolidation after a strong upward impulse. A breakout from this flag suggests continuation towards the upper channel boundary near $940–950. Support lies around $880, aligning with both the flag’s lower boundary and the channel’s midline.

$BNB Eyes Rebound on U.S. Shutdown End and Rate Cuts PotentialBNB Chain’s native token, BNB, slipped below the $1,000 mark in the past 24 hours, dropping to lows near $974 amid a surge in trading volume nearly 88% above its daily average. The move signals short-term bearish sentiment as traders react to broader crypto market weakness.
However, macro fundamentals could soon favor a rebound. With the U.S. government shutdown reportedly nearing resolution and investors widely anticipating a Federal Reserve rate cut in December, liquidity conditions are expected to improve. Lower interest rates typically reduce the cost of capital, boosting investor appetite for risk assets like cryptocurrencies. As liquidity flows back into the market, altcoins such as BNB may see renewed buying pressure.
Technically, BNB broke out of a long-term ascending channel despite the recent sell-off. The $950–$970 zone is acting as a strong support area, acting as a retest to the break-out of the ascending channel. A sustained support of this level could set the stage for a rebound toward $1,375 previous high, the next major resistance and prior high. Conversely, a breakdown and a candle close below $900 could open the door to deeper losses near $900 or lower.
Analysts remain divided. “Short-term volatility doesn’t shake BNB’s fundamentals,” said Jake A. from AIC Labs. “As long as on-chain activity and ecosystem growth continue, the long-term picture remains intact.”
In summary, while BNB faces immediate technical resistance at $1,000, easing macro pressures and a confirmed support base could ignite the next rally toward $1,375 as traders position for a more dovish Fed.

BNB: Inverse Head & Shoulders & Rising Channel StructureHi!
BNB has completed a clear inverse Head & Shoulders pattern at the bottom, with the neckline successfully reclaimed. After the breakout, the price is now moving inside a well-defined rising channel, showing steady bullish momentum.
The market has pulled back toward the midline of the channel, which lines up with previous neckline structure. If this support holds, the next leg higher remains the primary scenario.
Your projection highlights two key points:
A potential higher low forming inside the channel
Continuation toward the 1,031 resistance, with room for an extension toward the top of the channel
As long as the price respects the ascending structure and stays above the neckline/green zone, the bullish outlook remains intact.

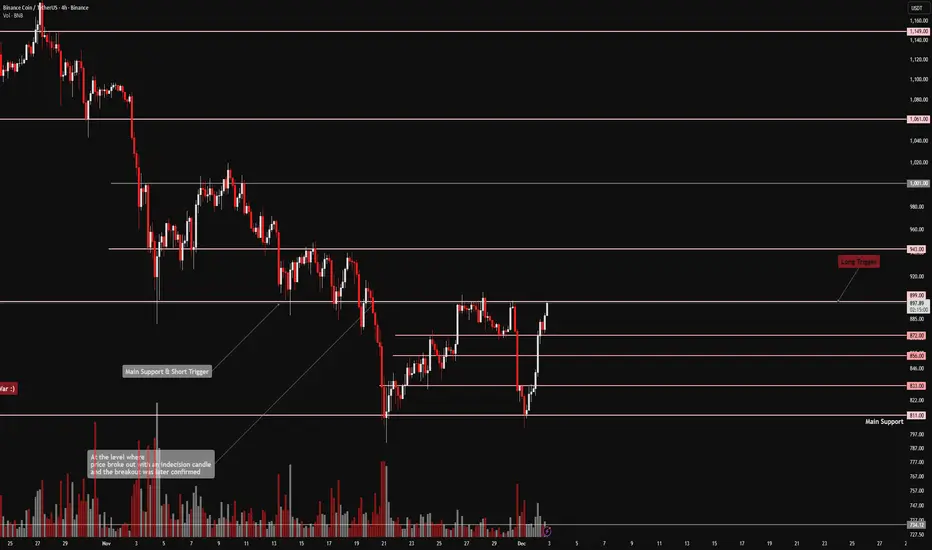
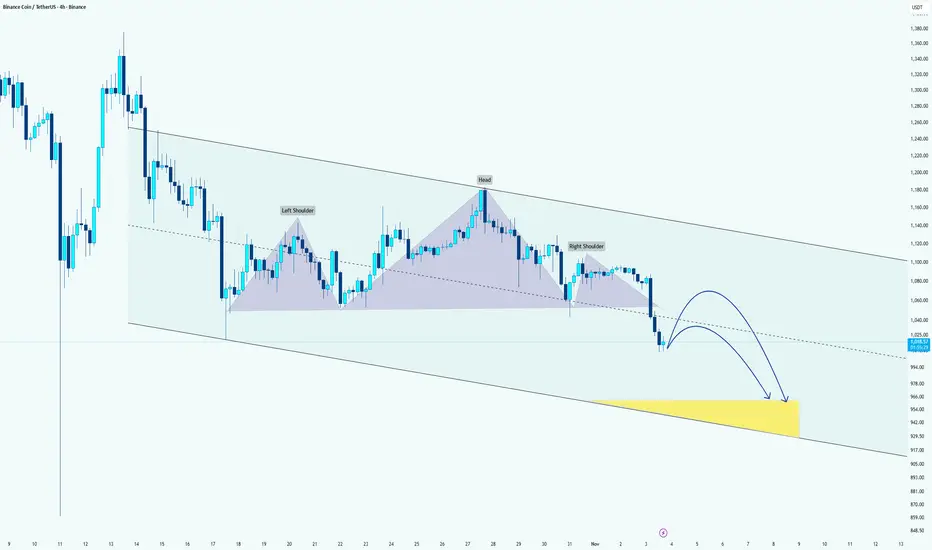
BNB Forming Head & Shoulders Breakdown Within Descending ChannelHi!
The chart shows a descending channel, indicating that the broader trend remains bearish. Inside this channel, we can see a Head and Shoulders pattern that recently broke below its neckline, confirming a potential continuation of the downtrend.
After the neckline breakout, price pulled back slightly but continues to trade under the broken support. The two projected blue curves suggest a possible short-term retracement toward the neckline or mid-range of the channel, followed by another move to the downside.
The yellow highlighted area marks a strong target/support zone between roughly $950–$970, which aligns with:
The bottom boundary of the descending channel, and
The measured move projection from the Head and Shoulders pattern.
As long as the price stays below the neckline and within the channel, the bearish bias remains intact. A clean break above the neckline could temporarily invalidate this scenario and lead to a relief rally, but overall, momentum favors a continuation toward the lower support zone.
BNB SHORTThe wave (3) traveled 162% of the distance, reached the trend line of the structure, and realized the potential of the wave (4) on a logarithmic scale. It's time for correction. Given the momentum formation scenario, this is the best point for a reversal on the chart.

BNBUSDTBINANCE:BNBUSDT is Bull-trend and we may buyer in any correction.
Best support: Now level - 1150 - 1075 - 975
Seve profit in levels: 1275 - 1350 - 1400
P;ease control Risk management.⚠️

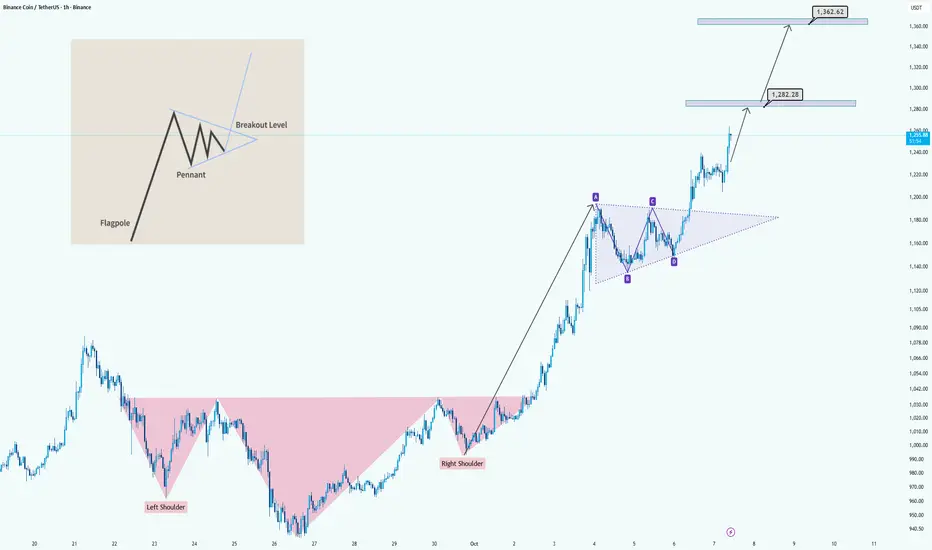
BNB/USDT: Bullish Breakout from H&S and Pennant FormationHi guys!
The chart clearly shows a bullish structure forming after a strong upward move. Initially, the price completed an Inverse Head and Shoulders pattern , signaling a potential trend reversal from bearish to bullish. After the breakout above the neckline, the market continued to climb and started consolidating into a bullish pennant pattern , a continuation setup that typically follows a sharp rally (flagpole).
The pennant breakout confirms renewed bullish momentum, suggesting the next leg higher is underway. Based on the flagpole projection, the measured targets are around $1,282 for the first resistance zone and $1,362 as the extended upside target.
In summary:
Patterns identified: Inverse Head and Shoulders + Bullish Pennant
Trend direction: Bullish continuation
Targets: $1,282 and $1,362
Outlook: Positive as long as price holds above the pennant breakout level
BINANCE HIGH PROBABILITY SETUP SOON!!!🚨 BINANCE HIGH PROBABILITY BUY SETUP 🚨
* Here We Can See Clearly The Next Potential Move For BNBUSD Coming Hours/Days.
* Keep Your Eyes Close On Your Trading Positions.
* Happy PIP Hunting Traders.
FXKILLA.

BNB/USDT: Bullish Climb to 965?As the previous analysis worked exactly as predicted, BINANCE:BNBUSDT is gearing up for a bullish move on the 4-hour chart , with an entry zone between 859-868 near a key support and trendline.
First target at 930 marks initial resistance, while the second at 965 signals a potential breakout. Set a stop loss on a daily close below 840 to manage risk effectively. 🌟
A break above 875 with solid volume could trigger this climb, driven by BNB ecosystem news and market momentum. Watch BTC trends! 💡 Ready for this rise? Drop your take below! 👇
📝 Trade Plan:
✅ Entry Zone: 859 – 868 (support + trendline area)
❌ Stop Loss: Daily close below 840 to manage risk
🎯 Target 1: 930 (initial resistance)
🎯 Target 2: 965 (potential breakout zone)
Ready for this rise? Drop your take below! 👇
