BNB's Situationhe triangle pattern will break in the direction it is breached, and the price will move in that direction. In my opinion, the price could be bullish and may up to $970.
Best regards CobraVanguard.💚
BNBUSDT

BNB — Ascending Channels, Shakeout Pattern & Bull Market OutlookIn 2018 BNB formed a clear ascending channel. After moving inside this structure for several years, the market experienced a sharp shakeout in March 2020, which became the final capitulation before a major trend reversal. By late 2020 the price broke out above the channel, confirming the beginning of a strong bull market.
Since 2021 a new ascending channel has been forming. I expect a corrective move toward the lower boundary of this channel in the $300–$350 area. A similar shakeout to what happened in March 2020 may occur again around 2026, potentially acting as a final reset before the next major uptrend.
After this pullback, the next bullish phase could begin, with long-term targets in the $4,000–$5,000 range.
Key points:
2018: formation of the first ascending channel.
March 2020: sharp shakeout → final reset before the bull run.
Late 2020: breakout above the channel → start of the bullish cycle.
2021–present: formation of a new ascending channel.
Expected: retrace to $300–$350 + possible 2026 shakeout.
Long-term target: $4K–$5K after the new bull run begins.

FireHoseReel | BNB Daily Analysis #23🔥 Welcome To FireHoseReel !
Let’s dive into Binance Coin (BNB) analysis.
👀 BNB 4H Overview
BNB has broken its newly formed support, activating our pre-breakout trigger with a strong 4-hour candle. Price is now moving toward the bottom of the range.
📊 Volume Analysis
After breaking the multi-timeframe support highlighted in the previous analysis, BNB’s volume increased significantly. If selling pressure continues, price could extend its move toward the range low.
✍️ BNB Trading Scenarios
🟢 Long Scenario:
A break above $876, accompanied by rising buying volume, strong momentum, and a fakeout of the current zone, could offer a long opportunity. This setup is high risk, so if taking a long, a maximum risk of 0.25% is recommended.
🔴 Short Scenario:
Waiting for BNB to form a new structure and identify fresh trigger zones would be the more logical approach for short positions. We remain patient until clearer short setups appear.
🧠 Protect your capital first. No setup is worth blowing your account. If risk isn’t controlled, profit means nothing. Trade with rules, not emotions.

FireHoseReel | BNB Daily Analysis #22🔥 Welcome To FireHoseReel !
Let’s dive into BinanceCoin (BNB) analysis.
👀 BNB 1D Overview
On the daily timeframe, BNB is forming a trading range of roughly 10%. If this structure continues, it will likely develop into a clear daily box and consolidation zone. The upper boundary of this range is at $923, while the lower boundary is at $823.
📊 Volume Analysis
After printing an ATH at $1,376, BNB’s volume dropped sharply. With volume currently compressed, the next expansion in volume could trigger a move larger than expected.
✍️ BNB Trading Scenarios
🟢 Long Scenario 1:
A break above $923, which marks the top of the trading range, accompanied by strong buying volume confirmation, could provide a solid long setup on BNB.
🔴 Short Scenario:
A break below $823, the bottom of the trading range, confirmed by increasing selling volume, could offer a valid short opportunity on BNB.
🧠 Protect your capital first. No setup is worth blowing your account. If risk isn’t controlled, profit means nothing. Trade with rules, not emotions.

BNBUSDT – Small Chart Update
BNB is holding above the rising support zone.
As long as price stays above $850–860, upside toward $920 → $1,000+ remains possible; a break below support may lead to a deeper pullback.
DYOR | NFA.

BNBUSDT – 4H Chart Update:
BNB is pulling back into the ascending channel support around 840–850, which is a key demand zone.
If this support holds, a bounce toward 900–920 is likely. A breakdown below the channel may open downside toward 810.
DYOR | NFA.

FireHoseReel | BNB Daily Analysis #21🔥 Welcome To FireHoseReel !
Let’s dive into BinanceCoin (BNB) analysis.
👀 BNB 4H Overview
BNB was trading inside a 4H range where I had marked two trigger zones. The short trigger was activated with a strong sell-off candle, and a new trigger zone has now formed around $849.
📊 Volume Analysis
After losing the multi-timeframe support at $877, BNB’s volume shifted into strong selling pressure. This sell pressure slowed down as market makers stepped in around the $850 area.
✍️ BNB Trading Scenarios
🟢 Long Scenario:
A breakout above the multi-timeframe resistance at $899, supported by rising buy volume, could activate the long trigger. If $923 breaks, the position can be held for continuation.
🔴 Short Scenario:
If the market maker buy zone fails and support at $849 is lost with renewed selling pressure, the short trigger will be activated.
🧠 Protect your capital first. No setup is worth blowing your account. If risk isn’t controlled, profit means nothing. Trade with rules, not emotions.

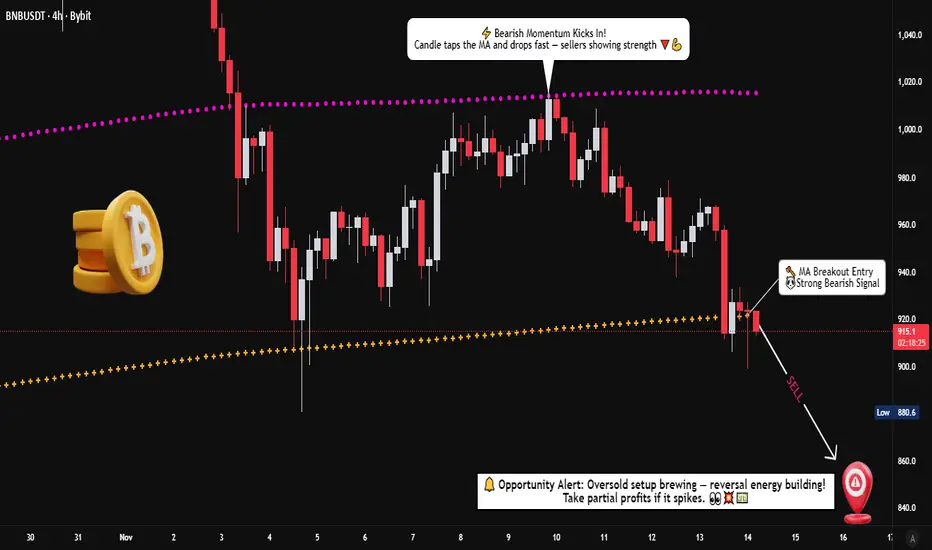
BNB/USDT – Momentum Shift Indicates Controlled Bearish Pressure📊 BNB/USDT: CRYPTO MARKET OPPORTUNITY BLUEPRINT | Swing Trade Analysis
🎯 TRADE SETUP OVERVIEW
Asset: BNB/USDT (Binance Coin vs Tether)
Timeframe: Swing Trade
Bias: 🔴 BEARISH | Confirmed via Weighted Moving Average Dynamic Support Breakout
📍 ENTRY STRATEGY: LAYERING METHOD
Entry Approach: Multiple Limit Order Layering (Dollar-Cost Average Entry Style)
Layer 1: $960.0 (Initial Entry)
Layer 2: $940.0 (Add Position)
Layer 3: $920.0 (Scale Entry)
💡 Customize layer levels based on your risk tolerance & capital allocation
🛑 STOP LOSS (SL)
Thief OG's SL Level: 🎪 $970.0
⚠️ CRITICAL: Place SL only after breakout confirmation is validated on price action
📌 Disclaimer: Adjust SL based on your personal strategy & risk management rules. This is YOUR capital at risk.
🎁 PROFIT TARGET (TP)
Target Level: 🏁 $850.0
Why This Level?
✅ Moving Average acts as strong resistance zone
✅ Overbought conditions present
✅ Previous support-turned-resistance trap identified
✅ Optimal risk-to-reward structure
📌 Disclaimer: This is a reference target. Take profits at YOUR discretion. Partial profit-taking recommended.
🔗 CORRELATED PAIRS TO MONITOR
Direct Correlations (High Impact)
1. ETH/USDT (Ethereum) - 📈 POSITIVE CORRELATION
Why Watch: BTC & ETH dominance typically drives altcoin movement
Key Point: If ETH breaks down, BNB often follows within 2-4 hours
Action: Use as confirmation signal for BNB downtrend continuation
2. BTC/USDT (Bitcoin) - 📈 POSITIVE CORRELATION
Why Watch: Bitcoin is the market leader; BNB is highly correlated
Key Point: Major Bitcoin support/resistance breaks precede BNB moves
Action: Monitor BTC for early trend reversal signals
3. BNB/BTC (Binance Coin vs Bitcoin) - 🔄 RELATIVE STRENGTH
Why Watch: Shows BNB's strength independently from Bitcoin
Key Point: If BNB/BTC weakens while BTC holds, downtrend is stronger
Action: Confirmation of bearish bias strength
Secondary Watch Pairs (Market Context)
4. USDT Dominance - 💰 INVERSE CORRELATION
Key Point: Rising USDT dominance = increased selling pressure on alts
Action: Check Tether flows into/out of BNB pairs
5. Crypto Fear & Greed Index - 📊 SENTIMENT INDICATOR
Why Watch: Extreme readings often precede reversals
Key Point: Greedy sentiment before drops = trap setup (like here)
Action: Validate bearish thesis with sentiment extremes
⚡ RISK MANAGEMENT CHECKLIST
✅ Breakout confirmation required before entry
✅ Risk:Reward ratio minimum 1:2 for this setup
✅ Position size = (Account Risk % × Capital) ÷ (Entry - SL)
✅ Scale entries across 3 layers to reduce slippage
✅ Monitor correlations for early exit signals
✅ Take profits in tiers: 33% at 900.0 | 33% at 875.0 | 34% at 850.0
📊 Summary
BNB has shifted into a bearish structure after losing dynamic support. With a layered entry method, flexible SL/TP management, and clear correlation signals across major crypto assets, this setup provides a properly structured swing opportunity for disciplined traders.
BNB/USDT Setup – Will the Moving Average Confirm the Bull Move?💎 BNB/USDT – "BINANCE COIN VS TETHER" 💰
Crypto Market Opportunity Blueprint (Swing Trade)
📈 Plan: BULLISH
After a period of compression within a triangular structure, BNB is preparing for a potential breakout. The breakout above the triangular moving average could trigger a new bullish wave — offering a solid opportunity for swing traders!
💥 Entry:
✅ Any price level after confirmed breakout above the triangular moving average.
Patience = profits. Wait for confirmation to avoid fake moves.
🛑 Stop Loss:
This is the “Thief SL” @ 920.0 💀
⚠️ Note: Dear Ladies & Gentlemen (Thief OG’s) — adjust SL based on your strategy & risk appetite. Place it only after breakout confirmation, not before!
🎯 Target:
The moving average acts as a strong resistance zone, combined with overbought signals and potential trap activity.
Our target: @ 1120.0 💰
💬 Take profits smartly — your capital, your rules.
🧭 Related Pairs to Watch (Correlation Insight)
🔹 BINANCE:BTCUSDT – Bitcoin’s momentum drives most altcoin sentiment. A BTC breakout usually strengthens BNB bullish continuation.
🔹 BINANCE:ETHUSDT – Ethereum & Binance Coin often move in tandem within similar risk cycles; ETH strength confirms market-wide bullish tone.
🔹 BINANCE:SOLUSDT – Competes in smart-contract dominance; if SOL rallies, BNB tends to mirror short-term volatility shifts.
🔹 BINANCE:BNBBTC – Tracks BNB’s relative strength against BTC. Watch for BNB outperforming BTC — a hidden signal of accumulation by whales.
⚡ Key Points
Volume confirmation is crucial ⚙️
Wait for candle close above MA 🕒
Manage risk; don’t blindly copy setups 🚫
Follow the trend, not emotions 💭
🧠 Final Note:
This is not financial advice. Trade wisely, respect your plan, and remember — smart exits matter more than perfect entries.
🚀 Stay patient, stay sharp — Thief OG’s never chase, they calculate.

FireHoseReel | BNB Daily Analysis #20🔥 Welcome To FireHoseReel !
Let’s dive into BinanceCoin (BNB) analysis.
👀 BNB 1H Overview
BNB is currently trading inside a small 1-hour range. A breakout from this box could expand the move and transition price action into a 4H structure. On the 1H timeframe, BNB is still trading below its main long trigger zone.
📊 Volume Analysis
During the holiday period, BNB volume declined. However, as we approach the end of the holidays, any increase in volume during the breakout can act as confirmation and justify entering a trade.
✍️ BNB Trading Scenarios
🟢 Long Scenario:
A breakout above $899 with volume confirmation could offer an early long opportunity. If the major resistance at $923 breaks, this position can be held for continuation.
🔴 Short Scenario:
A breakdown below the newly formed support at $861, confirmed by volume, could trigger an early short setup. If price then loses $810, the move can be extended to the downside.
🧠 Protect your capital first. No setup is worth blowing your account. If risk isn’t controlled, profit means nothing. Trade with rules, not emotions.

BNBUSDT – Swing UpAlright traders, it’s FOMC day,
a.k.a. the day the market decides whether we pump, dump, or emotionally collapse together. 😂
But here’s the plan:
If we get a major pump to the upside,
I definitely want to be in this trade —
because BNB has that quiet confidence like:
“Yeah, I can move if I want to.”
There’s a real chance we turn bullish today…
a small chance, but hey — it exists!
And in crypto, that’s basically a guarantee. 😅
So what’s the target?
👉 Weekly FVG fill
Clean, simple, beautiful.
If the market sends it, this swing can be a banger.
Let’s see what FOMC gives us —
and please, trade safely… we all know how 20:00 can get. 🚀🔥

FireHoseReel | BNB Daily Analysis #19🔥 Welcome To FireHoseReel !
Let’s dive into BinanceCoin (BNB) analysis.
👀 BNB 4H Overview
BNB is currently moving inside a consolidation box on the 4H timeframe, with volume steadily decreasing inside this range. A breakout from either the top or bottom of the box could trigger a strong move. Price is now approaching the key resistance at $915.
📊 Volume Analysis
Price pushed into resistance with a clear volume divergence, and after sellers stepped in with increased selling volume, BNB was rejected downward. If selling volume continues to rise, the newly-formed support zone may break, allowing price to move lower.
✍️ BNB Trading Scenarios
🟢 Long Scenario 1:
A breakout above $915 with strong buying volume and a volatility-range break above 61.63 can provide a solid long setup.
🔴 Short Scenario:
A breakdown of the newly-formed multi-timeframe support at $864, confirmed by increasing selling volume, can create a valid short opportunity.
🧠 Protect your capital first. No setup is worth blowing your account. If risk isn’t controlled, profit means nothing. Trade with rules, not emotions.

TECHNICAL ANALYSIS BNB/USDT1️⃣ Market Structure and Trend
The chart shows a long-term uptrend, confirmed by a very clean ascending trendline (orange), which has been acting as dynamic support for over a year.
After a strong breakout to ~1380, the price began a correction but still hasn't broken the higher low structure → the uptrend is intact.
2️⃣ Key Levels (exactly from your chart)
🟢 Resistance Levels (green):
~1018 USDT
~1150 USDT
~1249 USDT
These are potential targets for a renewed uptrend.
🔴 Support Levels (red):
~879 USDT – the closest important support
~838 USDT – a key defensive level
~683 USDT – deep support / last HTF trendline
The price is currently trading directly above the first support level.
3️⃣ Trendline (orange)
Your trendline is:
strong, multi-point
drawn on the D1 timeframe
currently around 850–880 USDT
➡️ If the price falls, the trendline perfectly aligns with the 838–879 zone, strengthening this zone as a "must defend."
4️⃣ Oscillators – Stoch RSI (bottom)
Currently:
The oscillator is in a high zone (above 80) → indicating local overbought
However, there is no clear downward crossover yet.
Meaning:
👉 Upward momentum is still active, but we are closer to a local high than a low.
5️⃣ Scenarios
🟢 Upside scenario (more likely as long as the trendline holds)
Condition: Maintaining the 879/838 levels and the trendline.
Targets:
1018 USDT – first resistance
1150 USDT – important medium-term resistance
1249 USDT – main HTF target
The longer the price consolidates above the orange trendline, the greater the chance of a renewed attack on 1150–1249.
🔴 Downside scenario (less likely, but crucial)
Condition: Downside breakout of 838 USDT and closing of the D1 candle below the trendline.
Then:
the market could enter a deeper correction phase
the target would be the 683 USDT level – this is also the main support level, where reactions were previously strong
This is a "capitulation" scenario, but it doesn't seem to be dominant given the current price action.
6️⃣ What can we see on the chart "here and now"?
✔️ The price has rebounded from the local low
✔️ It is still between support at 879 and resistance at 1018
✔️ The uptrend is intact
✔️ A potential HTF higher low has formed
✔️ The Stoch RSI shows momentum, but caution is warranted
➡️ The market is consolidating within the uptrend, with a high chance of a breakout upwards – provided support is maintained.

Strong Support and Resistance Area: 533.90-793.86
Hello, fellow traders!
Follow us to get the latest information quickly.
Have a great day!
-------------------------------------
(BNBUSDT 1D Chart)
The 533.90-793.86 area is a strong support and resistance area. A decline below this area is highly likely to trigger a long-term downtrend.
Therefore, if support is found around the 533.90-793.86 range, it would be a buying opportunity.
Since the HA-Low indicator formed at 871.15, if support is found around the 833.78-871.15 range, this would also be a buying opportunity.
Resistance levels are:
1st: 1028.57-1088.90
2nd: 1220.98-1302.65
The first and second levels above are resistance levels.
-
If the price holds above 793.86, it is expected to rise to around the circled range shown on the chart above.
BNB should be traded differently from BTC or ETH.
In other words, while you can continue to invest in BTC and ETH to purchase them, you should hold altcoins like BNB, XRP, and SOL by increasing the number of coins that represent profits.
Therefore, if the price rises after purchasing, you should sell the original purchase amount, leaving only the number of coins that represent profits.
This is because in a bear market, the price drops more sharply than expected.
BTC and ETH also show significant declines during bear markets, similar to altcoins. However, they tend to rebound faster than altcoins, allowing for continued investment and purchase.
However, to stabilize your psychological state, it's important to take some profits while you're in profit.
-
Thank you for reading to the end.
I wish you successful trading.
--------------------------------------------------

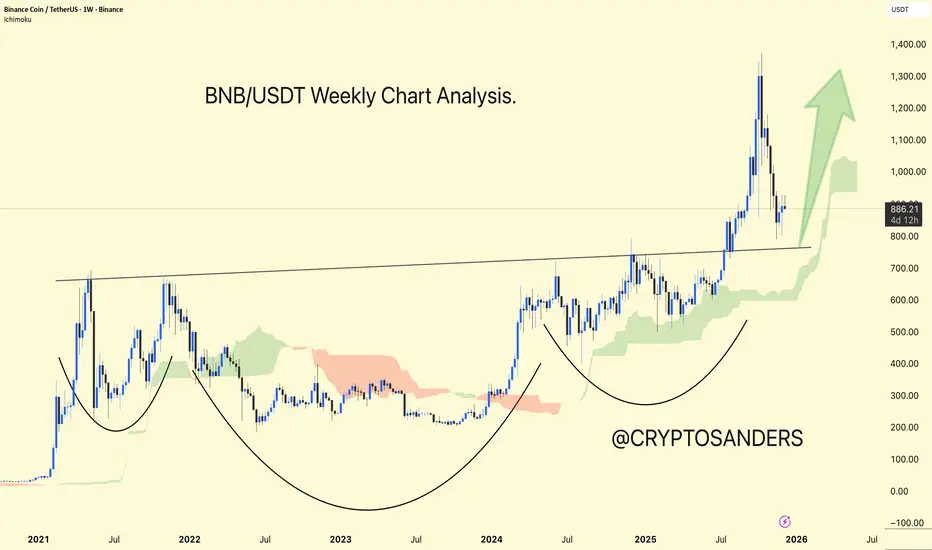
BNB/USDT Weekly Chart Analysis.BNB/USDT is trading in the range of 800 to 900 and remains within a larger bullish structure, but on higher timeframes, the price is still below a significant resistance band in the 1,160–1,180 zone.
Recent technical analysis indicates that BNB is trading above its key moving averages, with most indicators in "buy" territory, confirming the ongoing uptrend. However, some readings are approaching overbought levels.
On the chart, significant resistance is shown near 1,160–1,180 (the upper wedge boundary), while support is initially found around 1,095–1,100 and then at 1,050–1,020 if the wedge base is broken.
DYOR | NFA,
FireHoseReel | BNB Daily Analysis #19🔥 Welcome To FireHoseReel !
Let’s dive into BinanceCoin (BNB) analysis.
👀 BNB 4H Overview
BNB is currently trading inside a large 4H range box. A breakout from this box could trigger a major move.
The $922 level stands as both the top of the range and the 38% Fibonacci retracement of the previous bearish leg.
On the downside, $881 is acting as a freshly formed support zone.
📊 Volume Analysis
Volume slightly increased during the attempt to break $922, but buyers lacked enough strength and selling pressure followed.
A strong and sustained increase in volume will significantly raise the probability of a valid breakout.
✍️ BNB Trading Scenarios
🟢 Long Scenario 1:
A confirmed breakout above $922 creates a solid long opportunity.
Entry confirmation should come from a stable increase in buying volume.
🟢 Long Scenario 2:
You may enter on the 4th test using a stop-buy order with a wider stop, targeting around RR = 2.
⚠️ This type of entry should be executed with maximum 0.5% risk per trade to avoid heavy losses.
🔴 Short Scenario:
Since the broader structure behind price is strongly bearish, and the market previously experienced an aggressive drop from a distribution zone,
a break below the newly formed $881 support can activate a short position, confirmed by rising sell volume.
🧠 Protect your capital first. No setup is worth blowing your account. If risk isn’t controlled, profit means nothing. Trade with rules, not emotions.

FireHoseReel | BNB Daily Analysis #19🔥 Welcome To FireHoseReel !
Let’s dive into BinanceCoin (BNB) analysis.
👀 BNB 1H Overview
BNB reacted to its resistance yesterday and activated its long trigger. It is now still struggling with the same resistance zone, while we have slightly moved the resistance higher for the new trigger.
📊 Volume Analysis
BNB volume has formed a divergence with price. A clear resistance breakout requires rising buy volume for confirmation. Keep in mind that all valid breakouts need volume convergence—otherwise, a fakeout is very likely.
✍️ BNB Trading Scenarios
🟢 Long Scenario:
A breakout above the current resistance at $904, supported by increasing buy volume, could open a valid long setup.
🔴 Short Scenario:
A breakdown below the maker-buyer low at $877, confirmed with strong selling pressure on the 1H timeframe, could activate a short setup.
🧠 Protect your capital first. No setup is worth blowing your account. If risk isn’t controlled, profit means nothing. Trade with rules, not emotions.

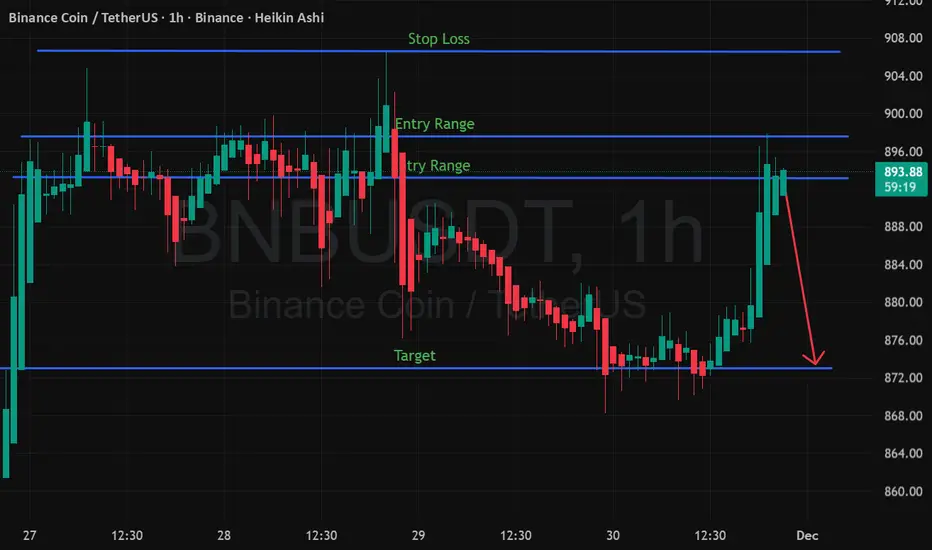
BNB Sell Signal Generated — Levels Inside🔽 Trade Setup
Sell Zone: 893 – 892
Stop Loss: 910
Target: 875
📊 Why This Matters
BNB has shown signs of weakening momentum near the upper resistance band. The recent candle structure plus volume behaviour suggests sellers are stepping in, creating a short opportunity in this zone.
🎯 Target Expectation
Price is expected to test the 875 support zone, where demand previously reacted strongly. Risk-to-reward remains favourable as long as price stays below 910.
⚠️ Risk Management
Always follow your SL and manage position size according to your strategy.
This is not financial advice — only for educational purposes.
Monday Market overview: BTC,BNB,BCH,GBPUSD 10:13 12/08/25Looking for tasty long entries on GBP/USD and BNB/USDT for this week. I am making sure to manage my positions correctly so that even if they loose I still make money. My main focus is BCH I think this has potential to go up to the prior ATH of around 4k. I don't think the crypto bull market is over I reckon we will have a crazy December, early Jan to around the 13th. There's a chance we go on until around march but we will just react to what the market is telling us.
I briefly looked over Gold and US indices, they are not my trading focus at the moment....
DISCLAIMER: I am not a financial adviser. Investing and trading is risky, and you can lose your money. The information in this video should not be used to make any investment decisions. You should contact a licensed financial adviser prior to making any investment decisions. Any affiliate links in the description of these videos may provide a commission if you decide to purchase their products. I appreciate any and all support of my channel, and without you, I wouldn't be here. Thank you.

BNB/USDT : Rise or continue to fall?Hello friends
considering the downtrend we have and we have identified it, you can see that the power is in the hands of the sellers and every high it hits is a selling opportunity.
But there is one point, and that is this triangle that the price has formed. If it continues the trend, it is very likely that the price will fall again to the specified areas.
But if buyers want to break it and push the price up, the story changes and the price pivots we identified become the targets of the buyers who hit them.
This analysis is purely technically reviewed and is not a buy or sell recommendation. Please observe risk and capital management.
*Trade safely with us*

FireHoseReel | BNB Daily Analysis #18🔥 Welcome To FireHoseReel !
Let’s dive into BinanceCoin (BNB) analysis.
👀 BNB 1H Overview
BNB is still holding the same position as yesterday, and due to the holiday period, the market hasn’t shown major changes. I’ve only adjusted the newly formed resistance slightly and moved it to $898.22.
📊 Volume Analysis
BNB volume was very low yesterday, but today it’s showing a moderate increase. Sundays usually bring more activity than Saturdays, so with rising volume, any trigger activation could lead to a faster move.
✍️ BNB Trading Scenarios
🟢 Long Scenario:
A breakout above the newly formed resistance at $898.22, supported by rising buy volume, could act as a risky long trigger. The next key long level lies around $922.57.
🔴 Short Scenario:
A 15-minute base has formed in this zone, which may offer a quick entry with a tight stop. The main short trigger is at $877.33—a confirmed break with volume could validate a short entry.
🧠 Protect your capital first. No setup is worth blowing your account. If risk isn’t controlled, profit means nothing. Trade with rules, not emotions.

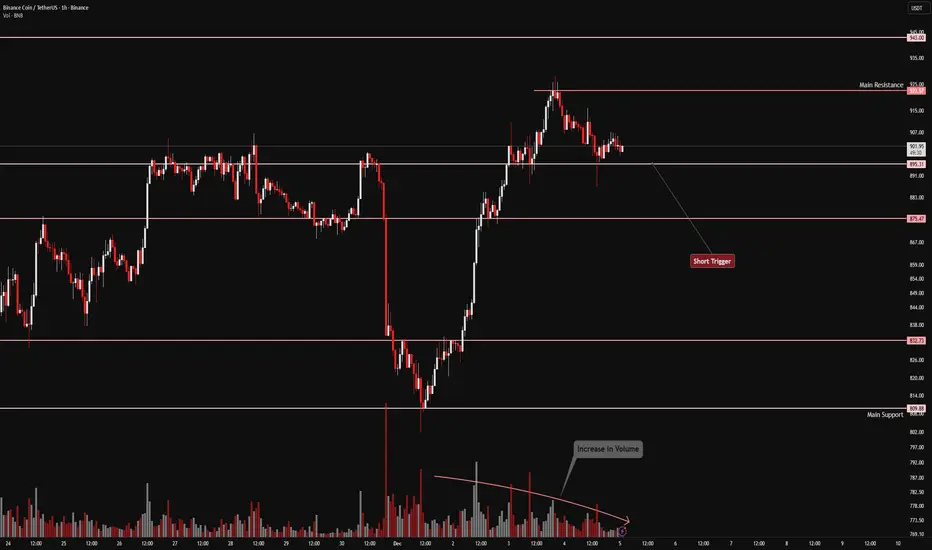
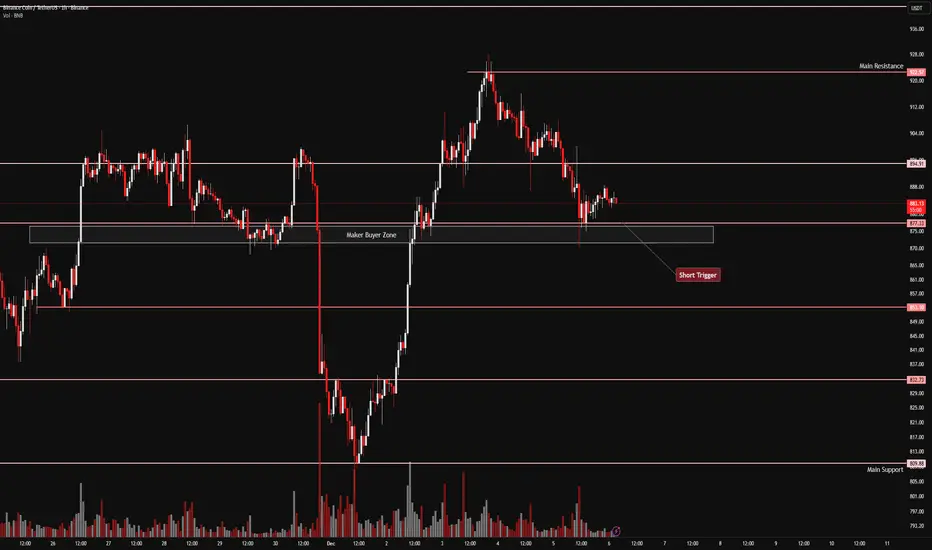
FireHoseReel | BNB Daily Analysis #17🔥 Welcome To FireHoseReel !
Let’s dive into BinanceCoin (BNB) analysis.
👀 BNB 1H Overview
After the recent drop, BNB is currently ranging between $895 and $877. A breakdown below the range floor could trigger a deeper correction. This support also aligns with the 38% Fibonacci retracement, making it a valid technical level.
📊 Volume Analysis
Volume increased during the sell-off, then dropped sharply in momentum. A strong sell-off candle hit the maker-buyer zone, followed by range consolidation. Due to the holiday period, volume conditions remain weak.
✍️ BNB Trading Scenarios
🟢 Long Scenario:
A breakout above the range high at $922 could activate the next long trigger.
🔴 Short Scenario:
A breakdown of the current floor (maker-buyer zone), potentially driven by a long squeeze and sudden volatility spike, could open the door for a short entry after a pullback with tighter risk.
🧠 Protect your capital first. No setup is worth blowing your account. If risk isn’t controlled, profit means nothing. Trade with rules, not emotions.
FireHoseReel | BNB Daily Analysis #16🔥 Welcome To FireHoseReel !
Let’s dive into BinanceCoin (BNB) analysis.
👀 BNB 1H Overview
BNB is currently hovering near a key support zone. A breakdown below this level could trigger a deeper correction toward lower prices.
📊 Volume Analysis
Trading volume has dropped sharply at this corrective level. A new surge in either buy or sell volume could ignite a strong momentum move.
✍️ BNB Trading Scenarios
🟢 Long Scenario:
A breakout above $922.57 with rising buy volume could offer a solid long opportunity.
🔴 Short Scenario:
A breakdown below the current support at $895, accompanied by strong selling pressure, could trigger a valid short setup.
🧠 Protect your capital first. No setup is worth blowing your account. If risk isn’t controlled, profit means nothing. Trade with rules, not emotions.