BNB/USDT at Critical Zone – Trend Continuation or Correction?On the 4-day timeframe, BNB/USDT is currently undergoing a healthy correction following a strong bullish impulse that previously formed a blow-off top near the 1,375 level. Price is now retracing into a critical technical area that will likely determine the next major directional move.
---
Pattern & Market Structure Explanation
1. Strong Impulsive Rally
BNB experienced a sharp, near-parabolic rally, signaling strong bullish momentum and a phase of market euphoria.
2. Blow-Off Top Formation
The peak around 1,375 was followed by aggressive selling pressure, indicating distribution from smart money.
3. Corrective Structure (ABC / Descending Pullback)
The current decline appears corrective rather than a full bearish reversal, characterized by controlled lower highs and orderly price action.
4. Major Demand Zone / Previous Resistance Flip
The yellow zone at 765–720 represents:
A historical consolidation area
A former strong resistance level
A potential support-resistance flip (SR Flip) and high-probability demand zone
---
Key Levels to Watch
Resistance Levels:
892
989
1,135
1,300
1,375 (ATH / Major Supply)
Support Levels:
765 – 720 (Major Demand Zone)
Below 720 → risk of deeper correction
---
Bullish Scenario
Price holds and reacts bullishly within the 765–720 demand zone
Bullish confirmation may include:
Strong rejection
Long lower wicks
Break of minor bearish structure
Upside targets:
892 → 989 → 1,135
If momentum strengthens, a retest of 1,300 – 1,375 becomes highly probable
This scenario confirms the move as a pullback within a larger bullish trend
---
Bearish Scenario
A strong 4D close below 720
Demand zone fails to absorb selling pressure
Price may continue correcting toward lower historical support levels
Market structure shifts into a medium-term bearish continuation
Bearish bias is confirmed if subsequent rallies fail to form a higher low
---
Conclusion
BNB is currently trading at a critical decision zone. The 765–720 area is the key battlefield between buyers and sellers. Price reaction here will determine whether BNB resumes its macro bullish trend or enters a deeper corrective phase. Patience and confirmation are essential before taking any position.
---
#BNBUSDT #BNB #CryptoAnalysis #Altcoin #TechnicalAnalysis #MarketStructure #SupportResistance #DemandZone #SwingTrading #CryptoMarket
BNBUSDTPERP

#BNBUSDT (4H) — Chart Update#BNBUSDT (4H) — Chart Update
Current Price: ~852 USDT
Major Support: 820–830 (rising trendline + demand zone)
Immediate Resistance: 860–880
Major Resistance Levels:
919 USDT
1,014 USDT
1,060 USDT
Price respected the ascending base and printed a bounce from demand.
Short-term structure is recovering, but still below key resistances.
The projected path suggests a higher-low formation if support holds.
Bullish: Hold above 820–830 → push toward 880 → 919.
Strong Breakout: Acceptance above 919 opens 1,014 → 1,060 zone.
Bearish: Lose 820 → structure weakens, deeper pullback risk.
⚠️ Note: Wait for confirmation above 880 / 919 for safer longs.
Risk management is key.

BNB — Ascending Channels, Shakeout Pattern & Bull Market OutlookIn 2018 BNB formed a clear ascending channel. After moving inside this structure for several years, the market experienced a sharp shakeout in March 2020, which became the final capitulation before a major trend reversal. By late 2020 the price broke out above the channel, confirming the beginning of a strong bull market.
Since 2021 a new ascending channel has been forming. I expect a corrective move toward the lower boundary of this channel in the $300–$350 area. A similar shakeout to what happened in March 2020 may occur again around 2026, potentially acting as a final reset before the next major uptrend.
After this pullback, the next bullish phase could begin, with long-term targets in the $4,000–$5,000 range.
Key points:
2018: formation of the first ascending channel.
March 2020: sharp shakeout → final reset before the bull run.
Late 2020: breakout above the channel → start of the bullish cycle.
2021–present: formation of a new ascending channel.
Expected: retrace to $300–$350 + possible 2026 shakeout.
Long-term target: $4K–$5K after the new bull run begins.

Strong Support and Resistance Area: 533.90-793.86
Hello, fellow traders!
Follow us to get the latest information quickly.
Have a great day!
-------------------------------------
(BNBUSDT 1D Chart)
The 533.90-793.86 area is a strong support and resistance area. A decline below this area is highly likely to trigger a long-term downtrend.
Therefore, if support is found around the 533.90-793.86 range, it would be a buying opportunity.
Since the HA-Low indicator formed at 871.15, if support is found around the 833.78-871.15 range, this would also be a buying opportunity.
Resistance levels are:
1st: 1028.57-1088.90
2nd: 1220.98-1302.65
The first and second levels above are resistance levels.
-
If the price holds above 793.86, it is expected to rise to around the circled range shown on the chart above.
BNB should be traded differently from BTC or ETH.
In other words, while you can continue to invest in BTC and ETH to purchase them, you should hold altcoins like BNB, XRP, and SOL by increasing the number of coins that represent profits.
Therefore, if the price rises after purchasing, you should sell the original purchase amount, leaving only the number of coins that represent profits.
This is because in a bear market, the price drops more sharply than expected.
BTC and ETH also show significant declines during bear markets, similar to altcoins. However, they tend to rebound faster than altcoins, allowing for continued investment and purchase.
However, to stabilize your psychological state, it's important to take some profits while you're in profit.
-
Thank you for reading to the end.
I wish you successful trading.
--------------------------------------------------

$BNB/USDT ANALYSISBNB/USDT on the 4-hour chart has successfully broken out of the descending channel that has been controlling its movement since October. After the breakout, the price managed to retest the upper boundary of the channel and is now holding above both the EMA line and the Ichimoku cloud, showing that short-term momentum has shifted from bearish to bullish. The strong bullish candle that pushed price out of the channel confirms a breakout with volume support, suggesting buyers are gaining control.
If BNB holds above the $890–$900 range, this breakout could extend toward the next resistance zone around $1,040–$1,100, and possibly reach the higher target near $1,180–$1,200. The stop-loss region near $849 remains a safe invalidation level below the retest zone. Overall, BNB is showing a potential trend reversal from the downtrend into a bullish phase, and as long as it maintains support above the breakout zone, upside continuation toward $1,200 remains likely.

BNB/USDT 1H AnalysisHi
After a prolonged downtrend, BNB has broken its descending trendline, signaling a shift from bearish to bullish momentum. The price formed a symmetrical triangle pattern, completing at point D, which coincides with the lower boundary of the rising channel. Since then, BNB has been trading inside a clearly defined ascending channel, respecting both support and resistance levels.
Recently, a bullish flag has formed, representing a consolidation after a strong upward impulse. A breakout from this flag suggests continuation towards the upper channel boundary near $940–950. Support lies around $880, aligning with both the flag’s lower boundary and the channel’s midline.

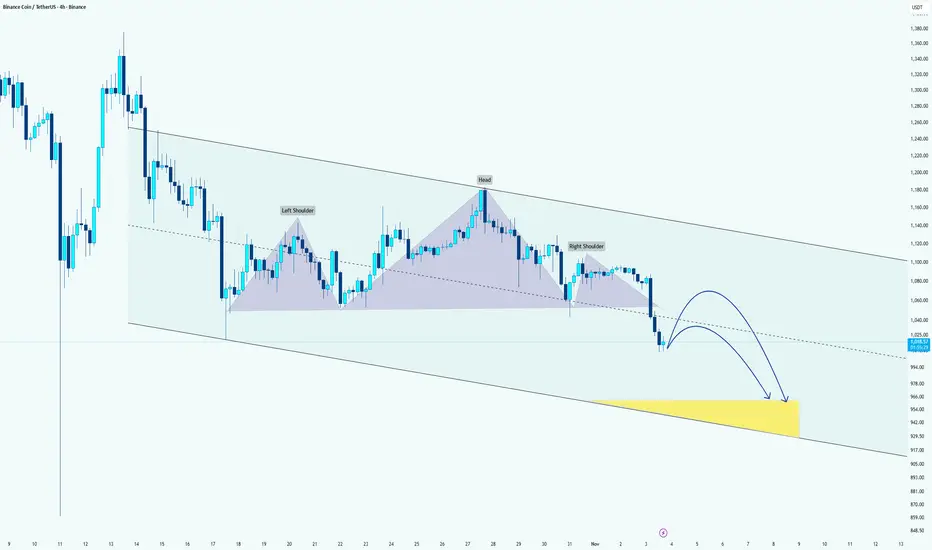
BNB Forming Head & Shoulders Breakdown Within Descending ChannelHi!
The chart shows a descending channel, indicating that the broader trend remains bearish. Inside this channel, we can see a Head and Shoulders pattern that recently broke below its neckline, confirming a potential continuation of the downtrend.
After the neckline breakout, price pulled back slightly but continues to trade under the broken support. The two projected blue curves suggest a possible short-term retracement toward the neckline or mid-range of the channel, followed by another move to the downside.
The yellow highlighted area marks a strong target/support zone between roughly $950–$970, which aligns with:
The bottom boundary of the descending channel, and
The measured move projection from the Head and Shoulders pattern.
As long as the price stays below the neckline and within the channel, the bearish bias remains intact. A clean break above the neckline could temporarily invalidate this scenario and lead to a relief rally, but overall, momentum favors a continuation toward the lower support zone.
BNBUSDTBINANCE:BNBUSDT is Bull-trend and we may buyer in any correction.
Best support: Now level - 1150 - 1075 - 975
Seve profit in levels: 1275 - 1350 - 1400
P;ease control Risk management.⚠️

BNB; ATHHello friends
Given the recent growth we have had, the price has formed a double top pattern and is in the specified support areas, we can expect the price to be supported until the specified targets.
*Trade safely with us*

BNB Soars Above Key SupportLooking at this $BNB/USDT chart, here's a more concise breakdown:
Rising Support: The red line shows a strong support level that has held up since 2018, with the price bouncing off it several times, confirming its importance.
Accumulation Zone: Between 2020 and 2021, BNB traded sideways, building up buying pressure before the next move.
Breakout: After the accumulation phase, BNB broke out sharply, signaling the start of a strong upward trend.
Current Trend: The price is now above the rising support line, and the bullish momentum seems to be continuing, suggesting further potential upside.
In short , BNB is in a solid uptrend, with a key support line holding strong. The breakout indicates more gains ahead if the trend continues.

Resistance Zone: 977.90-1047.80
Hello, fellow traders!
Follow us to get the latest information quickly.
Have a great day!
-------------------------------------
(BNBUSDT 1M Chart)
We achieved our target by touching the Fibonacci level of 1.618 (1057.16).
We need to see if the price can rise towards Fibonacci ratio 2 (1259.05).
-
(1D chart)
The HA-High ~ DOM (60) range has formed at 977.90-1047.80.
Therefore, the 977.90-1047.80 range could act as resistance.
If it falls below 977.90, it could encounter the M-Signal indicator on the 1M chart.
Before that, we need to see if the price rises along the uptrend line (1).
-
Thank you for reading to the end.
I wish you successful trading.
--------------------------------------------------

BNB CAN MAKE A NEW ATHi think BINANCE:BNBUSDT still bullish and can make a new ATH in the next Hours . i don't know how far it can reach but a new ATH is in plan!
best entry point can be in 4H FVG

BNB WEEKLYHello friends🙌
🔊We are here with BNB analysis:
A long-term analysis that can be viewed as an investment, but in the long term, with patience and capital management...
You can see that after weeks of price suffering, a good upward move has now been formed by buyers, which has also caused a new ceiling to be set. Considering the market decline and the decline of most currencies, you can see that BNB is well supported and its price has suffered.
⚠Now, with the arrival of buyers, you can enter a long-term buy trade with capital management.
🔥Follow us for more signals🔥
*Trade safely with us*

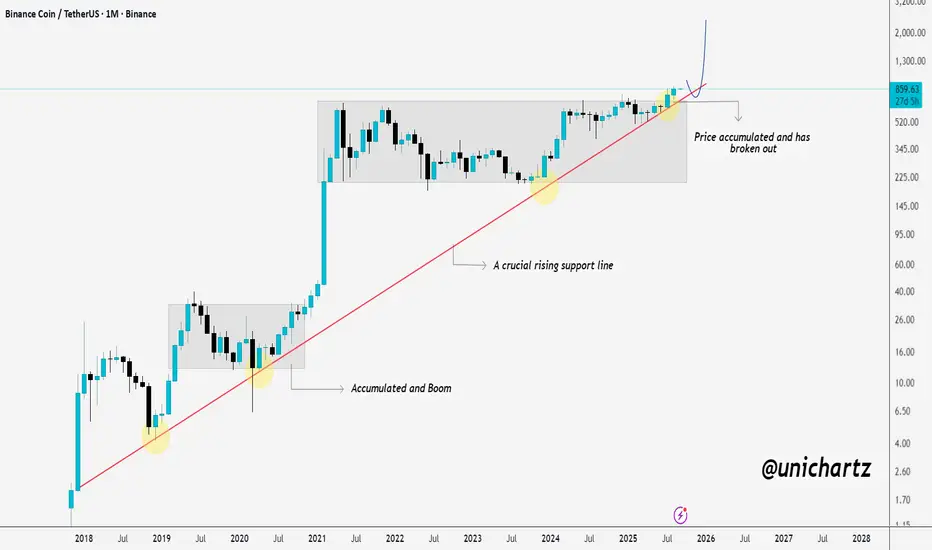
$BNB could move 80% from here - the key levels to watch BNB/USDT Monthly Analysis
CRYPTOCAP:BNB has been respecting a strong rising support line since 2018, showing consistent strength over the long term.
Each time BNB consolidated near this trendline, it accumulated and then rallied hard, marking key breakout points in previous cycles.
Right now, price has accumulated again and broken out, signaling a potential continuation to the upside. If momentum sustains, the next targets could push toward $1,200–$1,500 and beyond in the coming months.
The rising trendline remains a crucial support, holding above it keeps the macro bullish structure intact.
DYOR, NFA
Thanks for checking this out.
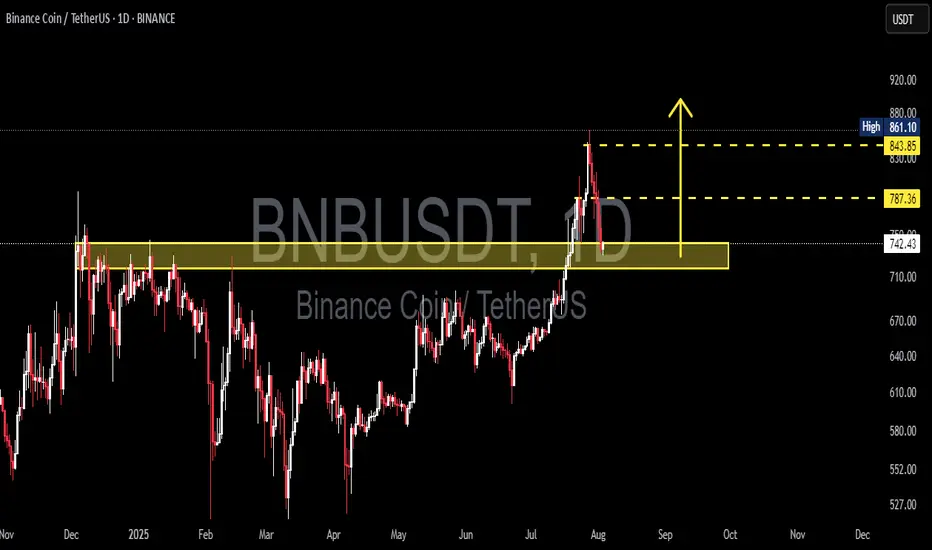
BNBUSDT Critical Retest in Progress📊 Comprehensive Analysis:
BNB/USDT has finally managed to break out of a major consolidation range that lasted over 6 months, with the key resistance zone between $730 and $750 acting as a strong ceiling since late 2024.
The breakout in late July 2025 was supported by a noticeable increase in volume, signaling strong accumulation and a possible shift from a ranging market to a bullish trend.
Now, the price is revisiting this previous resistance — a crucial retest zone that will likely determine whether this move is sustainable or a potential bull trap.
---
🔍 Key Price Levels Identified:
🟡 Retest Support Zone (Previous Resistance):
$730 – $750 → A critical area that must hold to maintain the bullish market structure.
🟡 Minor Resistance:
$787.36 → Recently rejected, this is the next short-term barrier that bulls must break.
🟡 Major Resistance (Swing High):
$843.85 → Key historical level before reaching the recent local high.
🔵 Recent Local High (Potential Double Top or Breakout):
$861.10 → A break above this level could open the doors to fresh highs.
---
✅ Bullish Scenario:
If BNB holds above the $742.36 level and prints a strong bullish reversal candle (e.g., pin bar or bullish engulfing), the retest can be considered successful.
Next upside targets:
🎯 $787.36 → Immediate resistance
🎯 $843.85 → Key swing high
🎯 $861.10 → Local high
🎯 $900 psychological level → If momentum and volume persist
Look for decreasing volume during retracement and surging volume on breakout to confirm bullish continuation.
---
❌ Bearish Scenario:
If the price fails to hold above $742.36 and breaks down below $730, this may confirm a false breakout (bull trap).
Downside targets could include:
⚠️ $710 – $690 → Minor demand zone
⚠️ $660 – $640 → Historical support within the previous range
A bearish confirmation would come from a lower high formation followed by a strong bearish breakdown candle with increasing volume.
---
📈 Chart Pattern & Price Structure:
The breakout indicates a bullish continuation pattern.
Potential formation of a Bullish Flag or an Ascending Channel, if support holds and consolidation continues above $740.
No major signs of distribution yet — the structure remains healthy and bullish.
---
🧠 Strategic Summary:
> The market has shown strong bullish intent, but it is now at a critical retest phase. Holding this zone could ignite the next leg up. Failure to do so, however, may signal a reversal or deeper correction.
For swing traders, the $730–$750 zone is a golden pocket for potential entries with tight risk management. For conservative traders, a confirmed breakout above $787–$843 offers a safer opportunity.
#BNBUSDT #BNBAnalysis #CryptoBreakout #Altcoins #TechnicalAnalysis #PriceAction #SupportResistance #BullishScenario #BearishScenario #CryptoTrading #BinanceCoin #SwingTrading
BNBUSDT Forming Bullish Wave BNBUSDT is forming a promising bullish wave pattern that suggests a potential continuation of the upward trend in the short to mid-term. The structure is supported by consistent volume, indicating strong participation and interest from traders and investors. The price action reflects healthy higher lows and higher highs, which typically signal growing bullish momentum. Given the current setup, we can expect a conservative gain of around 10% to 20%+ as the price targets upper resistance zones.
Binance Coin (BNB), being one of the top-tier cryptocurrencies with strong utility across the Binance ecosystem, often benefits from broader market recoveries and exchange-driven demand. With overall crypto sentiment showing resilience, BNB is well-positioned to attract further inflows. The bullish wave pattern being observed could serve as a foundation for the next impulsive move upward, especially if volume continues to support the breakout structure.
The project continues to demonstrate its dominance in both fundamental and technical metrics. As market confidence in leading assets returns, BNB’s role as a utility token and its deflationary mechanisms make it particularly attractive. Technical traders will be watching for a breakout above recent highs to confirm trend continuation, ideally backed by a surge in volume and RSI strength.
BNBUSDT remains a strong candidate for traders looking for stability with upside potential. The confluence of bullish wave formation, increasing interest, and fundamental strength positions it well for a steady rise in price in the coming days or weeks.
✅ Show your support by hitting the like button and
✅ Leaving a comment below! (What is You opinion about this Coin)
Your feedback and engagement keep me inspired to share more insightful market analysis with you!

BNB Pump???On the daily chart of BNB, a symmetrical triangle has formed, and the price is approaching a breakout point. The $600–$604 zone, aligned with the 200-day moving average and the descending trendline, acts as a key resistance. A bullish breakout could push the price toward the $696 area. On the downside, the $575 support is crucial — if broken, the next potential drop could target the $505 zone. Price compression and declining volatility suggest a strong move is likely soon.
📈 A major move is coming for BNB!
🔺 Resistance: $604
🔻 Support: $575 and then $505

BNB tapped the imbalance — and I stepped in.There was no panic here. Just rebalancing.
BNB just dipped into the 0.5 level at 653.28 — right at the base of a 1H FVG and overlapping with a minor demand wick. Most won’t even notice what just happened. But Smart Money sees the shift.
The market provided liquidity for entries without breaking structure.
The 1H OB above — from 657.5 to 661.4 — is now the magnet. It’s unmitigated, and clean.
If price holds this mid-volume shelf and we reclaim above 655.2, I expect rapid delivery into the OB, potentially overshooting for premium distribution into higher inefficiencies.
Execution logic:
Entry zone: 652.9–653.3
Reclaim trigger: above 655.2
TP1: 657.5
TP2: 661.4
SL: below 651.3 (0.618) or tighter under 648.6 (0.786 if aggressive)
You don’t need a breakout.
You need balance — and the discipline to strike when it returns.

BNBUSDT | Watching the Blue BoxesBNBUSDT is setting up a possible move, and I’ll be watching for an upward break inside the blue boxes .
No need to jump the gun. If price breaks out with volume and confirms on a lower timeframe, that’s where opportunity begins .
“I will not insist on my short idea. If the levels suddenly break upwards and do not give a downward break in the low time frame, I will not evaluate it. If they break upwards with volume and give a retest, I will look long.”
Let others guess. You wait with purpose.
📌I keep my charts clean and simple because I believe clarity leads to better decisions.
📌My approach is built on years of experience and a solid track record. I don’t claim to know it all but I’m confident in my ability to spot high-probability setups.
📌If you would like to learn how to use the heatmap, cumulative volume delta and volume footprint techniques that I use below to determine very accurate demand regions, you can send me a private message. I help anyone who wants it completely free of charge.
🔑I have a long list of my proven technique below:
🎯 ZENUSDT.P: Patience & Profitability | %230 Reaction from the Sniper Entry
🐶 DOGEUSDT.P: Next Move
🎨 RENDERUSDT.P: Opportunity of the Month
💎 ETHUSDT.P: Where to Retrace
🟢 BNBUSDT.P: Potential Surge
📊 BTC Dominance: Reaction Zone
🌊 WAVESUSDT.P: Demand Zone Potential
🟣 UNIUSDT.P: Long-Term Trade
🔵 XRPUSDT.P: Entry Zones
🔗 LINKUSDT.P: Follow The River
📈 BTCUSDT.P: Two Key Demand Zones
🟩 POLUSDT: Bullish Momentum
🌟 PENDLEUSDT.P: Where Opportunity Meets Precision
🔥 BTCUSDT.P: Liquidation of Highly Leveraged Longs
🌊 SOLUSDT.P: SOL's Dip - Your Opportunity
🐸 1000PEPEUSDT.P: Prime Bounce Zone Unlocked
🚀 ETHUSDT.P: Set to Explode - Don't Miss This Game Changer
🤖 IQUSDT: Smart Plan
⚡️ PONDUSDT: A Trade Not Taken Is Better Than a Losing One
💼 STMXUSDT: 2 Buying Areas
🐢 TURBOUSDT: Buy Zones and Buyer Presence
🌍 ICPUSDT.P: Massive Upside Potential | Check the Trade Update For Seeing Results
🟠 IDEXUSDT: Spot Buy Area | %26 Profit if You Trade with MSB
📌 USUALUSDT: Buyers Are Active + %70 Profit in Total
🌟 FORTHUSDT: Sniper Entry +%26 Reaction
🐳 QKCUSDT: Sniper Entry +%57 Reaction
📊 BTC.D: Retest of Key Area Highly Likely
📊 XNOUSDT %80 Reaction with a Simple Blue Box!
📊 BELUSDT Amazing %120 Reaction!
📊 Simple Red Box, Extraordinary Results
I stopped adding to the list because it's kinda tiring to add 5-10 charts in every move but you can check my profile and see that it goes on..

BNBUSDT - Big Move Loading….BINANCE:BNBUSDT recently made a clean breakout from a strong resistance level, and since then, it’s been chilling in a tight consolidation range textbook flag formation if you ask us! This kind of local flag pattern often signals a continuation of the previous move, and in BNB’s case, that move was up.
The consolidation phase seems mature now, and price action is starting to show signs of life again. With growing hype around BNB and Binance related developments, momentum could be building for a strong leg up. If things go as expected, the next destination might just be its previous all-time high. 👀
Traders should watch for volume confirmation on the breakout from this flag. A decisive move above the pattern could trigger a sharp rally. But hey as always, don’t forget your stop-loss. Protect your capital and ride the move smartly. Let’s see if BNB is ready to fly again!
BINANCE:BNBUSDT Currently trading at $653
Buy level : Above $655
Stop loss : Below $620
Target : $795
Max leverage 5x
Always keep stop loss
Follow Our Tradingview Account for More Technical Analysis Updates, | Like, Share and Comment Your thoughts

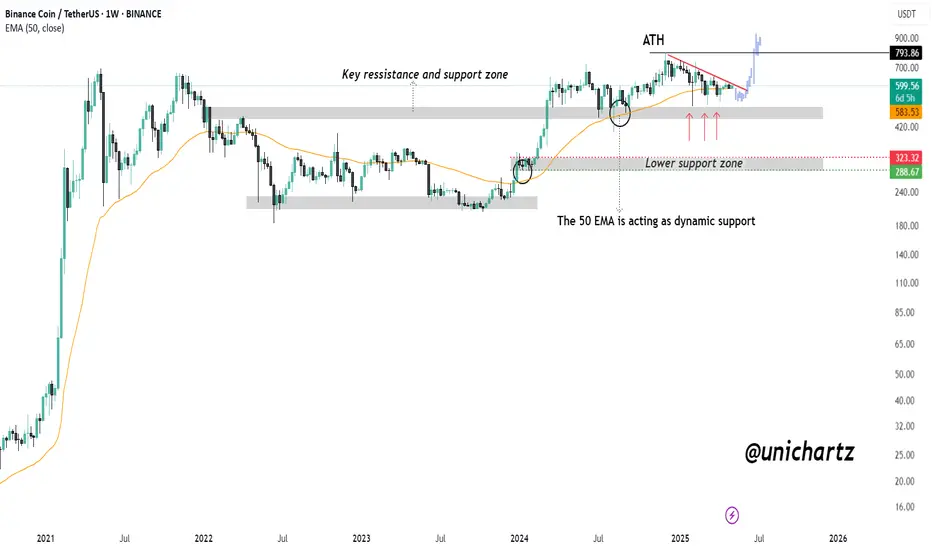
BNB Bull Flag Activated — Watching for $794 CRYPTOCAP:BNB is showing strong bullish momentum after rebounding off the marked support zone. This level, which previously acted as resistance, is now holding firmly as support following the breakout.
As long as BNB sustains above this zone, the bullish structure remains intact — and the path toward a new All-Time High (ATH) around $794 is wide open. The 50 EMA continues to act as dynamic support, further strengthening the setup.
DYOR, NFA
BNB TIME TO BUY?Hello friends
Due to the change in structure and the entry of buyers and the breakdown of the downtrend, we can buy in steps within the specified ranges and move with it to the specified targets, of course with capital and risk management...
*Trade safely with us*

BNB AnalysisBinance Coin (BNB) Analysis – March 30, 2025
In today's analysis, we examine Binance Coin's price movements using the 4-hour timeframe to assess its potential future direction.
🔹 Key Support Levels:
BNB remains above a crucial support range of $607–$593, which has held since March 16. If this support breaks, the price may test $546 as the next reaction level. Further downside could see BNB dropping to $530 and $507 as additional support zones.
🔹 Key Resistance Levels:
On the upside, BNB faces resistance at $637–$644. A confirmed breakout above this zone could push the price toward $700, following the same price range projection method used for support breakdowns.
📌 Outlook:
BNB’s trend remains neutral as long as the key support holds. A break below $593 could trigger a bearish move, while a break above $644 may confirm a bullish trend with $700 as the next target.
