BONK; Heikin Ashi Trade Idea📈 Hey Traders!
Here’s a fresh outlook from my trading desk. If you’ve been following me for a while, you already know my approach:
🧩 I trade Supply & Demand zones using Heikin Ashi chart on the 4H timeframe.
🧠 I keep it mechanical and clean — no messy charts, no guessing games.
❌ No trendlines, no fixed sessions, no patterns, no indicator overload.
❌ No overanalyzing market structure or imbalances.
❌ No scalping, and no need to be glued to the screen.
✅ I trade exclusively with limit orders, so it’s more of a set-and-forget style.
✅ This means more freedom, less screen time, and a focus on quality setups.
✅ Just a simplified, structured plan and a calm mindset.
💬 Let’s Talk:
💡Do you trade supply & demand too ?
💡What’s your go-to timeframe ?
💡Ever tried Heikin Ashi ?
📩 Got questions about my strategy or setup? Drop them below — ask me anything, I’m here to share.
Let’s grow together and keep it simple. 👊
Bonkusd
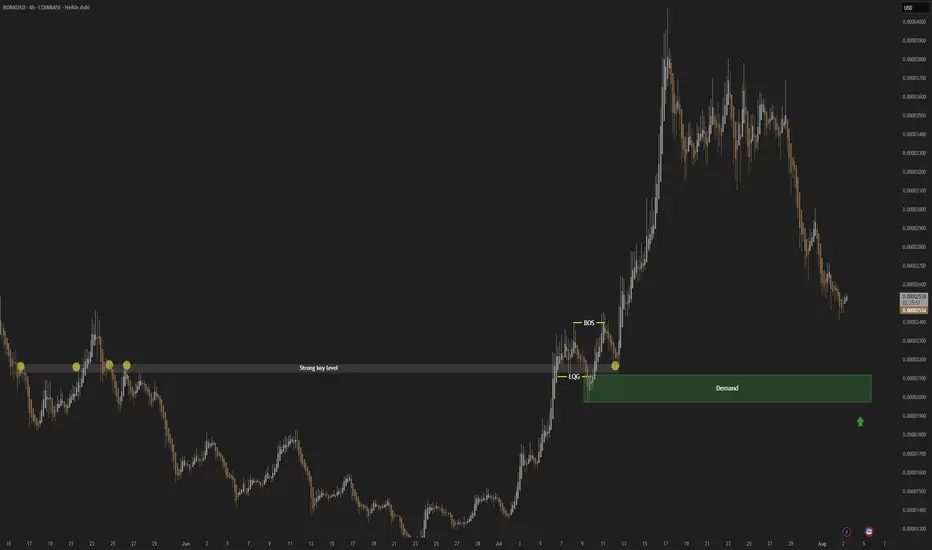
BONKUSDT – Let the Market Come to YouIn a possible Q3 correction, BONKUSDT may retest the green box zones below.
These areas are not predictions — they’re prepared zones where I’ll be waiting, not chasing.
🟩 I don’t buy strength blindly. I buy value with structure.
All risk-on markets typically experience significant corrections in the third quarter of the year and struggle to recover from this correction until the end of the year.
🎯 My Strategy
🔔 Set alerts for the green boxes
🕐 Switch to the 1-hour timeframe when triggered
📈 Wait for upward breakout + positive CDV
🎯 Only then: take the shot — one bullet, risk-managed
“Markets reward those who wait with a plan, not those who rush with emotion.”
Let’s stay patient, structured, and consistent.
— UmutTrades 💙
📌I keep my charts clean and simple because I believe clarity leads to better decisions.
📌My approach is built on years of experience and a solid track record. I don’t claim to know it all but I’m confident in my ability to spot high-probability setups.
📌If you would like to learn how to use the heatmap, cumulative volume delta and volume footprint techniques that I use below to determine very accurate demand regions, you can send me a private message. I help anyone who wants it completely free of charge.
🔑I have a long list of my proven technique below:
🎯 ZENUSDT.P: Patience & Profitability | %230 Reaction from the Sniper Entry
🐶 DOGEUSDT.P: Next Move
🎨 RENDERUSDT.P: Opportunity of the Month
💎 ETHUSDT.P: Where to Retrace
🟢 BNBUSDT.P: Potential Surge
📊 BTC Dominance: Reaction Zone
🌊 WAVESUSDT.P: Demand Zone Potential
🟣 UNIUSDT.P: Long-Term Trade
🔵 XRPUSDT.P: Entry Zones
🔗 LINKUSDT.P: Follow The River
📈 BTCUSDT.P: Two Key Demand Zones
🟩 POLUSDT: Bullish Momentum
🌟 PENDLEUSDT.P: Where Opportunity Meets Precision
🔥 BTCUSDT.P: Liquidation of Highly Leveraged Longs
🌊 SOLUSDT.P: SOL's Dip - Your Opportunity
🐸 1000PEPEUSDT.P: Prime Bounce Zone Unlocked
🚀 ETHUSDT.P: Set to Explode - Don't Miss This Game Changer
🤖 IQUSDT: Smart Plan
⚡️ PONDUSDT: A Trade Not Taken Is Better Than a Losing One
💼 STMXUSDT: 2 Buying Areas
🐢 TURBOUSDT: Buy Zones and Buyer Presence
🌍 ICPUSDT.P: Massive Upside Potential | Check the Trade Update For Seeing Results
🟠 IDEXUSDT: Spot Buy Area | %26 Profit if You Trade with MSB
📌 USUALUSDT: Buyers Are Active + %70 Profit in Total
🌟 FORTHUSDT: Sniper Entry +%26 Reaction
🐳 QKCUSDT: Sniper Entry +%57 Reaction
📊 BTC.D: Retest of Key Area Highly Likely
📊 XNOUSDT %80 Reaction with a Simple Blue Box!
📊 BELUSDT Amazing %120 Reaction!
📊 Simple Red Box, Extraordinary Results
📊 TIAUSDT | Still No Buyers—Maintaining a Bearish Outlook
📊 OGNUSDT | One of Today’s Highest Volume Gainers – +32.44%
📊 TRXUSDT - I Do My Thing Again
📊 FLOKIUSDT - +%100 From Blue Box!
📊 SFP/USDT - Perfect Entry %80 Profit!
📊 AAVEUSDT - WE DID IT AGAIN!
I stopped adding to the list because it's kinda tiring to add 5-10 charts in every move but you can check my profile and see that it goes on..

#BONK/USDT About to Break Out !#BONK
The price is moving within a descending channel on the 1-hour frame and is expected to break and continue upward.
We have a trend to stabilize above the 100 moving average once again.
We have a downtrend on the RSI indicator that supports the upward break.
We have a support area at the lower boundary of the channel at 0.00002440, acting as a strong support from which the price can rebound.
We have a major support area in green that pushed the price upward at 0.00002372.
Entry price: 0.00002552.
First target: 0.00002694.
Second target: 0.00002882.
Third target: 0.00003118.
To manage risk, don't forget stop loss and capital management.
When you reach the first target, save some profits and then change the stop order to an entry order.
For inquiries, please comment.
Thank you.

BONK : Best of luck to you...Hello friends🙌
👀Considering the decline we had, you can see that the price was supported by buyers and broke the specified resistance. Now, in the price correction, there is a good opportunity to buy with risk and capital management and in steps and be patient until the specified targets are reached.
🔥Follow us for more signals🔥
*Trade safely with us*

Bonk USDT Buy / Long SetupBonk performing well among all meme sectors, wait for the entry and take risk, if tp hits first then ignore. I already shared this setup on my group, we closed the trade at minor profit, but now this is showing strong momentum on 1hr tf also, that's why sharing.

BONK BONKUSDT Hello, greetings...
🐱🐉 The support and resistance levels in Bonk during the 4-hour timeframe are shown in the graph as I have indicated.
🐱🐉 However, what I want to discuss with you is how we should follow Bonk and how we can maintain control over its strength. I will show this to you...
🐱🏍 First, let's just look at the support, resistance, and our trend...
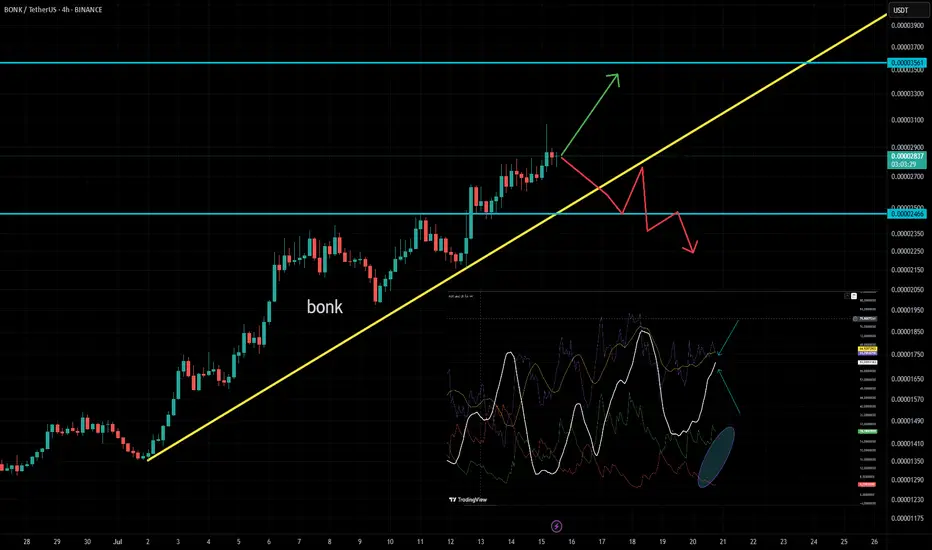
🐱🏍 When we look at it, we see a strong upward trend showing rapid growth and there is both a support level and a resistance level. It appears that the upward trend will continue until we reach the yellow line. When we reach the yellow trend, the color of things will change.
🐱👤 What I want to explain most to you is the indicator part now...
🐱👤 The blue arrow marks indicate the strength of the trend, the white line is called ADX, which shows how strong the trend is. The purple one is the well-known RSI,
🐱👤 So what is ADX telling us right now?
🐱👤 ADX is still looking upwards and at a high level, so it makes more sense to hold on to our long positions.
🐱🚀 The indicator we know as DI+ and DI- consists of green and red thin lines. What does it tell us?
🐱🚀 If DI+ (green) crosses above DI- (red), it indicates a positive trend and we are currently seeing a significant positive movement. We will use this indicator like this: if ADX turns downward and DI- crosses above DI+, those who are holding long positions should be cautious.
CONTINUE TO HOLD THE POSITION
+DI > -DI
ADX > 25
RSI < 70 → Should not be in an overbought area
BE CAUTIOUS
-DI > +DI
ADX > 25
RSI > 30 → Should not be in an oversold area
BONK – Long Here, Patience RequiredTime to go long on $BONK.
Hard not to bid at this level—the risk/reward is solid.
Still expecting some range-bound price action before the real move kicks in, so patience is key here.
First target: the yearly open—nearly a 2x from current levels. BINANCE:BONKUSDT

From BONK to Boom: Is This a Full Impulse?If you find this information inspiring/helpful, please consider a boost and follow! Any questions or comments, please leave a comment!
BONK: Watching the Impulse Unfold
Looks like BONK may have bottomed at 887, where it kicked off what appears to be an impulsive move up.
The retrace that followed was suspicious—plenty of ways to count it depending on your lens—but price action eventually started hinting at a 12-12 or zigzag-style crossroad. That indecision resolved quickly once BONK cleared 1511, shifting the structure firmly back into bullish territory.
Now trading around 2242, the behavior is aligning with what you'd expect from a wave 3: strong momentum, vertical lift, and minimal resistance. It’s moving like a third wave should.
That said, there’s some heavy resistance sitting overhead at 2506, and it could stall or even reject price short-term. If it does, the next thing I’ll be watching is how price reacts—specifically looking for a clean wave 4 pullback and a final push into wave 5.
If we see that 4–5 structure play out at multiple degrees, it would go a long way toward confirming this whole move as a completed impulse off the low.
For now, this one stays on watch for the next setup.
Trade Safe!
Trade Clarity!

Bonk on a tear with fresh volumeBoy this alt market drawdown really taking its toll isnt it?
I think i might of found a relief rally here in Bonk.
Lets see how this prediction plays out

BONKUSDT 1D AnalysisBONK ~ 1D Analysis
#BONK Buy on retesting this support block or buy after successfully breaking this resistance line with a short term target of at least 15%+ and a long term target of $0.000065+

BONK About to Explode or Fakeout? Key Levels Are UnfoldingYello, Paradisers! Is #BONK gearing up for a face-melting rally, or is this just another trap designed for emotional traders?
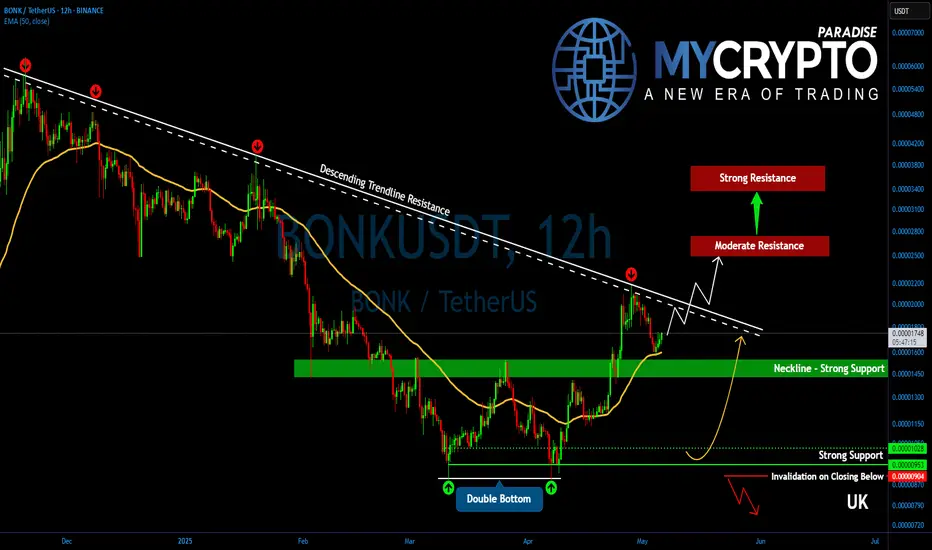
💎BONKUSDT has recently formed a double bottom, a key reversal pattern that often appears before significant bullish momentum kicks in. This comes after a sustained bearish trend, and we’re now seeing signs of strength re-entering the market.
💎What’s even more interesting, a lookalike of skewed triangle pattern is starting to emerge. These often signal continuation of strength, and when paired with an already bullish reversal, it paints a potentially explosive short-term picture.
💎#BONKUSDT is currently sitting on ascending support around the $0.00001980 level. This zone is further bolstered by the EMA-50, adding extra technical significance. If BONK can continue to hold this level, the price is well-positioned to push higher toward the $0.00002470 mark, a moderate resistance zone that could serve as the next stepping stone in this bullish scenario.
💎If BONK clears this resistance with conviction, momentum could pick up rapidly, opening the doors for an aggressive move toward the $0.00003100 to $0.00003400 region. This is a critical profit-taking zone, not only because of historical resistance but also due to a dense confluence of technical barriers.
💎Zooming into the 12-hour timeframe, BONK has just entered a golden cross formation. This bullish crossover is acting as dynamic support, with the $0.00001800 level becoming an important defensive area for price stability moving forward.
Paradisers, strive for consistency, not quick profits. Treat the market as a businessman, not as a gambler.
MyCryptoParadise
iFeel the success🌴

1000Bonk Day Trading SetupIf you see price starts consolidation at the poi, or see any 5m big green candle then enter with proper SL, will update trade should be closed or not.

#BONK/USDT#BONK
The price is moving within a descending channel on the 1-hour frame, adhering well to it, and is on its way to breaking it strongly upwards and retesting it.
We are seeing a bounce from the lower boundary of the descending channel. This support is at 0.00002070.
We have a downtrend on the RSI indicator that is about to break and retest, supporting the upward trend.
We are looking for stability above the 100 moving average.
Entry price: 0.00002205
First target: 0.00002287
Second target: 0.00002404
Third target: 0.00002551

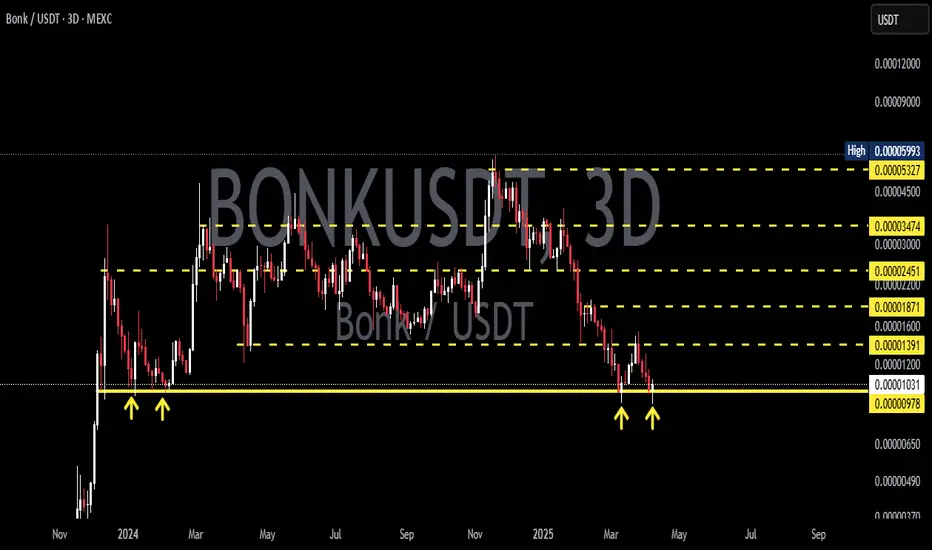
Bonk at Floor Price - 2x to 3x Pump Incoming?SEED_DONKEYDAN_MARKET_CAP:BONK has retested its 2024 floor price at $0.00001 - a zone that previously triggered strong upward moves. Could this be a reliable support once again and spark a 2x to 3x bounce from current market price at $0.00001135?
What's your take - bounce or breakdown from here?
Share your thoughts below!
Kindly support this idea with a LIKE👍 if you find it useful🥳
Happy Trading💰🥳🤗

BONKUSDT Up for a Major Breakout! Key Levels to Watch!Yello, Paradisers! Is #BONK about to explode higher after weeks of consolidation? A powerful shift is underway—and the bulls might just be waking up at the perfect time.
💎#BONKUSDT is beginning to show a notable short-term trend reversal, with a double bottom pattern now confirmed. This structure signals a potential end to the recent bearish control, and price action is now pressing against the descending trendline resistance. A successful breakout here could completely flip market dynamics in favor of the bulls.
💎Following a minor round of profit-taking at the descending resistance, BONK pulled back toward the previous breakout support. That retracement brought the price right back into the key supportive range between 0.00001550 and 0.00001425, where it's now starting to bounce again. Notably, the EMA-50 has aligned perfectly with this support zone, adding strength to the reaction from this area.
💎BONKUSDT's next challenge lies at 0.00002000 to 0.00002100—a major descending resistance level that has capped upside since December 2024. Breaking above this structure would be a critical bullish breakout, potentially unleashing the next wave of upside momentum.
💎If bulls push through this barrier, BONK is expected to move toward the next moderate resistance at 0.00002500 to 0.00002750. This area aligns with the measured target of the double bottom formation. However, if bullish strength continues to build, BONK may even extend toward the strong resistance between 0.00003400 and 0.00003700, where the 50% Fibonacci retracement also resides—a historically significant level for potential trend reversals.
💎Adding to the bullish case, the 12-hour EMA-50 and EMA-200 are now converging toward a possible Golden Cross. If this cross confirms, it could serve as a major technical catalyst for a broader trend reversal and further upside continuation.
Paradisers, strive for consistency, not quick profits. Treat the market as a businessman, not as a gambler.
MyCryptoParadise
iFeel the success🌴
#BONK/USDT#BONK
The price is moving within a descending channel on the 1-hour frame and is expected to break and continue upward.
We have a trend to stabilize above the 100 moving average once again.
We have a downtrend on the RSI indicator that supports the upward move with a breakout.
We have a support area at the lower boundary of the channel at 0.00001825, which acts as strong support from which the price can rebound.
Entry price: 0.00001883
First target: 0.00001967
Second target: 0.00002078
Third target: 0.00002222

$BONK: Prepping for a Potential Explosive Move🚀 SEED_DONKEYDAN_MARKET_CAP:BONK : Prepping for a Potential Explosive Move
SEED_DONKEYDAN_MARKET_CAP:BONK is known for its wild, high-volatility pumps—and we may be approaching another one.
After a significant bearish divergence on the daily chart, SEED_DONKEYDAN_MARKET_CAP:BONK has retraced to levels lower than last year. However, it's important to remember: SEED_DONKEYDAN_MARKET_CAP:BONK is the original meme coin of the Solana ecosystem, and it's strongly supported by Solana whales.
📈 If CRYPTOCAP:SOL rallies, SEED_DONKEYDAN_MARKET_CAP:BONK usually follows.
While a new all-time high might be out of reach in the short term, a significant move to the upside is on the table. Here's why:
✅ RSI is rising, forming a bullish divergence
✅ Price has entered my 2025 buy zone
✅ MACD has just crossed bullish on the 1D timeframe
✅ Volume is low, often a precursor to explosive moves
✅ CRYPTOCAP:OTHERS index is showing signs of strength—altcoin momentum is building
🧠 If momentum picks up, we could see a 2x to 3x move from current levels.
📌 Keep an eye on this one. As always, DYOR.
#BONK #Solana #MemeCoin #Altcoins #CryptoTrading #CryptoSignals #BONKArmy #MACD #RSI #DYOR #Altseason #CryptoAnalysis

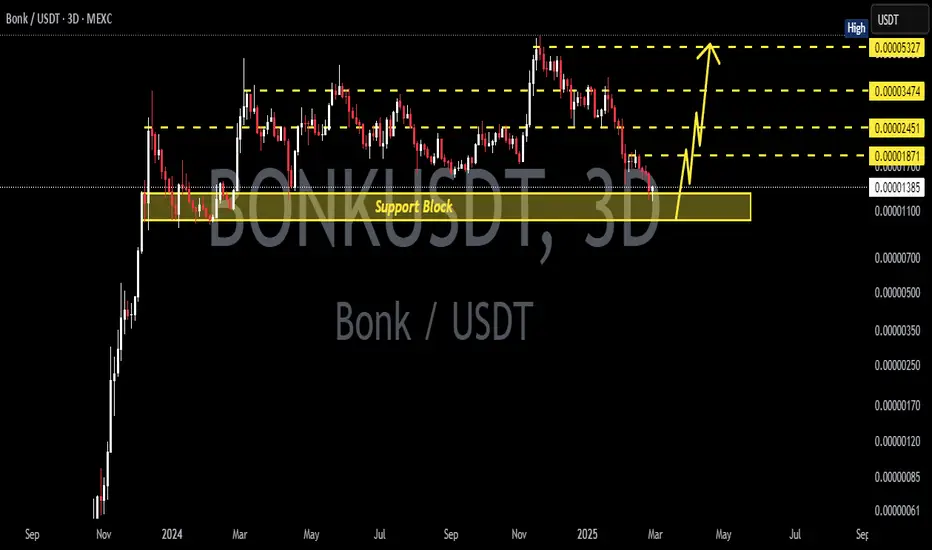
BONKUSDT 3DBONK ~ 3D Analysis
#BONK Important support that must be maintained for now. bouncing from here a short -term target of at least 15%+.
BONK: Time to BounceBONK has seen a 75% retracement to the downside since November and is currently holding at support. I would expect a bounce to the upper trend line. A clean break of the trend line would cause a huge move to the upside. Keep an eye at these levels.

BONKUSDT 3DBONK ~ 3D Analysis
#BONK Buy gradually from here if you still have a Conviction on this coin.
Reason, This support block is still maintained.
300% gains BONK Best Level to BUY/HOLD swing trade setup🔸Hello guys, today let's review daily price chart for BONK. Outlook remains bullish currently pullback in progress, however buying low still is a perfect trade setup.
🔸BONK is one of the top rated solana meme coins. currently undergoing correction and still not complete, however risk/reward is shifting in bulls favor right now. we are close to the floor / reload zone for the bulls.
🔸Recommended strategy bulls: Price action contained within bullish channel. get ready to buy low near 11000/13000, TP is 33000/36000 +300% gain. BUY/HOLD setup for patient traders. keep in mind that BONK already got a heavy valuation, so do not expect miracle overnight gains.
🎁Please hit the like button and
🎁Leave a comment to support our team!
RISK DISCLAIMER:
Trading Futures , Forex, CFDs and Stocks involves a risk of loss.
Please consider carefully if such trading is appropriate for you.
Past performance is not indicative of future results.
Always limit your leverage and use tight stop loss.


#BONK/USDT Ready to go higher#BONK
The price is moving in a descending channel on a 1-day frame and sticking to it well
We have a bounce from the lower limit of the descending channel, this support is at 0.00002500
We have a downtrend on the RSI indicator that is about to be broken, which supports the rise
We have a trend to stabilize above the moving average 100
Entry price 0.00003350
First target 0.00003500
Second target 0.00004186
Third target 0.00004854
