BONKUSDTBONKUSDT.
Will BONKUSDT get bids from buyers ?
As the price is at strong support level and bullish divergence indicating the buyers may attack this zone. If this happens and buyers start buying from here then the next target could be 0.00003570.
What you guys think of this idea?
BONKUSDT

Bonk Done Bonkin'Traders,
As mentioned in my recent videos and posts, meme-coins (of all categories of coin) are looking positive here, especially those on the Solana blockchain. We’ve talked about Wif. We’ve talked about Boden (up 31% today). We’ve referenced TRUMP. All of these are on the Solana blockchain. All are doing well.
Another one I have referenced, stating it is in a good position for future boom is BONK. Up over 40% from its low, it continues to 🚀🚀🚀! Where will it go? My guess is the top of our green channel or that .00045 level. That’s an 82% increase from here. And look at that beautiful double-bottom pattern we have formed. How many times have we’ve been successful trading that pattern (rhetorical question)? It’s our best setup by far so far. So, if you are wanting to enter this trade, we could get another small pullback tomorrow through Thursday but that’s not a risk I’d be willing to take as the thing could just continue to the moon. My preference would be entry here, setting stops somewhere just below that channel, and then holding on tight.

BONK surges 10%. Will the rally sustain?BONK’s price was bearish in the early hours of the day before support was established at the intra-day low of $0.00002. However, with the announcement of the treasury proposing an 84 billion token burn, the digital asset witnessed a 10% surge, reshaping investor sentiment and market trend.
This strategy is part of a broader effort to enhance token scarcity and increase its value over time. This can be considered as the turning point for BONK since decreasing the supply is usually positive for the investors. This burn according to the announcement represents the q2 amount of BONK sent to the DAO from BONKBot.
In April, the BONK Decentralized Autonomous Organization (DAO) had already set a precedent for such impactful decisions. The DAO passed a proposal to burn a staggering 278.39 trillion BONK, with the community vote showing overwhelming support: 418.63 trillion votes in favor, representing 99.9% approval.
The technical indicators on the BONKUSDT price chart point to continued bullish momentum. The Money Flow Index (MFI) rating of 68 suggests that money flows in the BONK market may sustain a bullish rally.
In addition, the Moving Average Convergence Divergence (MACD) has shifted into the positive region and above its signal line, reflecting a strengthening bullish trend. Moreover, the histogram developing higher bars suggests that buying pressure is increasing.
Concurrently, with a Relative Strength Index (RSI) rating of 67, this bullish momentum will likely trend upwards, with a potential target of $0.00003600 after hitting a double-bottom pattern on the 4-hour price chart.

BONK PlanAnother short position is loading on BONK. It's currently accumulating within this range. You can take a short position off the liquidity sweep, but if we strongly close above, expect a push higher. Keep an eye on the 4-hour closes, as they will be important indicators.

NOTCOIN Up 85% In Four Days. Targets & Trade Strategy.Traders,
So, two days after recommending, NOT coin had one last liquidation event before popping up and out of this bullish descending wedge nicely. It then proceeded to rally 85% from its wick low to its current price as of this post and a full 35% from where I recommended entry!
As I’ve stated previously, altcoins are few and far between right now for long entries. But there are a few you’ve heard me mention which have good setups. NOT coin was one of these and is why I entered initially.
If you are still looking to re-enter this coin, 15 cents appears to be a great level. You will see that volume has created a nice level of support at that price.
For those of you still in the trade, I have drawn four levels above my entry, the first level we’ve already hit at 15 cents. Target two comes at around 19 cents. Target three at 21. The final target is 25 cents plus.
Best of luck to you all!
Stay tuned and I’ll do some more analysis on some of my other recommendations, like BONK, up 15% today so far.
Stew

BONG long setup📉 BUY: BONKUSDT
📌 Entry Point: 0.000022-0.000023
⛔️ Stop-Loss: 0.0000175
🎯 Take-Profit #1: 0.000028
🎯 Take-Profit #2: 0.000035
🎯 Take-Profit #3: 0.000047

BONK Bullish Momentum BINANCE:BONKUSDT BYBIT:BONKUSDT BITGET:BONKUSDT
Structural changes in a larger timeframe
Testing Moving Average 21 and 34 (4-hour chart)

ready to fly , big pump for MONGGet ready for the biggest pump ever, given the compact size, increased holders, and attractive patterns
Community Verified icon

BONKUSDT - UniverseMetta - Analysis#BONKUSDT - UniverseMetta - Analysis
On D1, the price may push off from the lower border of the channel and begin an upward trend. From the border you can see a rebound of 30%, which indicates the presence of buyers.
On H4, for confirmation, you can wait for the formation of a 3-wave structure along the trend and consider buying. You should be careful if an ABC or 3-wave structure is formed, the price may make a false breakout and update the low again.
Target: 0.00002525 - 0.00003378

BULL FLAG PATTERN ON BONK TOKENBonk has formed bullish flag in mid time frame like 4h 6h 8h. After successful breakout it can lead up to 2x bullish wave in coming days.
Buy zone 0.000021 - 0.000023
Target 0.000027, 0.000030, 0.000035, 0.000042
Stop 0.000017

#BONK/USDT#BONK
The price is moving within a descending channel pattern on the 4-hour frame, which is a retracement pattern
We have a bounce from a major support area in the color EUR at 0.00001815
We have a tendency to stabilize above the Moving Average 100
We have a downtrend on the RSI indicator that supports the rise and gives greater momentum and the price is based on it
Entry price is 0.00002050
The first target is 0.00002465
The second goal is 0.00002870
The third goal is 0.00003360

bonk long into shortLong into short 5 wave channel. targed 1.618. We did hit the 1.272 in wave 3. bounced from 0.618 extension.
Manage risk correcly!
No financial advice do ur own research!

After bonk , pepe, turbo, it's time for mongCharts talk to you.
Take a look at the mong chart.
Volumes, breaks, liquidity limits.
I strongly believe in it.
It will have a good flight.
Accumulations have increased and
Attractive transactions of mong whales

BONK vs BITCOIN logical circle analysisIn the big picture, extremely BULLISH. Bonk is still a baby, his future is still ahead.
It can be seen that the bonk coin follows the logical rhythm of btc, which is important to me. The last three waves have been logical and also the unfinished fourth. Gives the probability that the next waves will be in the same rhythm.
I tried btc 100k+ to see what level bonk coin is and it was more difficult than I thought at first. Let's say today bonk is above 0.0001 when btc is 100k+, analyzing step by step will give us a better answer in the future. 0.0001 is the minimum set today, which may change in the future.
It is also complicated by the fact that it is not clearly known how much btc is over 100k.
btc 100k+ is step 1, there is also step 2 and it is 250k.
Many of my analyzes see a buy in May or June, possibly the same for the bonk coin.
3d chart
I could be wrong, I only show what I see, MoralDisciple

Will the rise restart? ---- BONKBONK was born in Solana. In the initial stage, it was used to airdrop to NFT holders in the ecosystem. Different from the current situation where meme is the speculation token, BONK holders have more crypto spirit. For BONK, the main pump is relying on the launch of the Solana phone. In order to encourage mobile phone sales, Solana airdropped Bonk to mobile phone users. The increase in topicality led to the increase in Bonk, which then led to an increase in mobile phone sales, and finally increased topicality. This is a classic meme marketing method.
There is another reason why we are talking about BONK today. But remember, this is just our surmise! ! ! It's no secret that DWF Labs is getting into the meme world. Neither Milady nor Floki has achieved 100% circulation, but they already have a good community. So among memes that have a good community and don't have full circulation, we find BONK. And in the following on DWF's X, we also found BONK. So, you get that. But this is all just our analysis and surmise, DYOR.
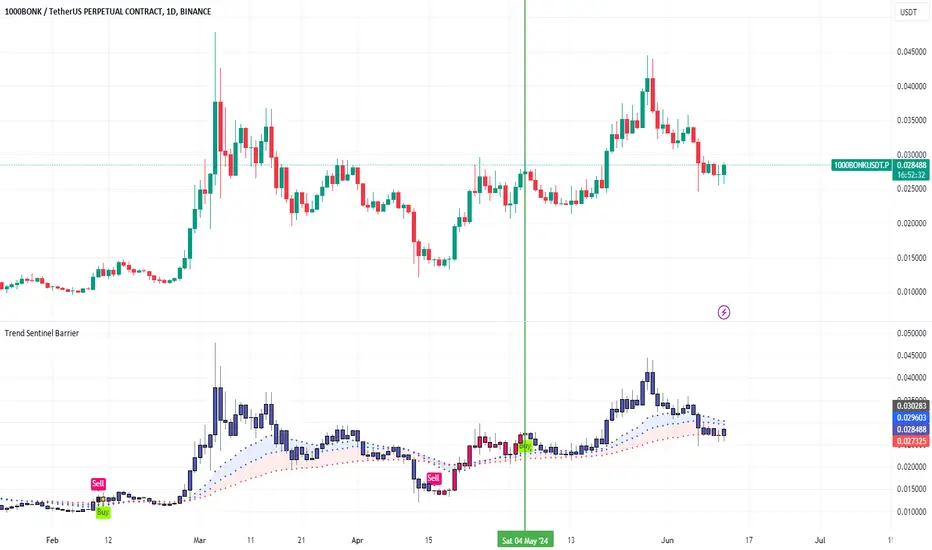
Returning to the technical level, the trend of BONK on Binance is to rise for a short time and correct for a long time. But the highs and lows are rising. We can see that on the TSB indicator, BONK is under a BUY signal. But the column has fallen back to the low rail of the wavy area. As we mentioned in the introduction to the indicator, under bullish signals, wavy areas provide support. So BONK may rebound at this position.
Introduction to indicators:
Trend Sentinel Barrier (TSB) is a trend indicator, using AI algorithm to calculate the cumulative trading volume of bulls and bears, identify trend direction and opportunities, and calculate short-term average cost in combination with changes of turnover ratio in multi-period trends, so as to grasp the profit from the trend more effectively without being cheated.
KDMM (KD Momentum Matrix) is not only a momentum indicator, but also a short-term indicator. It divides the movement of the candle into long and short term trends, as well as bullish and bearish momentum. It identifies the points where the bullish and bearish momentum increases and weakens, and effectively capture profits.
Disclaimer: Nothing in the script constitutes investment advice. The script objectively expounded the market situation and should not be construed as an offer to sell or an invitation to buy any cryptocurrencies.
Any decisions made based on the information contained in the script are your sole responsibility. Any investments made or to be made shall be with your independent analyses based on your financial situation and objectives.
#BONK Again Ready To Clear Liquidity and Liquidate Shorter #BONK Again Ready To Clear Liquidity and Liquidate Shorter ...
Will be update time by time

$BONK short term symmetrical triangle pattern about to break outUpdate: I have upgraded my account, so now I can do better charts. This is an update of my previous SEED_DONKEYDAN_MARKET_CAP:BONK idea published yesterday. Note that I am selling nothing, not affiliated to anything. It is my personal unbiased trading strategy.
Introduction
SEED_DONKEYDAN_MARKET_CAP:BONK is one of the most explosive memes in the top 100 crypto. Handle with care, as it can blow up at any time. It is the "official" meme of Solana. While, like
CRYPTOCAP:FLOKI , the meme itself is horrible visually, the community is huge and active.
History
SEED_DONKEYDAN_MARKET_CAP:BONK experienced a 30% pullback and is ready to pump again by 29%. If it passes through the $0.00003586 resistance, there is nothing to stop it until $0.00004424.
Chart Analysis
We can see the formation of a short term symmetrical triangle formation that is about to break out. The target of this for this pattern is $0.00003747
It is a meme; it is a very risky idea, so DYOR as always.
We do not recommend the use of technical analysis as a sole means of trading decisions. We do not recommend making hurried trading decisions. You should always understand that PAST PERFORMANCE IS NOT NECESSARILY INDICATIVE OF FUTURE RESULTS.

$BONK / USDT ready for another parabolic move?SEED_DONKEYDAN_MARKET_CAP:BONK is one of the most explosive memes in the top 100 crypto. Handle with care, as it can blow up at any time. It is the "official" meme of Solana. While, like CRYPTOCAP:FLOKI , the meme itself is horrible, the community is huge and active.
SEED_DONKEYDAN_MARKET_CAP:BONK experienced a 30% pullback and is ready to pump again by 29%. If it passes through the $0.00003586 resistance, there is nothing to stop it until $0.00004424.
The Ichimoku Cloud is again in the green, and the two lines have crossed, which is bullish on a 1-hour timeframe.
There is a directional trendline showing the potential for a parabolic move, if it happens.
Right now, SEED_DONKEYDAN_MARKET_CAP:BONK is crippled by a 1-hour bearish MACD, so we might see some pullback to the support at $0.00003335.
If CRYPTOCAP:BTC continues its uptrend, there is no reason why this would not happen.
It is a meme; it is a very risky idea, so DYOR as always.

BONK: Pullback in UptrendTrade setup : Price is in an Uptrend. Following a bullish breakout from Ascending Triangle, price got close to our near-term target of $0.000046 for +50% gain. Price got overbought (RSI > 75) got rejected at that resistance level and pulled back on some profit taking. Pullback to $0.000030 could be an attractive swing trade entry in Uptrend with +20% upside potential back to $0.000037 or +50% to $0.000046.
Pattern : Pullback in Uptrend. Price remains in an Uptrend but has pulled back, which could present a 'buying dip' opportunity. Traders should look for the nearest support level where price could stabilize and resume its Uptrend. This support level could be a level where price bounced off of in the past, or a level that was previously resistance. (concept known as polarity).Learn to trade key levels in Lesson 3.
Trend : Short-term trend is Up, Medium-term trend is Strong Up and Long-term trend is Strong Up.
Momentum : Price is neither overbought nor oversold currently, based on RSI-14 levels (RSI > 30 and RSI < 70).
Support and Resistance : Nearest Support Zone is $0.00003, then $0.00002. Nearest Resistance Zone is $0.000037, then $0.000046.

BONK Price Stumbles After Hitting ResistancePopular meme coin BONK is facing a price correction after encountering resistance at the $0.00002705 level on the daily timeframe.
The next support level for BONK is anticipated to be around $0.000022. If the price falls below the current level, it could indicate a further decline in the short term.

BONK → a valuable coin!hello guys...
Bonk is Solana's social layer and community meme coin with deep integrations as a utility token across a wide base of applications and protocols within the web3 ecosystem. We aim to achieve this by expanding our growing list of integrations.
bonk is bullish, why?!
1- it made an ascending channel!
2- it made a head and shoulders pattern!
3- it made another short time frame ascending channel too!
targets will be:
1-0.000054
2-0.000072
3-0.000103
___________________________
✓✓✓ always do your research.
❒❒❒ If you have any questions, you can write them in the comments below, and I will answer them.
❤︎ ❤︎ ❤︎And please don't forget to support this idea with your likes and comment

$BONK / USDT: Bullish trading plan, x10-x20 potentialWhat is SEED_DONKEYDAN_MARKET_CAP:BONK ?
SEED_DONKEYDAN_MARKET_CAP:BONK is a Solana-based meme coin that aims to serve as the “community coin of Solana,” according to its whitepaper.
Facts
- SEED_DONKEYDAN_MARKET_CAP:BONK is available on Binance and all major DEXs, such as Binance and Coinbase, for example. It holds the top position among coins on Solana and is managed by an anonymous team.
- Market Capitalization: $1,582.10M
- Circulating Supply: 63,823,117,391,692 BONK
- Maximum Supply: 93,082,000,358,974 BONK
- SEED_DONKEYDAN_MARKET_CAP:BONK boasts over 700,000 holders, with one whale owning 10% of the tokens.
These numbers suggest that SEED_DONKEYDAN_MARKET_CAP:BONK is undervalued compared to SEED_DONKEYDAN_MARKET_CAP:FLOKI , CRYPTOCAP:SHIB , or $PEPE. It is listed on all major exchanges, including Coinbase (where CRYPTOCAP:PEPE is not).
Analysis
Despite its unattractive design and limited popularity as a meme on Twitter, I remain bullish on SEED_DONKEYDAN_MARKET_CAP:BONK for several reasons:
1- SEED_DONKEYDAN_MARKET_CAP:BONK experienced an explosive rise to $0.000095 before undergoing a correction.
2- The price has now touched the 0.5 Fibonacci retracement line and entered the golden channel
3- Fibonacci retracement zone, indicating the end of the correction.
4- Fibonacci extension suggests a surge to the following target prices:
TP1: $0.00002940
TP2: $0.00003030
TP3: $0.00003190
Conclusion
Barring a black swan event (with rug pulling being the main risk in the meme coin space), this coin should perform well throughout this bull market, potentially offering a x10-x20 return on investment.
This is not an investment advice, DYOR. Also zoom in to see the details of the Fibonacci.
Post your profits in the comments!

BONK/USDT on the Brink of a Major Bullish Breakout | Watch Out👀💎Paradisers, #BONK is at a pivotal moment as it attempts to break free from a descending channel, supported by the 100-day & 50-day moving averages—a promising sign of an upcoming bullish surge.
💎We're anticipating a slight pullback to gain the necessary momentum to smash through the descending resistance. Once it conquers this barrier if SEED_DONKEYDAN_MARKET_CAP:BONK manages to hold its ground in this zone, expect a strong push towards and possibly beyond the major resistance levels.
💎However, the markets are fickle, and caution is paramount. If BINANCE:BONKUSDT cannot maintain its momentum and dips below the key demand level of $0.00002073, this could spell trouble, indicating a potential weakening of the bullish trend. In such a scenario, a rebound from the next critical support at $0.0000182 might be our saving grace, though breaching this could lead to a significant downturn.
💎Your ParadiseTeam is closely monitoring every development to guide you through this market. Stay prepared to make your move and capitalize on the opportunities that #BONK presents.
MyCryptoParadise
iFeel the success
