XAUUSD – Bulls Gaining the Edge?👋Hello everyone, what do you think about OANDA:XAUUSD ?
Yesterday, the market received a series of key US data, sending gold into constant swings. Here’s a quick breakdown of the impact on the precious metal:
🔻 ADP Non-Farm Employment Change: 54K < 73K (forecast) < 106K (previous) → Labor market weakens → USD down → Gold supported.
🔻 Unemployment Claims: 237K > 230K (forecast) > 229K (previous) → Jobless claims rise → USD down → Gold supported.
🔺 ISM Services PMI: 52.0 > 50.9 (forecast) > 50.1 (previous) → Services expand → USD stronger → Gold under pressure.
👉 Overall: 2 out of 3 data points came in negative for the USD, creating downward pressure on the dollar and supporting gold. Even though services data was positive, market sentiment still leans toward expectations of a less hawkish Fed → easing yields → gold benefits.
Preferred Strategy: Look for potential buying zones at support and Fibonacci retracement levels. The main target is a safe move above the trendline, with 3575 in focus.
Risk: If price closes below support, wait for fresh signals to identify safer entry points.
So, what do you think? Where will XAUUSD head next, and at what price will today’s session end?
Good luck!
Breakout

GBPUSD – Which Way Next?Hello everyone, what do you think about FX:GBPUSD ?
The pair is currently trading around 1.3450, after rebounding from a short-term support zone. Earlier, a sharp drop pushed GBPUSD lower, but buyers quickly stepped in. If buying pressure is strong enough, the pair could retest the 1.3500 – 1.3520 area.
On the other hand, the Support Zone remains a target for sellers. This is a crucial short-term phase: Buy if price holds support – Sell if it fails at resistance.
Which direction do you think GBPUSD will take? 📉📈

EURUSD – Struggling in the Decision Zone👋Hello everyone, what do you think about the FX:EURUSD trend?
Today, EURUSD continues to move within a narrow range, reflecting a sideways market after several sessions of consolidation. At the moment, price is still supported by the rising trendline and the 1.1620 – 1.1580 support zone. This remains a crucial foundation for buyers to maintain their advantage.
On the upside, the resistance zone at 1.1730 – 1.1760 is still a strong barrier. If buying pressure is sufficient to break through, the bullish trend will be reinforced, opening the path to higher targets.
With ongoing economic uncertainty in the US and expectations that the ECB will maintain its stable stance, EURUSD is facing the chance for a significant breakout.
Where do you think this pair will head next?

Gold Explodes Every Second👋 Hello everyone, let’s dive into OANDA:XAUUSD together!
Yesterday, gold continued its shocking rally, hitting 3600 USD for the first time in history, making the precious metal more attractive than ever – jumping over 500 pips in just a few hours.
This bullish momentum has been fueled by recent US economic data, especially the latest Non-Farm Payrolls (NFP) report.
📊 The figures show:
-Actual: 22K
-Forecast: 75K
-Previous: 79K
This is a strong bullish signal: far fewer jobs were created than expected, showing weakness in the US labor market → USD weakens → gold explodes higher!
On the chart, XAUUSD remains steady, currently retracing around 3586 USD. Supports keep forming, suggesting that after this pullback, another leg up is likely. The current environment is acting as a “tailwind” for gold – the strategy remains: Buy on dip with the main trend.
💬 What about you? Where do you think gold will head next? Share your thoughts in the comments!

NFP "Goldilocks" playbook? EURUSD triggers revealed!Markets are optimistic and consolidating ahead of the Non-Farm Payrolls (NFP) report, with EUR/USD poised for a breakout, plus a quick technical overview of gold, GBP/USD, and USD/JPY.
Mood : Buoyant—risk assets and equities are near weekly highs, bond yields are easing.
Consensus : A "Goldilocks" NFP (not too hot, not too cold) is expected, supporting a 25bp Fed rate cut this month and possibly another by year-end.
Catalysts : Recent softer labour data and dovish Fed commentary have fueled bets on a more accommodative policy stance.
EUR/USD Conditional Scenarios
Key Levels: Support at 1.1524, 1.1580, 1.1600, 1.1625; Resistance at 1.1700, 1.1735, 1.1760, 1.1830
Scenarios :
Strong NFP : Sell 1.1650–1.1670, targets 1.1600/1.1580/1.1524, stop 1.1700
Goldilocks NFP : Range trade 1.1625–1.1700, buy/sell at edges, stops 1.1580/1.1720
Weak NFP : Buy 1.1630–1.1650, targets 1.1735/1.1760/1.1830, stop 1.1600
Risk : 1–2% per trade, always use stops, watch for ECB-driven reversals
This content is not directed to residents of the EU or UK. Any opinions, news, research, analyses, prices or other information contained on this website is provided as general market commentary and does not constitute investment advice. ThinkMarkets will not accept liability for any loss or damage including, without limitation, to any loss of profit which may arise directly or indirectly from use of or reliance on such information.

Next Target for Gold: $3600?👋Hello everyone, what do you think about the trend of OANDA:XAUUSD ?
Gold has just made a powerful breakout, breaking through the old resistance zone and forming new support. Currently, the price is hovering around $3530 with signs of a minor top forming. The area around the Fib 0.5–0.618 is considered the Expected Retracement Zone where buyers are waiting to accumulate.
The EMA34 and EMA89 continue to support the trend, acting as dynamic support levels. The new resistance zone at $3,580 – $3,600 will be the next target if price sustains its rebound.
With the Fed likely to cut rates and the USD weakening, gold is once again being viewed as a top safe-haven asset. Each pullback now seems more like a springboard for the next rally.
So, what do you think? Will gold sustain this bullish trend? Share your thoughts in the comments💬!

USDJPY – Sideways Before the Next Big Move?👋Hello everyone, great to see you again in today’s analysis.
USDJPY continues its sideways streak, currently hovering around 148.3, close to the key resistance zone at 148.8 – 149.0, an area where sellers have historically reacted strongly.
📉Technical Analysis:
Price has tested resistance and shown signs of stalling, with another push targeting this zone.
Short-term EMAs still support the price, but if momentum fades, the market could quickly slide to 147.5.
A break below that would open the way for a deeper drop toward the 146.5 Support Zone.
🌎News Context: Markets are waiting for clear signals on whether the Fed will cut rates soon. Meanwhile, the persistently weak Yen raises concerns that the Bank of Japan may intervene to slow its decline. In addition, recent US data (JOLTS, PMI) show a cooling labor market — a trend that could further weigh on the USD.
📍 My view: USDJPY is likely to remain sideways. The strategy: sell near resistance, buy around support.
What about you? How do you see this pair moving next?

BTC ANALYSIS📊 #BTC Analysis
✅There is a formation of Descending Channel Pattern in daily time frame in #BTC .
Also there is a perfect breakout and retest. There is an instant major resistance and major support zone and if #BTC breaks the resistance zone then we would see a bullish move
👀Current Price: $1,10,800
🎯 Target Price : $1,21,700
⚡️What to do ?
👀Keep an eye on #BTC price action and volume. We can trade according to the chart and make some profits⚡️⚡️
#BTC #Cryptocurrency #Breakout #TechnicalAnalysis #DYOR

Gold battles for new highs.Hi everyone, Dorian here!
Gold continues to surprise as it hits the $3,600 mark for the first time in history, with an impressive 500-pip increase in just a few hours. This surge is driven by the weakening of the U.S. dollar and expectations that the Federal Reserve will cut interest rates this month.
On the chart, XAU/USD remains stable, currently hovering around $3,586. A new support level has formed, and after testing, gold may continue its upward trend. If this support level holds, I believe nothing will be able to stop gold from gaining momentum in the coming days, reaching new highs in 2025.
So, what are your thoughts on gold’s direction in the near future? Share your thoughts in the comments below!

EURUSD – Weakness Signals from the Diamond PatternHello everyone, what’s your view on EURUSD’s trend?
On the H4 chart, EURUSD is showing signs of imbalance after forming a Diamond Top pattern – a structure that often indicates bearish reversal. Price is currently stuck within the boundaries and has yet to show convincing breakout momentum.
If the lower boundary breaks, selling pressure could intensify, opening the way toward 1.1400, a key support zone. This outlook is further supported by the firm strength of the USD, backed by rising bond yields.
On the flip side, a breakout above the upper boundary would invalidate the bearish scenario.
The short-term bias still favors the sellers. Do you think EURUSD will soon slide toward the 1.1400 zone?

BTCUSD – Is the Big Wave Coming?Hello everyone, what do you think about BITSTAMP:BTCUSD ?
BTCUSD is now standing at a critical crossroads. After a short-term correction, price has continued to build a new support zone around $107,000. This is an area where buyers have consistently defended, showing that underlying demand remains strong.
In the past, after each strong rally, we saw a period of accumulation followed by another breakout. Every dip has been quickly absorbed, while volume has been increasing on each bounce – a clear signal that smart money is quietly accumulating.
On the news front, expectations of an upcoming Fed rate cut, combined with rising safe-haven demand amid economic and geopolitical uncertainty, are creating a powerful catalyst for BTC. This narrative positions Bitcoin not just as a risky asset, but as “digital gold” in the eyes of many institutional investors.
I expect this accumulation phase to end soon, with the Bulls regaining control.
What about you? What’s your view on BTCUSD? Share your thoughts in the comments!

USDJPY – Bullish Momentum StrengthensUSDJPY – Bullish Momentum Strengthens
Hello everyone,
The USDJPY pair continues to show upward momentum today as it trades within a rising channel. Price is currently well supported by the dynamic support line, while the overall trend still favors the bulls.
If buying pressure holds, the next target is the 155.000 zone, which coincides with the long-term descending resistance line. This will be a critical level to watch: a breakout above could pave the way for a stronger bullish extension.
On the other hand, if USDJPY loses dynamic support and closes below the channel, short-term correction risks will emerge.
Given the current setup, buyers clearly have the upper hand. Do you think USDJPY will reach 155.000 soon?

XAUUSD BreakoutAfter a strong rally up since the beginning of the year, Spot Gold struggled to breakthrough $3,425 for the last 129 days. However, since the beginning of the week Gold broke through that level surging +4.3%.
Seeing Gold continue to rally alongside the stock market, both of which at all time highs despite typically having an inverse relationship.
With M2 money supply ever growing, rate cuts continuing and acceptance of higher levels of inflation there is plenty of fuel to keep this move going no matter how unnatural it feels. Gold typically thrives in risk-off environments but this year has seen huge progress.
Now Gold has entered price discovery it's about riding the wave of momentum caused by the breakout. Should Gold turn around and get back below $3,425 there is potential for worry, a SFP confirmation is bearish. A retest of $3,425 as support with bullish continuation is a more comfortable hold.

XAUUSD – Bearish Crab Signals a Potential PullbackXAUUSD – Bearish Crab Signals a Potential Pullback
Today’s macro backdrop is weighing on gold as the USD recovers and bond yields edge higher, reducing expectations of an imminent Fed rate cut. This has cooled safe-haven demand and opened the door for profit-taking after the strong rally.
On the H4 chart, price has completed a Bearish Crab pattern at key extension levels, with reversal signals emerging near the 3,550 peak. This suggests the market may be entering a short-term corrective phase.
Key levels to watch:
Near-term resistance : 3,540–3,555
Target support 1 : 3,475–3,450
Target support 2 : 3,350–3,330
Deeper support : 3,290–3,270
The short-term bias has shifted toward the downside. Any technical pullback is likely to offer opportunities for sellers to rejoin.
Where do you think gold will find its next support in this correction?

Gold Technical Analysis – The Pullback DeepensHi everyone, let’s take a closer look at XAUUSD today!
Gold is still trading inside a broad upward channel, but momentum has slowed and the market is now in a corrective phase. After a strong rally, the pullback looks natural — with eyes on the 3,500 zone, where multiple supports converge: horizontal, trendline, and the 0.618 Fibonacci level.
This area is the real battleground. Hold the line, and buyers may step back in with force. Lose it, and the bullish structure breaks, paving the way for a deeper decline.
Stay sharp, validate your setups, and keep risk under control.
Good luck out there!

BTC: 112,681 in sight, 115.3k if breakout holds__________________________________________________________________________________
Market Overview
__________________________________________________________________________________
BTC bounced back above the weekly pivot 111,965 after a dip below 110k and is hovering near 112.2k, still trapped inside the 104k–116k corridor. Short-term momentum is positive but capped by a 4H/6H “Pivot High.”
Momentum: Bullish 📈 in the short term within a broader range; buyers defend 111,965 but meet supply at 112,681.
Key levels:
- Resistances (4H/6H → 1D): 112,681 (240 PH), 115,300 (720 PH), 124,277 (D PH, distant extension).
- Supports (4H → 1D): 111,965 (W PH turned support), 109,905 (240 PL), 107,300 (cluster PL).
Volumes: Normal on HTF; notable 1H spike during the recent push.
Multi-timeframe signals: ST (15m–1H) bullish; mid TF (2H–6H) still corrective; HTF (12H–1D) constructive → bias improves if 112,681 flips to support.
Risk On / Risk Off Indicator: VENTE (moderate risk-off) — it contradicts the intraday bounce and can cap extensions without a catalyst.
__________________________________________________________________________________
Trading Playbook
__________________________________________________________________________________
The market is a “range with a bullish lean”: trade conditional entries, confirm breakouts, and keep stops tight.
Global bias: Neutral Buy with key invalidation below 109,900 (loss of the 240 PL base).
Opportunities:
- Continuation long: break & retest of 112,681 to target 114.0k then 115.3k.
- Defensive long: clean pullback holding 111,965 (1H higher low) to re-test 112,681.
- Tactical short: clear rejection at 112.68–113.0k (bearish 4H candle) to 112.0k then 111.0k/109.9k.
Risk zones / invalidations:
- 4H–12H close below 111,965 reopens 110k then 109.9k.
- A reclaim above 115,300 invalidates the mid‑TF bearish structure and unlocks 120–124k.
Macro catalysts (Twitter, Perplexity, news):
- FOMC: September remains “live”; a cut is increasingly priced — supportive for risk if confirmed.
- NFP/Unemployment: a soft print would fuel risk-on and breakout follow‑throughs.
- Crypto liquidity: fresh $2B USDT mint + cross‑chain reallocations — deeper books if 112,681 breaks.
Action plan:
- Long (break & retest 112,681): Entry 112.70–112.85k / Stop <111.90k / TP1 114.0k, TP2 115.3k, TP3 120.0k / R:R ~1.8R to 3R.
- Short (rejection 112.68–113.0k): Entry 112.7–112.9k / Stop >113.1k / TP1 112.0k, TP2 111.0k, TP3 109.9k / R:R ~1.2R to 2.5R.
__________________________________________________________________________________
Multi-Timeframe Insights
__________________________________________________________________________________
This is a “range‑recovery” alignment: ST drives, mid TFs resist, HTFs remain supportive.
1D/12H: Constructive above 111,965; a clean move through 112,681 sets up a test of 115,300 (major range ceiling).
6H/4H/2H: Still printing a “lower high” under 115.3k; 112,681 is the rotation hinge — rejections = 112.0k/111,965 retests.
1H/30m/15m: Bullish momentum with elevated 1H volumes; needs solid close/retest above 112,681 to avoid a fakeout.
Key divergences/confluences: ST strength + HTF support vs Risk On / Risk Off Indicator in VENTE and mid‑TF corrective tone → prioritize confirmed flips at 112,681.
__________________________________________________________________________________
Macro & On-Chain Drivers
__________________________________________________________________________________
Macro is leaning toward monetary easing while stablecoin liquidity expands — a supportive backdrop if technical levels confirm.
Macro events: Fed keeps September “live” with a cut increasingly priced; a soft NFP would add risk-on fuel; oil softens and gold appetite stays firm — near‑term inflation pressure eases.
Bitcoin analysis: Price ~111.5–112k with short‑squeeze risk if momentum continues; BTC spot ETF flows remain flat vs improving ETH — implying measured BTC spot demand but reactive to technical breaks.
On-chain data: +$2B USDT minted and cross‑chain shifts → deeper market depth; URPD/accumulation in 108–116k matches the range; neutral funding = fragile momentum.
Expected impact: A dovish follow‑through (cut pricing + soft jobs) supports the “Neutral Buy” toward 115.3k; risk‑off shocks would pressure 111,965/109,9k.
__________________________________________________________________________________
Key Takeaways
__________________________________________________________________________________
Range market with a recovery bias as long as 111,965 holds and 112,681 turns into support.
- Overall trend: short‑term bullish/neutral inside the 104k–116k range.
- Most relevant setup: confirmed breakout above 112,681 targeting 115.3k.
- One key macro factor: growing odds of a September Fed cut boost risk appetite.
Stay disciplined: trade confirmation, not anticipation, and respect stops. ⚠️

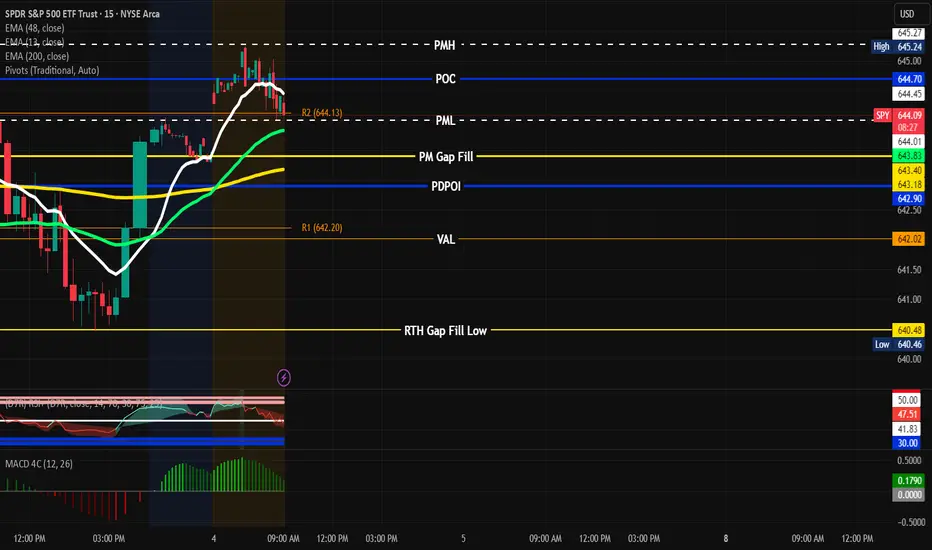
SPY setup 9/4/25PMH 645.27
PML 644.01
POI 645.24
PM Gap Fill 643.40
Range is between 6.43.17-645.27 Look for SPY to go back and retest PMH before coming back down to 644.70. If it breaks through look for it to go to PML 644.01 or Fill the Gap at 643.40. Wait for clear signs before hopping in. If it breaks, retest and hold PML look for PUTs to 642.90-642.20 T/P 1. If it breaks PMH and pullback and hold look to enter for CALL 646.10 T/P 1. You can also use the 9/13 EMA as entry. Use S/L and manage risk properly. Let’s Goooo! “Discipline is the tithe you pay, The reward is financial freedom.” - #You Got Options
Gold Continues to Create New HistoryHello, it’s a pleasure to see you again in today’s discussion about OANDA:XAUUSD . In this analysis, I have chosen the D1 chart for evaluation.
At the time of writing, gold continues to rise higher. The metal has reached the highest level in history, trading at 3535 USD. Previously, we had expected the 3500 USD level to be filled, and that target has now been achieved.
After a strong breakout, a clear candle close has made the Bulls even stronger, as gold continues its upward search with no new peak yet established. The previous resistance has now turned into new support. If a correction occurs, I believe that will be the area for buyers to step in. After that, the medium-term target will be in the range of 3600 – 3700 USD.
And you, how do you evaluate the next move of XAUUSD? Leave your thoughts in the comments!
Events to watch this week:
Wednesday, Sep 3: JOLTS Job Openings
Thursday, Sep 4: ADP Non-Farm Employment Change, Unemployment Claims, ISM Services PMI
Friday, Sep 5: Average Hourly Earnings, Non-Farm Employment Change, Unemployment Rate
These are all key U.S. economic data releases with the potential to create strong volatility in gold.

EURJPY: FakeoutEURJPY is currently undergoing an interesting transition. While the EMAs indicate that this pair is in an uptrend (where EMA20 is above EMA60), there's early indication that we might be seeing a downtrend soon.
Daily Timeframe:
Price attempted to cross above the daily level, but it failed to close above it. It's also a lower high after a strong run-up, which indicates to me that the upside momentum might be exhausting.
H1 Timeframe:
We see an intraday double top formation, which indicates that price is having a hard time pushing higher. Price also crossed below the intraday neckline.
While it tried to pull back above the intraday neckline, it quickly reverted below, indicating quite a bit of selling pressure.

XAUUSD – A New Bullish Wave Has BegunXAUUSD – A New Bullish Wave Has Begun
The Daily chart shows that gold has decisively broken above the flat resistance around 3,500 , marking a strong breakout after months of consolidation. This move completes the Ascending Triangle formation, confirming that buying pressure is in control.
In the short term, after the recent surge, the market may retrace slightly toward the 3,500–3,520 zone to retest this new support. If this level holds, the bullish trend is likely to continue, paving the way for further upside.
Key levels to watch:
Major Support: 3,500–3,520
Immediate Resistance: 3,575–3,600
Next Target: 3,700–3,750-3,800 if momentum remains strong
Technical signals remain aligned with the bulls. Any pullback should be seen as an opportunity to join the prevailing uptrend.
Do you think gold will push toward the 3,700 mark in this bullish wave?

EURUSD: Price Exit from Pennant and DropHello everyone, here is my breakdown of the current Euro setup.
Market Analysis
From a broader perspective, the price has been consolidating in a wide range between the 1.1600 support level and the 1.1720 resistance level. This extended period of balance has now tightened, leading to the current, more compressed pattern where a significant move is becoming more likely.
Currently, the price action is coiling within a pennant pattern. This compression of volatility suggests that energy is building for a breakout. The price is now trading very close to the apex of this pennant, testing the upper boundary near the major horizontal Resistance Zone.
My Scenario & Strategy
While a breakout from a pennant might seem likely, the overhead resistance at the 1.1720 level is historically significant. I'm watching for a situation where the market fakes a move to the upside to trap optimistic buyers before revealing its true intention.
Specifically, I'm watching for a brief dip, followed by a rally that pushes the price just above the pennant's resistance line and into the 1.1720 - 1.1730 resistance area. The key signal would be a swift and forceful rejection from this area, pushing the price back below the breakout point. And the primary target for the resulting decline is the 1.1600 level, which aligns with the major horizontal support zone.
That's the setup I'm tracking. Thank you for your attention, and always manage your risk.

Conslidation Box
Closed at 9.14 (23-05-2025)
Trying to break the long consolidation box.
Important Support Zone is around 8 - 8.70
Channel bottom is around 5.30 which seems
unlikely as of now because of Bullish Divergence
on weekly tf.
Upside targets can be around 11 & then around 14

XAUUSD: Ready for the Next Breakout?Hello, let’s take a broader look at OANDA:XAUUSD together.
Last Friday, gold surged strongly. The precious metal is now moving around 3447 USD and has become more attractive than ever.
So, what’s next for gold?
From an economic and market perspective, gold is benefiting from ongoing uncertainties, global conflicts, and speculation about the FED’s upcoming rate cuts. The weakening USD has been the driving force behind gold’s continued rally at this stage.
Technical outlook: Gold has just broken higher and is now facing its all-time highs. The formation of an ascending triangle is approaching its climax, and XAUUSD may break out to test higher levels. The answer is only a matter of time. A candle close above the resistance zone will be something to watch for, with the first psychological target at the 3500 USD round level.
Given the current setup, I’m waiting for XAUUSD to push through resistance.
What about you—what do you think will happen? Share your thoughts in the comments.
Good luck!
