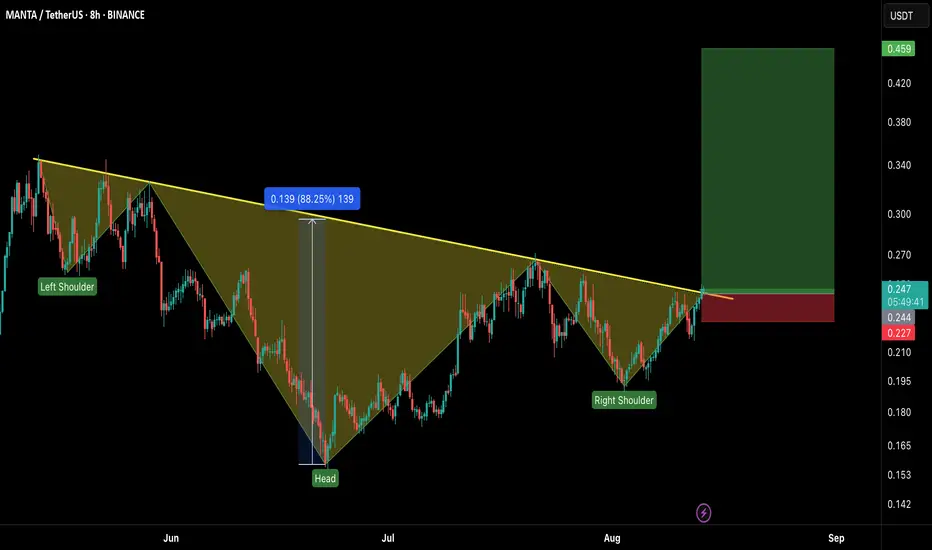
MANTA/USDT – Long Setup Alert!MANTA has just broken out of a massive Inverse Head & Shoulders pattern on the 8H chart — a bullish reversal signal that could ignite a strong upside rally. 📈
Setup Details:
Entry: CMP – 0.248
Stop Loss: 0.227 (below neckline retest)
Targets:
🎯 TP1: 0.34
🎯 TP2: 0.42
🎯 TP3: 0.459
Leverage: 5x max (adjust risk accordingly)
Why This Setup?
✅ Clean breakout above neckline after weeks of consolidation
✅ Volume supporting the breakout
✅ Pattern target aligns with strong resistance zone above
⚠️ Risk Management: Stick to your SL. A failed retest can trap late entries.
Bulls are in control — let’s ride this momentum!
Breakout
Apple Is Climbing the Fibonacci Channel Ladder – Step 5 Ahead?On the monthly chart, Apple (AAPL) is steadily moving within a well-defined ascending Fibonacci channel, like climbing a ladder — step by step.
The price is currently testing Step 4 , a zone that has acted as a strong resistance barrier.
Despite the pressure here, the structure still appears bullish, and even a minor pullback might simply be a pause before the next move.
If momentum picks up, we could soon see a breakout toward the next step — targeting 234 at Step 5.
The trend remains technically intact unless the channel is broken, and the overall formation still leans toward continuation.

NATGAS Swing Short! Sell!
Hello,Traders!
NATGAS made a bearish
Breakout of the key horizontal
Level of 2.895$ while trading
In a downtrend so we are
Bearish biased and we will
Be expecting a further
Bearish continuation
Sell!
Comment and subscribe to help us grow!
Check out other forecasts below too!
Disclosure: I am part of Trade Nation's Influencer program and receive a monthly fee for using their TradingView charts in my analysis.

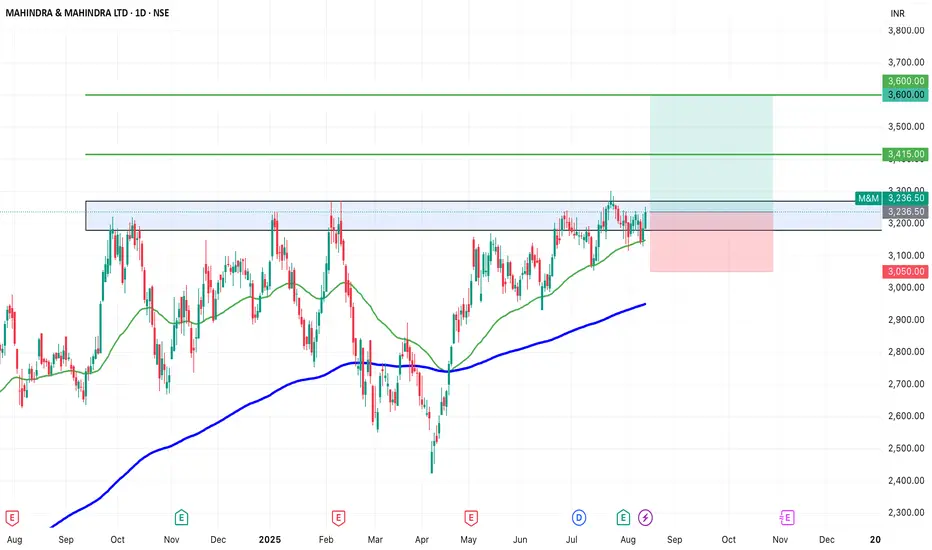
SWING IDEA - M&MM&M , a leading Indian automotive and farm equipment manufacturer, is showing signs of a potential breakout, making it a strong swing trading candidate.
Reasons are listed below :
3,200 resistance tested multiple times — now weakened and primed for a breakout
VCP (Volatility Contraction Pattern) forming, indicating accumulation
Trading above 50 & 200 EMA, confirming long-term trend strength
Inverse Head & Shoulders pattern forming, a bullish reversal setup
Target : 3415 // 3600
Stoploss : daily close below 3050
DISCLAIMER -
Decisions to buy, sell, hold or trade in securities, commodities and other investments involve risk and are best made based on the advice of qualified financial professionals. Any trading in securities or other investments involves a risk of substantial losses. The practice of "Day Trading" involves particularly high risks and can cause you to lose substantial sums of money. Before undertaking any trading program, you should consult a qualified financial professional. Please consider carefully whether such trading is suitable for you in light of your financial condition and ability to bear financial risks. Under no circumstances shall we be liable for any loss or damage you or anyone else incurs as a result of any trading or investment activity that you or anyone else engages in based on any information or material you receive through TradingView or our services.
@visionary.growth.insights
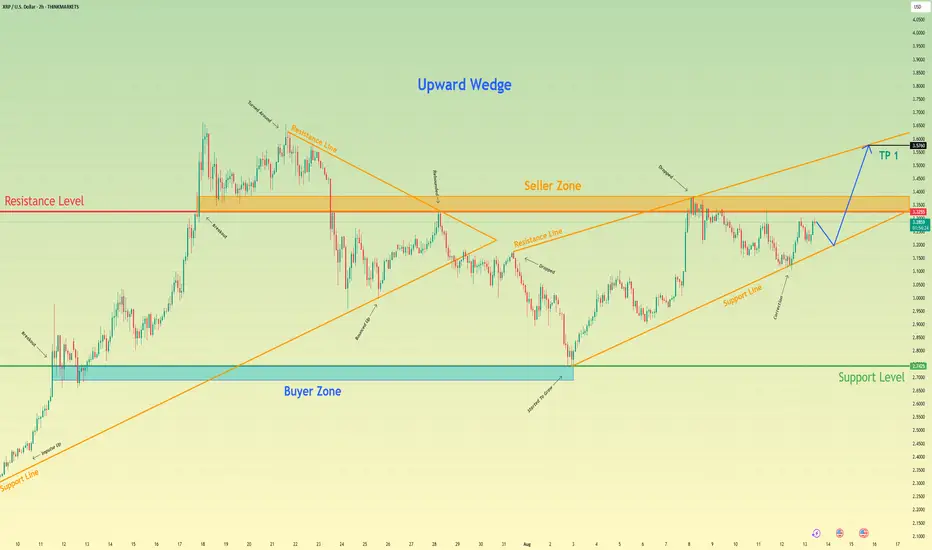
Ripple will continue to grow in wedge and break resistance levelHello traders, I want share with you my opinion about Ripple. The price action for Ripple has been methodically developing within the confines of a large upward wedge. This pattern has defined its strong upward trend since the last major rebound from the buyer zone around 2.7425. This structure has guided the asset higher through a series of corrections and upward rebounds, showcasing a sustained campaign by buyers. Currently, the price is at a critical juncture, consolidating directly below the significant horizontal resistance level at 3.3255. This level, which is also a major seller zone, has previously capped rallies and represents the most immediate obstacle to a continuation of the uptrend. The primary working hypothesis is a long scenario, based on the expectation of a decisive breakout above this resistance. Such a breakout would signify that buyers have absorbed the available supply and are ready to push the market to a new high. The scenario anticipates that following the initial break, the price will perform a corrective retest of the 3.3255 level, treating the former resistance as new support. A confirmed bounce from this retest would validate the breakout and provide the impetus for the next impulsive wave higher. Therefore, the TP for this continuation move is logically placed at the 3.5760 level, which aligns perfectly with the upper resistance line of the entire upward wedge formation. Please share this idea with your friends and click Boost 🚀
Disclaimer: As part of ThinkMarkets’ Influencer Program, I am sponsored to share and publish their charts in my analysis.
EURUSD short-term bullish outlookHello traders, what are your thoughts on the FX:EURUSD trend?
EURUSD is currently holding its uptrend within a rising channel, with key support around 1.1600 and a potential upside target near 1.1800.
The rising channel structure and stable 34 and 89 EMAs suggest that buying pressure could push the market beyond the current resistance area near 1.1700. However, a short-term pullback to retest support before resuming the climb is also a likely scenario.
Overall, the technical setup continues to favor a bullish outlook. Keep a close eye on the channel boundaries and resistance zones to refine your trade decisions.
In this analysis, I expect short-term upside momentum — what’s your view on this pair?

Gold steady near 3,350 after CPIHello everyone !
Gold prices remain steady around the 3,350 level, recovering notably from overnight lows following the release of U.S. inflation data.
July’s Consumer Price Index rose 2.7% year-on-year, slightly below the 2.8% forecast. However, core CPI climbed 3.1%, exceeding the 3.0% estimate and June’s 2.9% reading. These figures have reinforced market expectations for a 0.25% interest rate cut by the Federal Reserve on September 17.
The market also reacted to comments from U.S. President Donald Trump, who announced that imported gold would not face tariffs in the U.S. This decision has fueled volatility in gold over the past two sessions. Any tariff imposition on bullion could significantly impact global gold flows.
If the no-tariff policy is officially confirmed, gold prices may stabilize. However, any conflicting signals could trigger fresh price swings.
From a technical perspective, gold is consolidating in a sideways range after breaking below its trendline. The 3,360 to 3,380 zone is now acting as a strong resistance area. A strong rejection here could reignite the downtrend, targeting the 3,310 level initially, with a further drop towards the key 3,300 level.

AUDUSD Breakout Setup: Ready for Lift-Off!Hey Guys,
I’ve analyzed the AUDUSD pair for you. If the 0.65245 level breaks to the upside, my target will be 0.65416.
If it doesn’t break, I’ll be looking to buy around 0.65047 or 0.64954.
Either way, my final target remains 0.65416.
In this analysis, I’ve highlighted two key levels and shared my target. I’m planning to buy from these zones.
Every single like from you is my biggest source of motivation to keep sharing these analyses. Huge thanks to everyone who supports by liking!

US100 Bullish Breakout! Buy!
Hello,Traders!
US100 is trading in a
Strong uptrend and the
Index made a strong bullish
Breakout of the key horizontal
Level of 23,720 which is now
A support and the breakout
Is confirmed so we are
Bullish biased and we will
Be expecting a further
Bullish continuation
Buy!
Comment and subscribe to help us grow!
Check out other forecasts below too!
Disclosure: I am part of Trade Nation's Influencer program and receive a monthly fee for using their TradingView charts in my analysis.

NATGAS BEARISH BREAKOUT|SHORT|
✅NATGAS is going down currently
As the price broke the key structure level of 2.90$
Which is now a resistance, and after the pullback
And retest, I think the price will go further down
SHORT🔥
✅Like and subscribe to never miss a new idea!✅

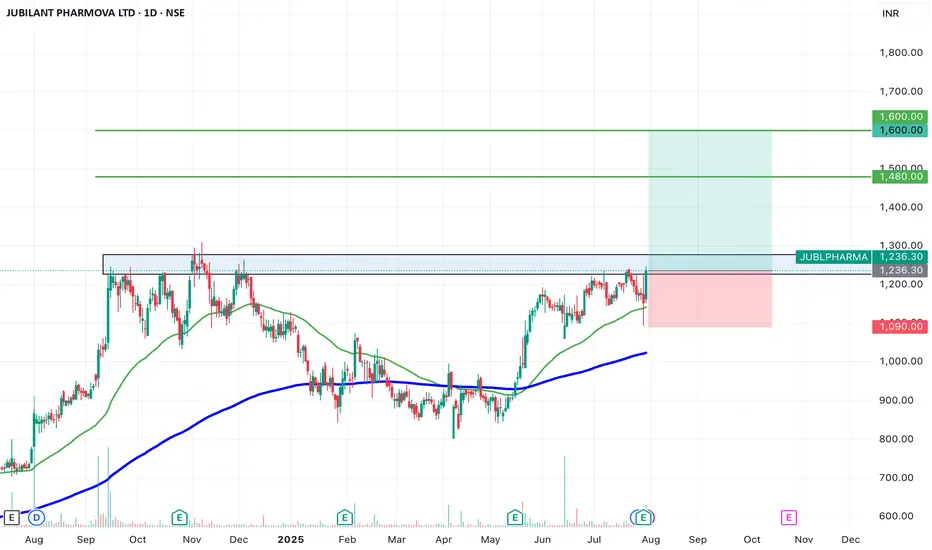
SWING IDEA - JUBILANT PHARMOVAJubilant Pharmova , a diversified pharmaceutical company focused on CRAMS and specialty pharma, is presenting a strong swing opportunity backed by a major pattern breakout and volume confirmation.
Reasons are listed below :
Breakout from an Inverted Head & Shoulders pattern after over a year of consolidation
Attempting breakout above 1250, a key resistance zone with multiple rejections in the past
Strong marubozu candle on the daily chart with a notable volume spike, signaling conviction
Trading near all-time highs, and comfortably above key EMAs, reinforcing trend strength
Target : 1480 // 1600
Stoploss : weekly close below 1090
DISCLAIMER -
Decisions to buy, sell, hold or trade in securities, commodities and other investments involve risk and are best made based on the advice of qualified financial professionals. Any trading in securities or other investments involves a risk of substantial losses. The practice of "Day Trading" involves particularly high risks and can cause you to lose substantial sums of money. Before undertaking any trading program, you should consult a qualified financial professional. Please consider carefully whether such trading is suitable for you in light of your financial condition and ability to bear financial risks. Under no circumstances shall we be liable for any loss or damage you or anyone else incurs as a result of any trading or investment activity that you or anyone else engages in based on any information or material you receive through TradingView or our services.
@visionary.growth.insights
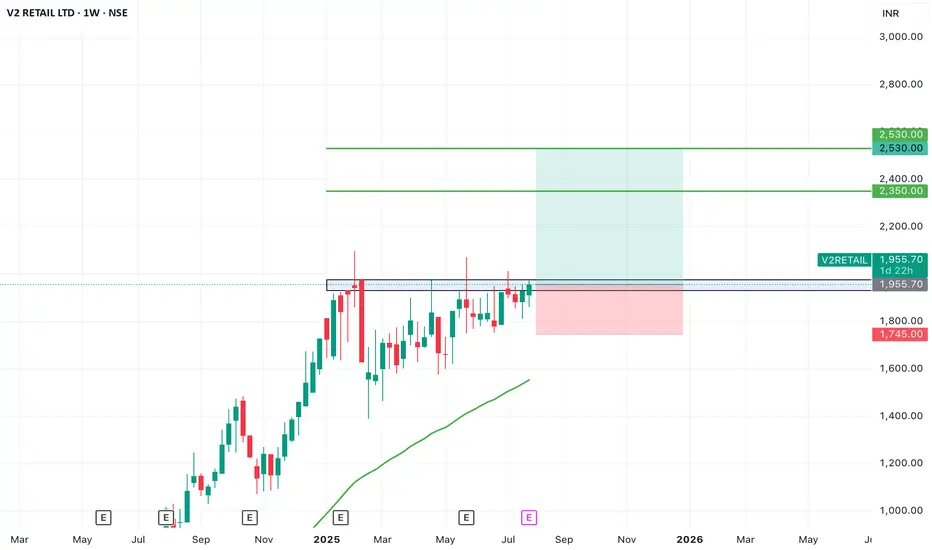
SWING IDEA - V2 RETAILV2 Retail , a small-cap value fashion retailer with a pan-India presence, is showing strong bullish momentum and a textbook swing trade setup backed by multiple breakout signals.
Reasons are listed below :
Breakout from a VCP (Volatility Contraction Pattern) – indicating accumulation and strength
Ascending triangle breakout – classic continuation pattern
Cleared major resistance zone, confirming bullish intent
Maintains a clear uptrend with higher highs and higher lows
Target - 2350 // 2530
Stoploss - weekly close below 1745
DISCLAIMER -
Decisions to buy, sell, hold or trade in securities, commodities and other investments involve risk and are best made based on the advice of qualified financial professionals. Any trading in securities or other investments involves a risk of substantial losses. The practice of "Day Trading" involves particularly high risks and can cause you to lose substantial sums of money. Before undertaking any trading program, you should consult a qualified financial professional. Please consider carefully whether such trading is suitable for you in light of your financial condition and ability to bear financial risks. Under no circumstances shall we be liable for any loss or damage you or anyone else incurs as a result of any trading or investment activity that you or anyone else engages in based on any information or material you receive through TradingView or our services.
@visionary.growth.insights
XAUUSD - Drowning in RedHello everyone, what do you think about OANDA:XAUUSD ?
The other day, we discussed the movement of gold within the wedge pattern and the potential for it to test the 3350 USD support before bouncing back. That target was met, however, the sharp and sudden decline caused gold to lose its momentum momentarily.
Yesterday, gold dropped straight from 3398 USD to 3342 USD, a loss of more than 55 USD in less than a single session. The drop on Monday pushed the price of gold below a critical level. Moreover, the oscillators on the chart above are showing a bearish trend, supporting the scenario of further price decline.
The current support level is at 3350 USD, and price movement is following the Dow Theory. However, a convincing break below this level would act as a new trigger for bearish traders, potentially accelerating the decline towards the intermediate support at 3,315 USD, and then heading towards the round figure of 3,300 USD.
Do you think XAUUSD can bounce back from the 3350 USD support level? Feel free to share your thoughts!

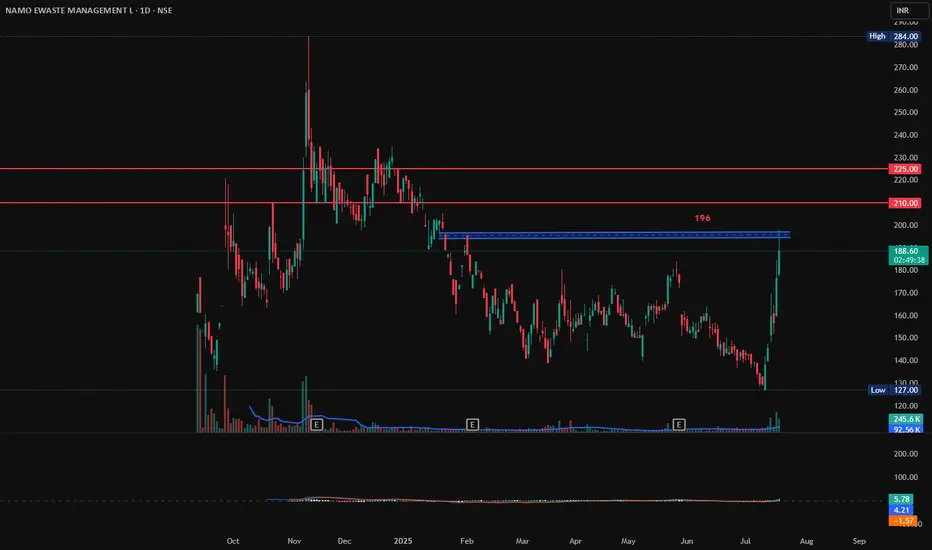
NAMO EWASTE MANAGEMENT, Long, Breakout, 1DNAMO EWASTE MANAGEMENT has gain 6% today with good volumes. If it breaks and sustains 196 with Bullish candlestick patterns like Bullish Engulfing, Hammer & Inverted Hammer, Piercing Line, Morning Star, Three White Soldiers, Tweezer Bottoms or Bullish Harami, then there are good chances for it to go further up from here. First target will be 210 and second target 225.
Entry: 196 (on Bullish candlestick pattern)
Target1: 210
Target2: 225.
SL: 185
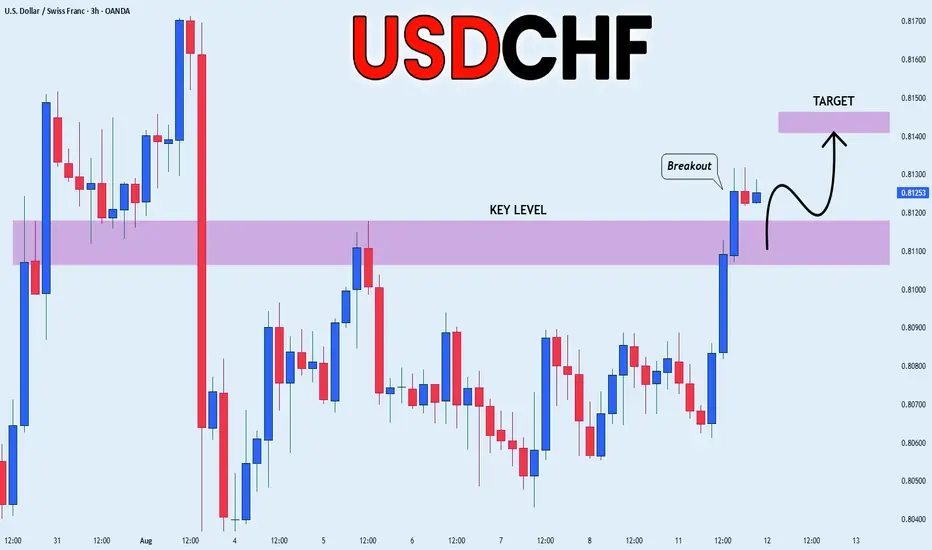
USD_CHF BULLISH BREAKOUT|LONG|
✅USD_CHF is going up
Now and the pair made a bullish
Breakout of the key horizontal
Level of 0.8118 and the breakout
Is confirmed so we are bullish
Biased and we will be expecting
A further bullish move up
LONG🚀
✅Like and subscribe to never miss a new idea!✅
EURGBP is Nearing the Daily Trend!!!Hey Traders, in the coming week we are monitoring EURBBP for a buying opportunity around 0.86400 zone, EURGBP is trading in an uptrend and currently is in a correction phase in which it is approaching the trend at 0.86400 support and resistance area.
Trade safe, Joe.

Different Strats, Same ChartICT, SMC, breakout traders, trendline traders… everyone swears they’ve got a unique edge, but it’s all pointing to the same POI. Same price, same reaction. Doesn’t matter what you call it — the market delivers the same setup for everyone, only difference is how you see it.

Bullish Energy in Natural Gas: -DMI Extreme + Wedge BreakoutThe Spark in the Gas Market
Natural gas has been quietly simmering in recent weeks, building pressure beneath a surface of consolidation. Traders watching closely will have noticed a rare alignment — one that history shows can potentially precede outsized moves. We’re talking about the convergence of two powerful signals: a -DMI yearly extreme and a falling wedge breakout.
In the past, this combination has marked moments when bearish momentum had run its course, giving way to swift and decisive bullish reversals. Now, that same alignment is flashing again, inviting a closer look at the technical landscape and the potential opportunities it presents.
Why This Setup Matters
The -DMI (Directional Movement Index) measures the strength of downward price moves. When it pushes beyond two standard deviations above its yearly linear regression channel, it signals an overextended bearish phase. Historically, these extremes have often coincided with market bottoms in Natural Gas Futures.
Layer on top a falling wedge — a bullish reversal chart pattern — and the probability of an upside move gains weight. The wedge compresses price action into a narrowing range, reflecting reduced volatility and setting the stage for a potential explosive breakout once resistance gives way. The current breakout level sits near 3.18, with technical projections aligning closely to a well-defined UFO resistance (UnFilled Orders) zone around 3.90.
The Technical Story Unfolds
Looking at the daily chart in the present, the -DMI has recently breached the +2 standard deviation boundary of its 252-period regression channel — a rare occurrence that, as said, has preceded multiple major bullish reversals in the past year. When this condition appeared, downside momentum often faded, making room for buyers to take control.
This time, the current signal aligns with a falling wedge that has been developing for weeks. Price is about to break above the wedge’s upper boundary at approximately 3.18, suggesting a potential trend reversal.
The Trade Blueprint
Direction: Long
Entry: 3.18 (confirmed breakout above wedge resistance)
Target: 3.90 (wedge projection + UFO resistance)
Stop Loss: 2.858 (below wedge and technical support floor)
Reward-to-Risk Ratio: ~2+ to 1
This structure allows traders to define risk tightly while targeting a meaningful upside move. The setup applies equally to both Natural Gas Futures (NG) and Micro Natural Gas Futures (MNG), offering flexibility in capital allocation. For smaller accounts or those wanting to reduce margin exposure, the MNG contract delivers the same tick size precision with only one-quarter of the notional value.
The Contract Advantage
Natural Gas Futures (NG) represent 10,000 MMBtu per contract, with a minimum tick size of 0.00025 — equivalent to $2.50 per tick.
Micro Natural Gas Futures (MNG) are one-tenth the size at 1,000 MMBtu per contract, with the same 0.00025 tick size equaling $0.25 per tick.
Margin requirements vary with volatility and exchange adjustments, but at the time of writing, the CME lists initial margin for NG in the range of $3,500 per contract, while MNG margins are proportionally lower at $350 per contract. This creates flexibility for traders to scale positions or manage risk without altering the technical logic of the trade. Both contracts trade nearly 24 hours per day, Sunday through Friday, offering the ability to react to global energy market shifts in real time.
Risk Management as the Safety Valve
Defining risk is the cornerstone of any trade plan. The stop loss at 2.858 is not arbitrary — it sits below both the wedge’s lower boundary and a nearby technical support level. If price were to close below this level, it would undermine the bullish thesis and call for an exit.
Using smaller MNG contracts can help align risk with account size, allowing for partial position scaling and better drawdown control. Equally important is avoiding undefined risk scenarios, particularly in a commodity as volatile as natural gas. Precision in both entries and exits reduces exposure to intraday whipsaws while maintaining the trade’s structural integrity.
Closing the Loop
The natural gas market has aligned a rare set of conditions — a -DMI yearly extreme and a falling wedge breakout — each of which has historically preceded significant upside moves on their own. Together, they offer a compelling technical case for a defined, risk-managed long position targeting the 3.90 zone.
While no setup guarantees success, this one seems to offer clarity: a well-defined entry, stop, and target, supported by historical probability and pattern structure. In volatile markets, those moments of clarity are worth paying attention to — and acting on with discipline, and always depending on the trader’s trading plan.
When charting futures, the data provided could be delayed. Traders working with the ticker symbols discussed in this idea may prefer to use CME Group real-time data plan on TradingView: www.tradingview.com - This consideration is particularly important for shorter-term traders, whereas it may be less critical for those focused on longer-term trading strategies.
General Disclaimer:
The trade ideas presented herein are solely for illustrative purposes forming a part of a case study intended to demonstrate key principles in risk management within the context of the specific market scenarios discussed. These ideas are not to be interpreted as investment recommendations or financial advice. They do not endorse or promote any specific trading strategies, financial products, or services. The information provided is based on data believed to be reliable; however, its accuracy or completeness cannot be guaranteed. Trading in financial markets involves risks, including the potential loss of principal. Each individual should conduct their own research and consult with professional financial advisors before making any investment decisions. The author or publisher of this content bears no responsibility for any actions taken based on the information provided or for any resultant financial or other losses.

XAGUSD Sell
Sell based on Cot and Technical analysis
Technical indaticator : Below Alligator + Alligator Hungery'
Breakout of consilidation

XRP Consolidation pattern breakout imminentLooks to me like XRP is breaking out of a rectangle or consolidation pattern as we speak.
Pattern formed since NOvember 2024 and since then XRP has been trading in this range.
Our current weekly candle is clearly in the process of attempting a breakout above the upper band or resistance trendline of the consolidation pattern.
We still have a day for candle close of this week.
Look to see if a potential engulfing candle print occurs or not.
Also note, this is by no means confirmation of the pattern break. We would need a concise bullish candle pattern for the next week to print for COnfirmation.
If we do confirm breakout. XRP will be back in price discovery mode like BTC. And i personally wouldn't sleep on it.
Its one of the better performers in crypto and seems like to me with every passing day a major player like BTC. (Opinion based on TA)
I would also monitor the MACD indicator. Observe for increasing histogram bars and deep green color as well as bullish cross.
On Macro timeframes, being above the 0 line on MACD is always bullish until we cross below.

CRUDE OIL BEARISH BREAKOUT|SHORT|
✅CRUDE OIL is going down currently
As the price broke the key structure level of 64.00$
Which is now a resistance, and has made a pullback
And the retest, so I think the price will keep going down now
SHORT🔥
✅Like and subscribe to never miss a new idea!✅

DAX WILL GO UP|LONG|
✅DAX is going up now
And the index made a
Breakout of the key horizontal
Level of 24,100 which is
Now a support then
Made a retest and a is now
Making a rebound already so
We are bullish biased and we
Will be expecting a further
Bullish move up
LONG🚀
✅Like and subscribe to never miss a new idea!✅

DOGE Breakout?After a 13 day rally and a 12 day pullback, could DOGE be breaking out and confirming a new 4H trading range?
After a bounce off the bullish orderblock DOGE has broken out of the diagonal downtrend, then pulled back to retest the previous diagonal resistance level as new support. This is a textbook breakout play & retest but this doesn't 100% guarantee the breakout will be successful. Should it be a successful breakout Local Resistance is the first clear level of interest for the bears to fight back.
This type of setup does give a clear invalidation should price fall back into the downtrend with acceptance. A fakeout could also lead to a loss of the Major Support level, that would introduce a potential revisit of $0.166.
