Maruti Suzuki Chart Breakout Watch | Ascending Triangle PatternNSE:MARUTI
Maruti Suzuki is currently forming a bullish ascending triangle pattern on the 1-hour chart, indicating potential for an upside breakout.
1. Pattern Formation: The price is making higher lows while facing horizontal resistance near the 12,700 zone — forming a classic ascending triangle.
2. Support Zone: Trendline support is holding well, currently near 12,550.
3. Breakout Levels: A confirmed breakout above 12,700 could trigger a sharp move toward the next resistances at 12,888, 13,075, and possibly 13,454.
4. Bullish: Post-breakout, price action is expected to retest and then rally — as shown by the projection arrows on the chart.
5. Volume Confirmation : Watch for volume expansion on breakout to confirm strength.
Trading Plan:
Buy on Breakout : Enter long above 12,700 with targets of 12,888 - 13,075 - 13,454. Use SL below 12,550.
Wait-and-Watch : If price fails to break out, stock may stay range-bound or retest trendline support.
Conclusion:
Price action suggests strength building up. A breakout from this pattern could lead to a fresh rally — ideal setup for short-term swing trades
Breakoutstocks

PB Fintech (NSE: 543390) Trade Setup📈 Breakout Watch | Price retesting key pivot at ₹1,745
Momentum building with RSI > 60 and bullish structure. Ideal for intraday or short swing.
🔵 Long Entry
Buy Above: ₹1,745 (Pivot breakout confirmation on 15m/1H candle close)
Target 1: ₹1,775 (minor resistance)
Target 2: ₹1,807 (next pivot)
Target 3: ₹1,869 (final swing target)
Stoploss: ₹1,720 (below previous candle low/support zone)
✅ Volume confirmation and RSI strength supporting move
🧠 Good for breakout traders looking for momentum continuation
🔴 Short Setup (if rejection from ₹1,745)
Sell Below: ₹1,730 (on rejection + bearish candle)
Target: ₹1,682
Stoploss: ₹1,745
📊 Indicators:
RSI: 65.7 → bullish, near breakout threshold
BB% B: 0.88 → strong bullish move near upper band

ADITYA BIRLA CAPITAL LTD – Trend Reversal Breakout Trade🧠 Technical Highlights:
Downtrend Channel Breakout: Clear breakout from a falling channel pattern
Resistance Break: Strong breakout above supply zone of ₹204–₹210
Volume: Massive volume spike validates bullish strength
RSI: Above 70, indicating strong momentum but not overbought yet
🟢 Buy Setup
Buy Above: ₹219 (today's close confirms breakout)
Stoploss: ₹204 (below the previous resistance/new support)
Target 1: ₹235
Target 2: ₹248
Target 3: ₹260+ (swing/high-risk high-reward)
🔻 Sell/Short Setup (only if reversal)
Sell Below: ₹203
Stoploss: ₹210
Target: ₹190, ₹178
📅 Timeframe: Short-to-Medium Term (2–6 weeks)
📊 Risk-Reward: ~1:2.5
For Education Purposes Only

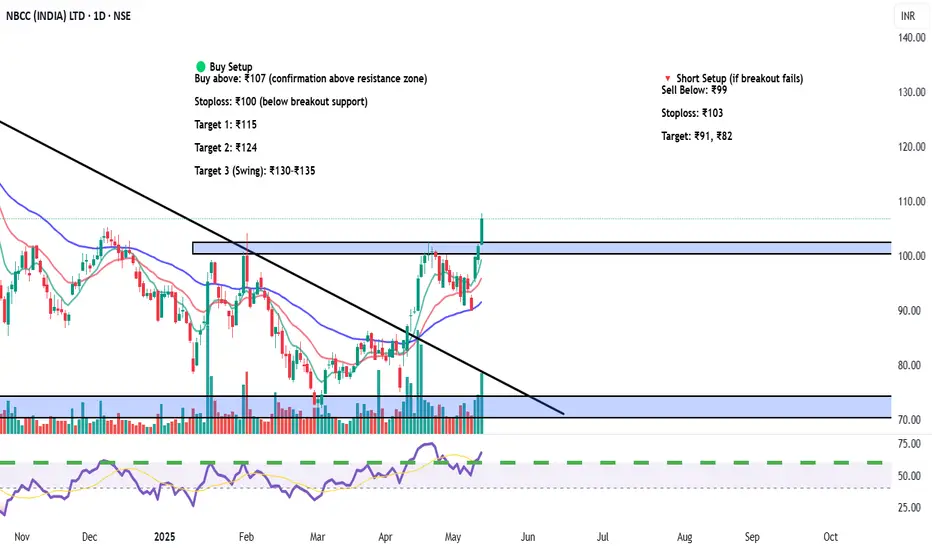
NBCC (India) Ltd (NSE: NBCC) – Breakout Trade Setup🧾 Equity Research Summary – NBCC (India) Ltd.
Sector: Construction & Infrastructure – Government PSU
Technical Setup: Trendline breakout + Base retest + Volume surge
Support Zone: ₹68–₹75
Breakout Zone: ₹100–₹103
Upside Potential: Strong move expected due to order book + infra push
Catalyst:
Government infrastructure spending
Order wins from CPWD, NBCC contracts, redevelopment projects
📅 Timeframe: Short-to-Medium Term (2–4 weeks)
📊 Risk-Reward: 1:2.5
🟢 Buy Setup
Buy above: ₹107 (confirmation above resistance zone)
Stoploss: ₹100 (below breakout support)
Target 1: ₹115
Target 2: ₹124
Target 3 (Swing): ₹130–₹135
🔻 Short Setup (if breakout fails)
Sell Below: ₹99
Stoploss: ₹103
Target: ₹91, ₹82
For Education Purposes Only
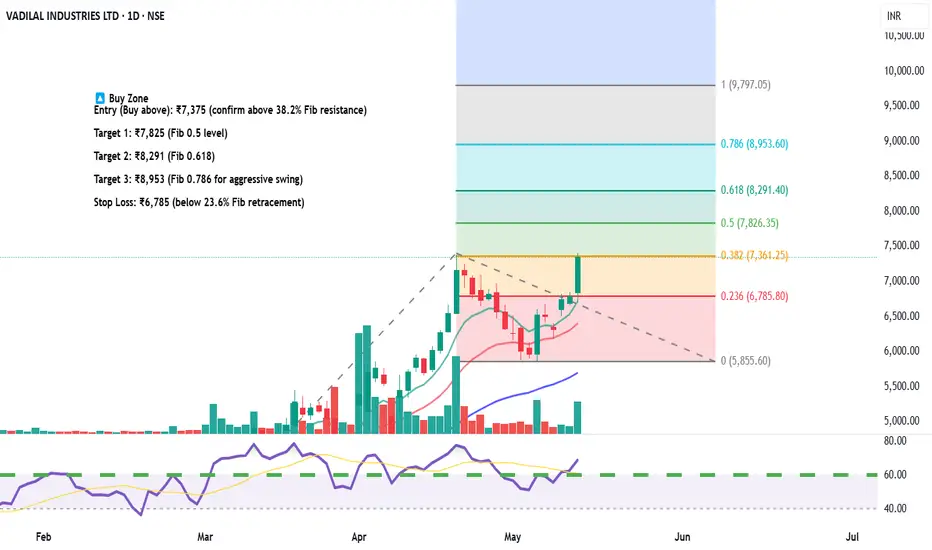
Vadilal Industries – Equity Trade Setup & Research View🟢 Long Trade Setup (Bullish Reversal Play)
Current Price: ₹7,346.50
Fibonacci Level Tested: 38.2% at ₹7,361 — a crucial breakout level
Trendline Breakout: Price has broken above falling trendline with volume confirmation
RSI: Near 60 – bullish momentum building
🔼 Buy Zone
Entry (Buy above): ₹7,375 (confirm above 38.2% Fib resistance)
Target 1: ₹7,825 (Fib 0.5 level)
Target 2: ₹8,291 (Fib 0.618)
Target 3: ₹8,953 (Fib 0.786 for aggressive swing)
Stop Loss: ₹6,785 (below 23.6% Fib retracement)
🔻 Short Trade Setup (if rejection happens)
Sell Below: ₹7,200
Target: ₹6,785
Stoploss: ₹7,375
📅 Timeframe: Daily (1D)
📊 Risk/Reward Ratio: 1:2.5+
🔁 Valid for: Next 2–4 weeks
For Education Purposes Only
SBFC FINANCE Breakout from Long Consolidation | Strong Volume✅ Recommendation: Buy (Post-Breakout Strategy)
CMP: ₹108
Buy Zone: ₹106–₹108 (current price is still within a safe buying range after breakout)
Target 1: ₹120
Target 2: ₹135
Stop-Loss: ₹98 (just below breakout zone)
Risk-Reward Ratio: ~1:2 (ideal)
⚠️ Caution
Don’t chase if the price shoots up quickly from here. Wait for minor dips toward ₹106 to enter.
If price closes below ₹98 with volume, the breakout may fail — consider exiting.
for educational purposes only

Gabriel India Ltd (GABRIEL) – Weekly Resistance Breakout Setup✅ Trade Idea:
Price has reclaimed the 0.618 retracement at ₹608.25
Breakout above the ₹612 horizontal level (weekly closing basis)
Volume is rising and RSI shows strong uptrend
💰 Buy Zone:
Entry: ₹610 – ₹613
(preferably above ₹612 on strong 15min or 1H candle close)
🎯 Targets:
T1: ₹630 (previous minor supply zone)
T2: ₹646.65 (Fib 0.786 level)
T3: ₹695.55 (Fib 1.0 extension)
T4: ₹836.85 (1.618 extension for swing positional)
🛑 Stop Loss:
Intraday SL: ₹598 (below 9 EMA on 1H)
Swing SL: ₹581 (Fib 0.5 retracement support)
🔁 Strategy:
Wait for confirmation via volume + RSI > 60
Trail SL to ₹610 once ₹630 is hit
Lock partial profit near ₹646 if market sentiment weakens
For Education Purposes Only

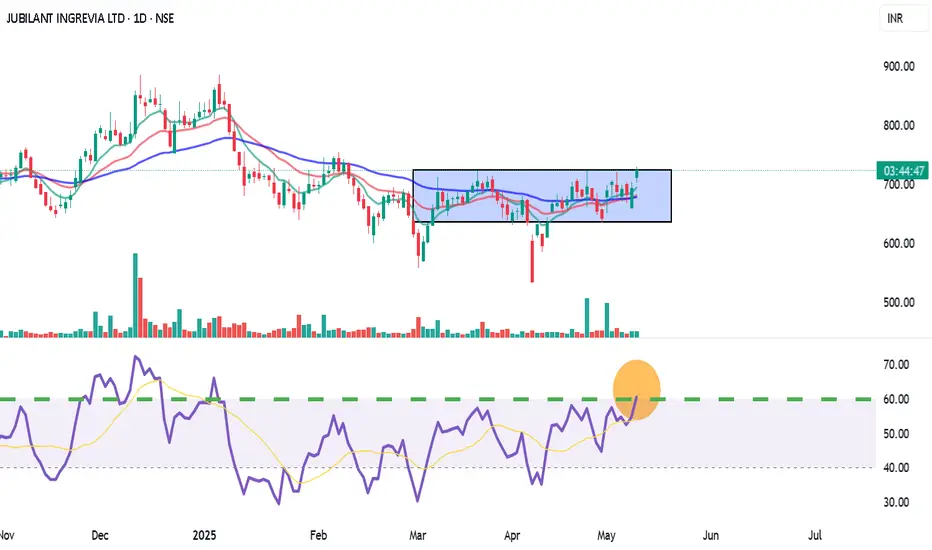
Jubilant Ingrevia (JUBLINGREA) – Short-Term Breakout Trade LTP: ₹726.30 | Recommended Entry: ₹722.00 – ₹723.00
Type: Short-Term Swing / Intraday MTF Trade
✅ Trade Setup:
Breakout above horizontal resistance near ₹725.75
9 EMA has crossed 26 EMA (bullish momentum)
RSI at 60.84 – strong trend, room for upside
BB %B: 0.96 – price pushing upper band = momentum buying
Good volume breakout on daily TF confirms buying interest
🟢 Buy Zone: ₹722 – ₹723
🔁 On retest or 15-min candle close above ₹725.75 with volume
🎯 Targets:
T1: ₹738
T2: ₹750 (supply zone / fib level)
T3: ₹765+ (if breakout sustains in 1H)
🛑 Stop Loss:
Conservative SL: ₹707 (below support + 9EMA)
Aggressive SL: ₹712 (tight SL for intraday)
For Education Purposes Only
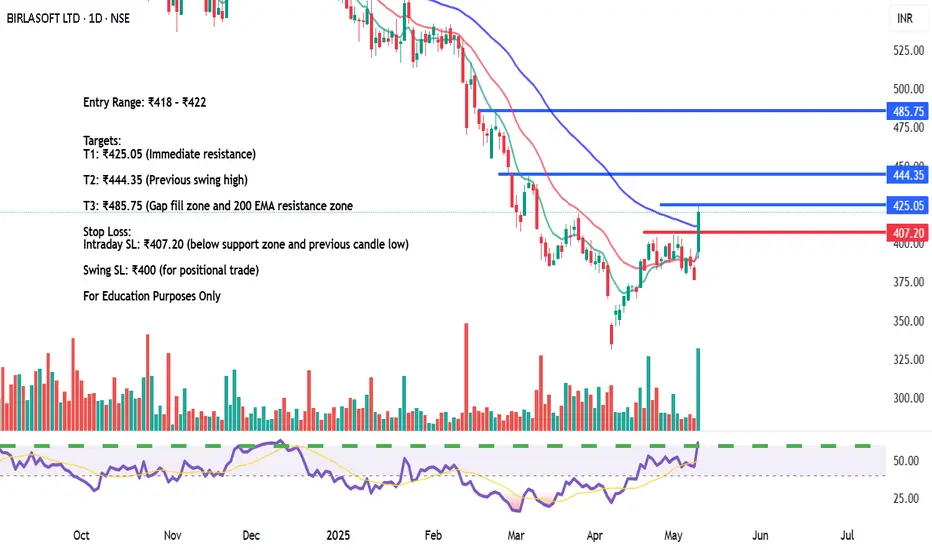
BIRLASOFT LTD – Bullish Reversal with Volume Surge✅ Trade Plan:
Stock gave a bullish breakout with a large green candle & volume spike
RSI crossed 60 level – bullish strength confirmed
Price broke above short-term resistance zone at ₹407 and nearing ₹425
💰 Buy Zone:
Entry Range: ₹418 – ₹422 (on 15min or 1H candle close above ₹420)
🎯 Targets:
T1: ₹425.05 (Immediate resistance)
T2: ₹444.35 (Previous swing high)
T3: ₹485.75 (Gap fill zone and 200 EMA resistance zone)
🛑 Stop Loss:
Intraday SL: ₹407.20 (below support zone and previous candle low)
Swing SL: ₹400 (for positional trade)
🔁 Strategy:
Scalp at ₹425 with 30–40% booking
Hold rest for breakout continuation toward ₹444+
Trail SL to ₹415 once above ₹425
For Education Purposes Only
Equity Trade Setup – Siemens Ltd. (NSE: SIEMENS)Trade Type: Breakout + Channel Trend Continuation
🔹 Trade Details
Buy Zone (Entry): ₹2,982.00 – ₹2,987.00
Current LTP: ₹2,970.00
Stoploss (SL): ₹2,887.00 (below recent swing support)
Target (T1): ₹3,150.00
Target %: ~5.46%
Timeframe: 3–5 trading days
R:R Ratio: ~2:1
Confidence: Moderate to High (subject to intraday volume confirmation)
For Education Purposes Only

JK CEMENT | Strong Volume Breakout | Short-Term Upside in Play📈 Short-Term Trade Plan:
Buy Zone: ₹5,240–₹5,255 (on retest of breakout zone)
Target 1: ₹5,310
Target 2: ₹5,360
Stoploss: ₹5,195 (below the breakout candle wick)
🔍 Technical Insights:
Strong volume surge on breakout above ₹5,220–₹5,230 resistance zone.
RSI comfortably above 60, suggesting sustained strength.
Box breakout pattern typically suggests upward continuation with momentum.
for educational purposes only

JUSTDIAL LTD Falling Wedge (Bullish breakout)🔁 Chart Analysis Summary
Weekly RSI is reversing from oversold levels and shows bullish divergence.
Volume on breakout candle confirms strength.
Clear breakout above falling wedge indicates a trend reversal.
✅ Buy Recommendation
Buy above: ₹925 (Confirmation of breakout)
Target 1: ₹1,050
Target 2: ₹1,250
Target 3: ₹1,400+ (Long-term potential based on pattern projection)
❌ Stop Loss
SL: ₹840 (Below wedge support & recent low)
for educational purposes only

ONE POINT ONE SOL LTD bullish reversal pattern✅ Trade Setup (Swing Trade)
📌 CMP: ₹62.21
🟢 Entry (Buy Zone): ₹60–₹63
🎯 Targets:
Target 1: ₹69.80 (Fibo 0.382)
Target 2: ₹78.50 (Fibo 0.5)
Target 3: ₹87.30 (Fibo 0.618)
🛑 Stoploss: ₹55 (below wedge breakout and recent support)
⚖️ Risk-Reward Ratio:
Entry: ₹62 | SL: ₹55 | Target 1: ₹70 → ~1:1
For higher targets, risk-reward improves to 2:1 or more.
for educational purposes only

Sanathan Textiles | Breakout After Rounded Bottom Setup Overview:
The stock has formed a rounded bottom pattern, indicating accumulation and a potential breakout.
Strong bullish weekly candle with a 10% gain and breakout above resistance box.
RSI showing an upward breakout from oversold zone = bullish momentum building.
Recommendation
Buy Zone: ₹410–₹420 (current market price ₹417.60)
Stoploss: ₹378 (below last higher low and box bottom)
Target 1: ₹480
Target 2: ₹525
Target 3 (swing): ₹600+
⏳ Ideal for swing to medium-term traders (1–8 weeks holding time).
for educational purposes only

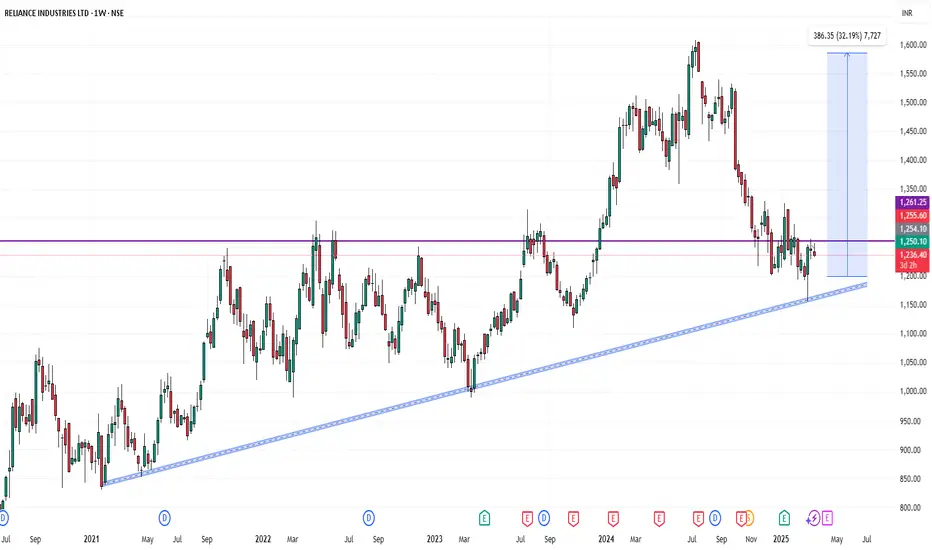
Reliance Industries📈 Reliance Industries Breakout Alert – ₹1241 Key Level Breached 🚀
Reliance Industries has successfully broken out above a strong resistance zone near ₹1241, indicating a potential bullish move ahead. This level acted as a critical supply zone in the past, and the breakout with volume confirmation adds strength to the trend.
🔍 Technical Highlights:
Breakout Level: ₹1241
Volume: Above average (confirming strength)
Trend: Bullish
Next Resistance Zones: ₹1265 / ₹1290
Support Zones: ₹1220 / ₹1200 (previous resistance now acting as support)
Harsha engineering good swing pick?Harsha engineering from fundamental pov company is debt free and has delivered a good cagr return
Now stock is at good value looks like in mid of Jan month it will pop up with good volume
Risk traders can accumulate at cmp keeping sl at 475 almost 8% while safe trader can accumulate at 485-515
Tgt 562 598 676 720
Only for educational purposes
Ask your financial advisor and broker before buying

JSW ENERGY BREAKOUT LEVELS JSW Energy - Potential Breakout Setup
📈 Analysis: JSW Energy is showing signs of building momentum. The stock is currently testing a key resistance zone at ₹ . If the price breaks above this level, we could see a strong breakout rally. A clean breakout above ₹ would confirm the bullish trend, potentially targeting ₹ in the near term.
🔑 Key Factors to Monitor:
Look for an increase in volume as confirmation of the breakout.
A close above ₹ on high volume will likely push the stock higher.
The RSI is showing strong bullish momentum, suggesting more upside potential.
Watch out for any reversal patterns or resistance re-tests after the breakout.
💡 Trade Idea:
📅 Timeframe: Watch for price action over the next few sessions to confirm the breakout.
📌 Disclaimer: This post is for educational purposes and does not constitute financial advice. Always perform your own analysis or consult a professional before making any trades.

GOLDEN Breakout setup on Nifty 50 for (30-12-24)Nifty 50 index was going sideways for 3 days, today it gave bull breakout but not sustained properly. So next trading day can become significantly important if you do breakout trades!
ANALYSIS :
On chart you can see I am using my custom build indicator named Golden Trading System (GTS) it shows two significant support and resistance zones which works like magic! as of now it is not published but you can follow us to get notified when we publish this.
How you can use it ?
Alternatively you can use standard pivot point and change the pivot type to camarilla. Here we will only use H3-H4 and L3-L4.
In the chart you can see I already marked the H3-H4 and L3-L4 for tomorrow (30-12-24) so you can use that instead.
How to TRADE ?
Tomorrow (30-12-24) three thing can happen :-
(i) If market gave breakout the green band (H3-H4) we can look Long setup.
(ii) If market gave breakout the red band (L3-L4) we can look Short setup.
(iii) Market can go sideways / range bound between green band and red band.
CAUTION :-
While taking bullish trades we should not neglect the red resistance line and also While taking bearish trades we should not neglect the red support line because form those points market can reverse so trade cautiously and with "Stop Loss".

PDSL - Near ATH - looking strongPDSL has come close to ATH and looks strong.
Volume picking up and RSI is also stronger.
Stock can goes sideway for few days or drop a little to cool down the RSI, then it should take the flight up.
I will keep updating this idea, keep a watch.
Any comment or feedback on this idea are welcome.

Tesla's Electrifying Rally: Stock Zooms to New Peaks● After facing a notable setback at the $415 mark, the stock took a dramatic plunge, dropping around 75% before finding its footing close to the $100 threshold.
● Following this, the stock entered an extended period of consolidation, eventually created a Rounding Bottom pattern.
● Recently, the stock has surpassed its previous resistance and reached all-time high.
● This breakthrough has sparked significant excitement, with optimism soaring about the stock's future growth potential.

DCAL - READY TO SOAR - A buy on DIP stockAGAINNNNNN....
with a big OPPORTUNITY in DISHMAN CARBOGEN AMCIS LTD🚀🚀
This stock has completed its correction and it's now ready to move towards north. let see how?
Technical view- a simple understanding for beginners
* The stock has given a breakout with good intensity of volume .
* The price changed its structure from lower low to higher high
* Stock price is challenging Upper Bollinger Band
* RSI ( a strength indicator) is above 60 in Daily Time Frame which indicates strong momentum
Understanding Waves
Key Elliott Wave Principles:
1. Five-Wave Impulse Pattern : The primary trend unfolds in five waves (1-2-3-4-5). Waves 1, 3, and 5 move in the direction of the trend, while waves 2 and 4 are corrective.
2. Three-Wave Corrective Pattern: After a five-wave sequence, a correction typically follows, consisting of three waves (A-B-C) that move against the primary trend.
3. Wave Relationships: Fibonacci ratios play a crucial role in Elliott Wave analysis, often governing the length of the waves.
4. Wave Characteristics: Each wave has its own set of characteristics. For example, Wave 3 is usually the most powerful, showing the strongest price movement, while Wave 5 may signal the final push before a significant correction.
Current Elliott Wave Analysis on DCAL
- The stock is currently in bigger IMPULSE Wave in which it has completed wave 1 and wave 2 (correction) now it is in the bigger and the strongest wave 3
Targets - generally the targets of wave 3 goes up to 1.618 levels with TREND FIB from wave 1 to wave 2
* In this stock, the targets as per wave theory is around 425.70
* Intermediate targets as per technical view are 247-290-375-425.70
Invalidation / stoploss - invalidation of the up-move is 80
Trade Plan-
* one can add at current levels and again if it comes down you will get an opportunity to add more till 150-140
* Invest keeping in mind for short to long term view, not for speculation.
THANK YOU
KARANN DINGRA

EPL Ltd Breakout Alert: 52-Week High + Bullish Momentum! Ready f📈 EPL Ltd (EPL) is showing explosive bullish momentum and has recently achieved a 52-week breakout, positioning it for potential short-term gains. Here’s why EPL should be on your radar:
🔑 Key Technical Highlights:
Bullish Marubozu Candle: Strong buyer dominance, signaling a solid uptrend.
RSI Breakout (63): Momentum is building; watch for continued upward pressure.
Volume Breakout: Price surge supported by heavy volume—confirming buyer interest.
Donchian Bands: New highs suggest further breakout potential ahead.
Bollinger Bands: Positive breakout confirms the strength of the current trend.
Stochastic (94) & CCI (195): Strong overbought levels indicate market strength.
MACD Bullish Crossover: A confirmed bullish signal, pointing to sustained upward movement.
200 EMA: Price above the EMA, and both price and moving averages are trending up, showing a strong uptrend.
Bullish Candlestick Patterns:
🔥 Long White Candles across the Daily, Weekly, and Monthly timeframes indicate consistent bullish pressure and potential for further upward movement.
Why This Could Be a Great Trade:
Possible Swing Trade: Targeting short-term profits with strong bullish indicators.
Possible BTST (Buy Today, Sell Tomorrow): Perfect setup for quick gains.
📢 Don’t miss out on this breakout opportunity – EPL is trending upward, and the momentum is strong! 💥
🚀 Are you ready to take action?
💬 Share your thoughts, predictions, or trade setups in the comments below!
🔔 Follow for daily stock analysis and stay ahead of the market.
Possible levels to watch out : 324-360-396-432

ALB & GPN's Reversal Breakout Could Spark Significant GainsAlbemarle Corporation NYSE:ALB
● On the monthly chart, the stock is bouncing back from a long-standing trendline support that has held firm over the years.
● The daily chart reveals the emergence of an Inverted Head & Shoulders pattern following a significant decline.
● With a recent breakout, the stock appears poised for a potential trend reversal.
● Traders should keep a close eye on this stock for potential buying opportunities.
Global Payments NYSE:GPN
● The stock has formed a Double Bottom pattern after a brief period of consolidation.
● Recently, the price broke out from this formation and has been maintaining its position above the breakout point.
● The price movement suggests a short-term buying opportunity, as the resistance level is quite distant from the current price.
