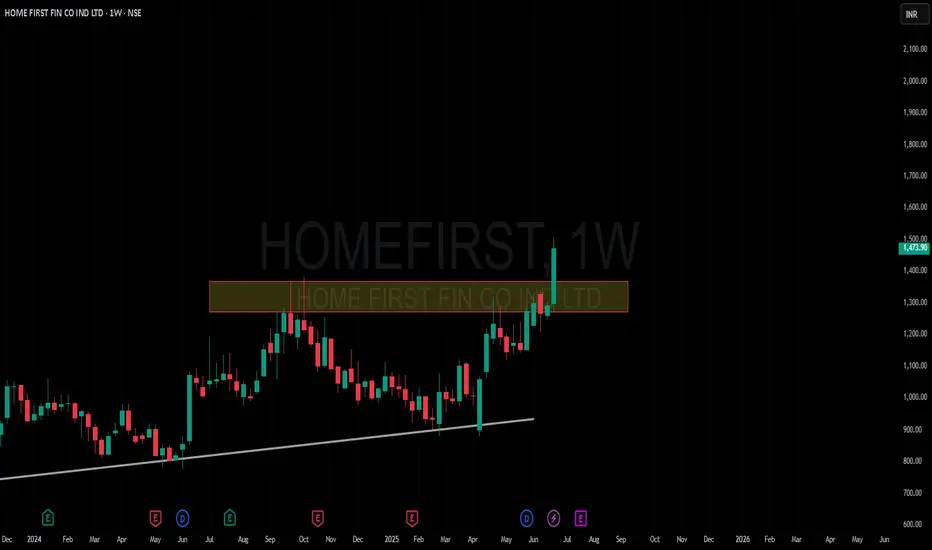
Amazing breakout on WEEKLY Timeframe - HOMEFIRSTCheckout an amazing breakout happened in the stock in Weekly timeframe, macroscopically seen in Daily timeframe. Having a great favor that the stock might be bullish expecting a staggering returns of minimum 25% TGT. IMPORTANT BREAKOUT LEVELS ARE ALWAYS RESPECTED!
NOTE for learners: Place the breakout levels as per the chart shared and track it yourself to get amazed!!
#No complicated chart patterns
#No big big indicators
#No Excel sheet or number magics
TRADE IDEA: WAIT FOR THE STOCK TO BREAKOUT IN WEEKLY TIMEFRAME ABOVE THIS LEVEL.
Checkout an amazing breakout happened in the stock in Weekly timeframe.
Breakouts happening in longer timeframe is way more powerful than the breakouts seen in Daily timeframe. You can blindly invest once the weekly candle closes above the breakout line and stay invested forever. Also these stocks breakouts are lifelong predictions, it means technically these breakouts happen giving more returns in the longer runs. Hence, even when the scrip makes a loss of 10% / 20% / 30% / 50%, the stock will regain and turn around. Once they again enter the same breakout level, they will flyyyyyyyyyyyy like a ROCKET if held in the portfolio in the longer run.
Time makes money, GREEDY & EGO will not make money.
Also, magically these breakouts tend to prove that the companies turn around and fundamentally becoming strong. Also the magic happens when more diversification is done in various sectors under various scripts with equal money invested in each N500 scripts.
The real deal is when to purchase and where to purchase the stock. That is where Breakout study comes into play.
Check this stock which has made an all time low and high chances that it makes a "V" shaped recovery.
> Taking support at last years support or breakout level
> High chances that it reverses from this point.
> Volume dried up badly in last few months / days.
> Very high suspicion based analysis and not based on chart patterns / candle patterns deeply.
> VALUABLE STOCK AVAILABLE AT A DISCOUNTED PRICE
> OPPURTUNITY TO ACCUMULATE ADEQUATE QUANTITY
> MARKET AFTER A CORRECTION / PANIC FALL TO MAKE GOOD INVESTMENT
DISCLAIMER : This is just for educational purpose. This type of analysis is equivalent to catching a falling knife. If you are a warrior, you throw all the knives back else you will be sorrow if it hits SL. Make sure to do your analysis well. This type of analysis only suits high risks investor and whose is willing to throw all the knives above irrespective of any sectoral rotation. BE VERY CAUTIOUS AS IT IS EXTREME BOTTOM FISHING.
HOWEVER, THIS IS HOW MULTIBAGGERS ARE CAUGHT !
STOCK IS AT RIGHT PE / RIGHT EVALUATION / MORE ROAD TO GROW / CORRECTED IV / EXCELLENT BOOKS / USING MARKET CRASH AS AN OPPURTUNITY / EPS AT SKY.
LET'S PUMP IN SOME MONEY AND REVOLUTIONIZE THE NATION'S ECONOMY!
Breakouttrade
AAPL breakout coming soonWhich way will it squeeze? I share my thoughts if AAPL can hold above 200.
*technically showing caution signs (bearish, but can flip)
*news is affecting the market greatly (esp AAPL re: tarriffs)
*RSI & MACD need a positive signal
*204, 205, 208 immediate targets to be focused on imo
Have a great weekend!

Amazing breakout on WEEKLY Timeframe - FORTISCheckout an amazing breakout happened in the stock in Weekly timeframe, macroscopically seen in Daily timeframe. Having a great favor that the stock might be bullish expecting a staggering returns of minimum 25% TGT. IMPORTANT BREAKOUT LEVELS ARE ALWAYS RESPECTED!
NOTE for learners: Place the breakout levels as per the chart shared and track it yourself to get amazed!!
#No complicated chart patterns
#No big big indicators
#No Excel sheet or number magics
TRADE IDEA: WAIT FOR THE STOCK TO BREAKOUT IN WEEKLY TIMEFRAME ABOVE THIS LEVEL.
Checkout an amazing breakout happened in the stock in Weekly timeframe.
Breakouts happening in longer timeframe is way more powerful than the breakouts seen in Daily timeframe. You can blindly invest once the weekly candle closes above the breakout line and stay invested forever. Also these stocks breakouts are lifelong predictions, it means technically these breakouts happen giving more returns in the longer runs. Hence, even when the scrip makes a loss of 10% / 20% / 30% / 50%, the stock will regain and turn around. Once they again enter the same breakout level, they will flyyyyyyyyyyyy like a ROCKET if held in the portfolio in the longer run.
Time makes money, GREEDY & EGO will not make money.
Also, magically these breakouts tend to prove that the companies turn around and fundamentally becoming strong. Also the magic happens when more diversification is done in various sectors under various scripts with equal money invested in each N500 scripts.
The real deal is when to purchase and where to purchase the stock. That is where Breakout study comes into play.
Check this stock which has made an all time low and high chances that it makes a "V" shaped recovery.
> Taking support at last years support or breakout level
> High chances that it reverses from this point.
> Volume dried up badly in last few months / days.
> Very high suspicion based analysis and not based on chart patterns / candle patterns deeply.
> VALUABLE STOCK AVAILABLE AT A DISCOUNTED PRICE
> OPPURTUNITY TO ACCUMULATE ADEQUATE QUANTITY
> MARKET AFTER A CORRECTION / PANIC FALL TO MAKE GOOD INVESTMENT
DISCLAIMER : This is just for educational purpose. This type of analysis is equivalent to catching a falling knife. If you are a warrior, you throw all the knives back else you will be sorrow if it hits SL. Make sure to do your analysis well. This type of analysis only suits high risks investor and whose is willing to throw all the knives above irrespective of any sectoral rotation. BE VERY CAUTIOUS AS IT IS EXTREME BOTTOM FISHING.
HOWEVER, THIS IS HOW MULTIBAGGERS ARE CAUGHT !
STOCK IS AT RIGHT PE / RIGHT EVALUATION / MORE ROAD TO GROW / CORRECTED IV / EXCELLENT BOOKS / USING MARKET CRASH AS AN OPPURTUNITY / EPS AT SKY.
LET'S PUMP IN SOME MONEY AND REVOLUTIONIZE THE NATION'S ECONOMY!

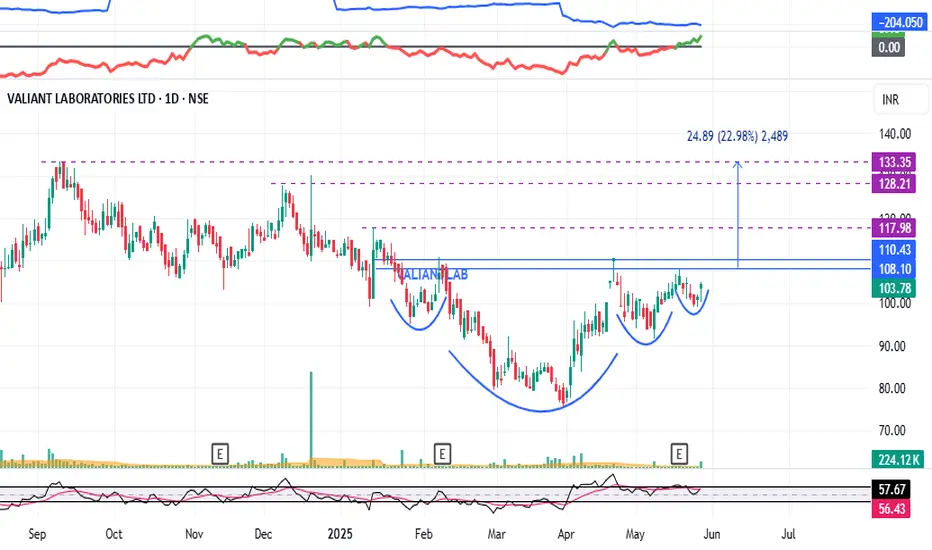
VALIANTLAB : Breakout Candidate (Swing Pick)#VALIANTLAB #swingtrading #breakoutstock #momentumstock
VALIANT LAB : Swing Trade
>> Cup & Handle Formation Visible
>> VCP Structure also Visible
>> Good Strength in stock
>> Volume Contraction seen, Expansion imminent
>> Potential Upside 23%
Swing Traders can lock 10% profit and keep trailing.
Disc : Stock chart shared for Learning Purpose and not a Trade recommendation.
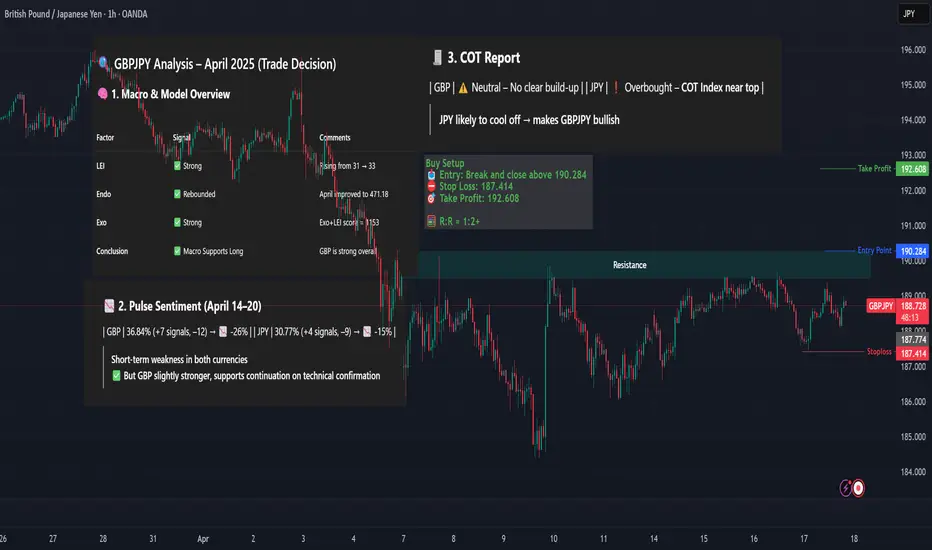
GBPJPY – Breakout Buy Setup (Macro Alignment)GBPJPY long setup backed by rising LEI, strong macro trend, JPY weakness, and bullish seasonal window approaching after April 24.
Waiting for breakout confirmation above resistance to validate entry.
🧠 Macro + Model Alignment
LEI score rising → 33 (April), macro outlook improving
Exo+LEI = 1153 → strong bullish signal
JPY COT: Overbought → reversal risk
GBP fundamentals outperform JPY across April
Seasonality: GBP bearish till April 24, then bullish into month-end
📌 Best entry window = April 25+
📊 Technical Setup – 1H Chart
Price testing key resistance zone ~190.00
Watching for breakout & candle close above resistance for confirmation
Clear R:R with defined structure zones
📥 Entry: Break and close above 190.284
⛔ Stop Loss: 187.414
🎯 Take Profit: 192.608
🧮 R:R ≈ 1:2+
Confirmation required before entry ✅
GBPJPY 4h Long Setup Clear bullish structure with clean higher highs and higher lows intact
Price formed a bull flag after a strong impulse leg showing continuation potential
Breakout of the flag confirms momentum with aggressive bullish candle and volume
Entry : 192.459
SL : 188.167
TP : Trail 195.898
RR 1 : 3.1
Market is flowing with bullish pressure and breakout indicates wave extension
No counter structure in sight, trend continuation expected
Let the market breathe and move

Breakout re-tested.Breakout re-tested.
Morning Star formation.
The only concerning thing is Bearish
Divergence appearing on Weekly TF.
Crossing & Sustaining 140 may lead it
towards 160.
However, breaking 120 may bring further
selling pressure.

BANARISUG Weekly | Bullish Breakout from Retracement | Short-Ter📈 Swing Trade Recommendation (Short-Term):
Buy Zone: ₹4,000–₹4,030 (on dips or closing above ₹4,100)
Target 1: ₹4,400 (Fibo 0.786 level)
Target 2: ₹4,750–₹4,800 (swing high near 1.0 Fibo)
Stoploss: ₹3,825 (below 0.5 Fibo support zone)
🔍 Technical Highlights:
Volume surge confirms strong buying interest (see blue arrow).
RSI breakout suggests new momentum leg forming.
0.618 Fib level reclaimed after long consolidation → bullish bias.
for educational purposes only

EMCURE PHARMA | Approaching Key Resistance | Breakout or Triple ⚙️ Technical Setup Highlights:
Price is testing a resistance zone around ₹1100, which has been rejected twice before (as indicated by black arrows).
Volume has picked up on the recent move up — indicating buying interest.
RSI is turning up from near the 50 level, signaling positive momentum.
📈 Trade Plan:
🔹 If Price Breaks Above ₹1110-1120 with Volume:
Buy above ₹1120 (wait for a breakout candle with volume)
Target 1: ₹1180
Target 2: ₹1240
Stoploss: ₹1070 (just below the breakout level)
🔻 If Price Rejected at ₹1100-1120 Zone Again:
Sell near ₹1100-1110 (on bearish reversal candle confirmation)
Target: ₹1020
Stoploss: ₹1130
🎯 Ideal Strategy:
Wait for confirmation — either a clean breakout above ₹1120 or a rejection signal at resistance. Avoid trading within the zone.
for educational purposes only

#AI16ZUSDT remains in a bearish momentum
📉 SHORT BYBIT:AI16ZUSDT.P from $0.1544
⚡️ Stop loss $0.1582
🕒 Timeframe: 1H
✅ Overview BYBIT:AI16ZUSDT.P
➡️ Price continues in a downtrend, breaking key support levels.
➡️ POC: $0.1615 marks a high-volume area where price was rejected, indicating strong selling pressure.
➡️ Resistance at $0.1582 — expect rejection on retest.
➡️ Entry zone: $0.1544, but wait for confirmation before entering!
➡️ Targeting TP1: $0.1510 and TP2: $0.1485 on further downside movement.
📍 Important Note: Watch for confirmation levels before entering! Do not enter too early.
🎯 Take Profit Targets:
💎 TP 1: $0.1510
💎 TP 2: $0.1485
⚡️ Plan:
➡️ Wait for confirmation before entering at $0.1544.
➡️ Stop loss $0.1582 — above resistance.
➡️ Take profits at $0.1510 and $0.1485.
🚀 BYBIT:AI16ZUSDT.P remains in a bearish momentum — follow the plan after confirmation!

XAUUSD – Bullish Breakout from Triangle | 3,090+ in SightGold (XAUUSD) has broken out of a symmetrical triangle consolidation on the 1H chart, signaling bullish continuation. With solid technical structure and momentum building, the path toward 3,093+ remains firmly in play.
📊 Technical Breakdown
1. Symmetrical Triangle Formation
Price coiled within a classic symmetrical triangle, forming higher lows and lower highs—typically a continuation pattern in trending markets.
A breakout has now occurred to the upside, confirming bullish bias.
2. Breakout Projection
The measured move from the triangle projects a 2.62% upside, targeting the 3,093 zone.
3. Clean Market Structure
Bullish impulse followed by healthy consolidation reflects market strength.
Expectation: Price will print higher highs and higher lows on its way to upper targets.
🎯 Bullish Targets
TP1: 3,047.652
TP2: 3,058.038
TP3: 3,093.957
These levels are based on recent structure highs and the measured move from the breakout.
📌 Trade Plan
Entry Idea: On triangle breakout retest or momentum continuation above 3,025
Stop Loss: Below triangle support (~3,000)
Risk-to-Reward: Favorable on breakout continuation setups
🔎 Confluences
✅ Symmetrical Triangle Breakout
✅ Strong Bullish Trend
✅ Measured Move & Clear Targets
✅ Consistent Market Structure
Gold bulls are stepping in with strength. As long as price holds above the breakout zone, expect further upside toward 3,090+.
Want a version with SL-to-BE logic or trailing TP adjustments? Just let me know!

cup and handle pattern may be forming on the weekly chart HOOD"Potential Cup and Handle Pattern on NASDAQ:HOOD
A cup and handle pattern may be forming on the weekly chart of HOOD. The cup formation can be seen from August 2024 to February 2025, with a high point of around $55.00 and a low point of around $14.00. The handle formation started in late February 2025 and is currently ongoing.
Key levels to watch:
Resistance: $50.00
Support: $39.00
A breakout above the resistance level could confirm the pattern, potentially leading to a bullish trend. Keep a close eye on this stock! Weekly Daily and Monthly all look good.
#HOOD #cupandhandle #stockmarket #trading"

$NASDAQ:AISP breaking resistance for a 35%++ upsideNASDAQ:AISP broke it's double bottom pattern resistance with some upside potential.
Entry Point: At the current price OR (as I suspect there will be a retest of the $6 resistance) somewhere around $6
Price Target: $8.14 - 35% from the $6 resistance.

#ARCUSDT - Monitor this asset closely📈 LONG BYBIT:ARCUSDT.P from $0.25588
🛡 Stop Loss: $0.24176
⏱️ 1H Timeframe
✅ Overview:
➡️ BYBIT:ARCUSDT.P has broken out of a Falling Wedge pattern and is following an upward trend.
➡️ The POC (Point of Control) at $0.24041 confirms liquidity in this zone, potentially acting as strong support.
➡️ The key resistance is at $0.25588; if the price holds above this level, it may lead to further gains.
➡️ Increased volume signals strong buyer activity and a high probability of continuation.
⚡️ Plan:
➡️ Important: Set an order in advance to ensure execution when the price reaches the entry level!
➡️ Enter long above $0.25588.
➡️ Stop-Loss placed at $0.24176 for risk management.
🎯 TP Targets:
💎 TP1: $0.26618
🔥 TP2: $0.27640
⚡️ TP3: $0.28670
🚀 BYBIT:ARCUSDT.P - Monitor this asset closely!
🚀 Place your order in the listing so that it executes automatically when the breakout occurs.

$NASDAQ:RGTI Pennant Pattern with 72% upsideNASDAQ:RGTI I'm revising an earlier post to clarify that this is actually a Pennant pattern that has formed for RGTI.
Entry Point:
Conservative - wait until the stock closes above $13.98, which should indicate a breakout.
Riskier - Anything above $12.03
Price Target:
The upside is 72% - $24.00

$NASDAQ:RGTI 57% Upside: Consolidation Breakout WatchNASDAQ:RGTI has been in a consolidation pattern for the past ~11 trading days. Creating a nice volume shelf of support. It continues to bump up to the line of resistance, but hasn't broken through.
Here's the trade:
Conditions:
The stock price closes above the line of resistance ($13.98)
Volume is relatively higher than recent bars (a spike)
Squeeze is firing indicating a positive release (light blue bars)
MACD has signaled a buy
Williams %R continues to ascend, preferably into the upper 20%
Entry: Anything above the 13.98 close.
Price Target:
$22.00 - 57% above the resistance line.
Note: There may be some resistance and pullback when trying to cross $17 and $20
Caution!
Quantum computing stocks have been volatile, so pay attention!

Breakout in play.Approx. 4 year parallel channel
Breakout last September
Retesting until late Dec 2024
Now breaking out and confirmed by volume buying throughout January 2025
Will it head up to 10?
NOTE: This is not advice or a solicitation to make any trading decision.

$NYSE:OKLO breaking a Wedge/Flag with short term 25%-60% upsideNYSE:OKLO is breaking out of a consolidation pattern (falling wedge) And what appears to be a flag pattern.
Confirmation is a 24% uptick in price along with strong volume.
Initial Price Target is ~$34.50 to complete the falling wedge pattern, which is a short term 25% upside.
Secondary Price Target is ~$42.90 to complete the flag pattern, which is a longer term 60% upside
Good Luck!

LINK on the Verge Bullish Breakout Sparks Momentum !Pattern
The chart shows a descending wedge pattern. This is generally a bullish pattern, indicating potential price reversal or breakout to the upside.
Breakout
The price has broken above the upper trendline of the wedge. This breakout is a positive signal, suggesting that bullish momentum is building.
Volume Confirmation
Check if there’s an increase in volume during the breakout. A breakout with strong volume provides confirmation.
Retest
After a breakout, it's common for the price to retest the previous resistance (now turned support). Waiting for this retest can provide a safer entry point with reduced risk.
Targets
First target: The recent swing high near $24.50.
Second target: $28.50, where there’s visible resistance.
Risk Management
Place a stop-loss below the breakout level or the lower trendline of the wedge in case the breakout fails.

AGLD/USDT, Ascending Channel with 2:6 Risk-Reward SetupThis chart displays an Ascending Channel Pattern where the price is trending upward within parallel support and resistance lines. The long position designed here follows a 2:6 risk-reward ratio , indicating a calculated trade setup with a potential 50% profit at the target price of $3.717 and a controlled 18% loss at the stop-loss of $2.016 .
The ascending channel suggests bullish momentum, and the strategy aligns with a breakout continuation toward the upper resistance level. However, if the price fails to sustain above the lower trendline, the trade could hit the stop-loss. This setup offers a favorable risk-reward profile for traders looking to capitalize on the channel's upward trajectory.

DRIO TTM_Squeeze -7.6 and Heading upMACD, RSI, MFI all lower healthy ranges and pointing up. Price has seen 3 days of higher high's / higher low's. Coming off of consolidating around Fib 0 / 0.631c and all time lows. The quick!! review I've done so far seems to be positive news, history of insider buying and looking good for a short squeeze. If it moves up in the morning I'll enter and base position size on volume. Ideally I'd like to establish a base position at current levels then add if its up over 10-20% on high volume.

BBAI - Trying to fully BreakoutPrice has moved above Fib 1 at 4.80. If it can close above that today will be watching post and pre market. This is currently one of my larger trades using shares, calls, puts and LEAPS. If it breaks a big win. If not still a win but not the high 3-4 figure % return targeted. Good luck if playing.

Master High-Probability Breakouts with the GOLDEN Trading SystemWelcome to the GOLDEN Trading System (GTS) – a custom-designed strategy tailored for traders seeking high-probability breakout opportunities. Built on the foundation of TradingView's powerful indicators, GTS focuses on leveraging Camarilla Pivot Levels (H3-H4 and L3-L4) to spot and act on potential market trends. Whether you're a beginner or an experienced trader, this system simplifies the complexity of technical analysis, giving you an edge in the markets.
Core Elements of the Strategy.
1. Key Levels to Watch:
Green Band (H3-H4):
Represents a resistance zone where bullish breakouts are likely to occur. A confirmed breakout above H4 often leads to a strong upward trend.
Red Band (L3-L4):
Acts as a support zone, signaling potential bearish moves when broken. A confirmed breakdown below L4 generally triggers a downward trend.
2. The Breakout Concept:
When the price crosses either of these bands, it indicates a potential shift in market dynamics:
Bullish Breakout: Price breaks above the Green Band, suggesting buyers have gained control.
Bearish Breakout: Price breaks below the Red Band, signaling sellers have the upper hand.
Why This Strategy Works?
High Probability: Camarilla Pivot Levels are widely respected by traders, making breakouts from these zones more reliable.
Trend Confirmation: The system minimizes false signals by focusing on specific breakout levels instead of broader zones.
Clear Entry/Exit Points: You can easily determine when to enter a trade and set stop-loss or take-profit levels.
How to Use the GOLDEN Trading System?
Identify the Bands: Look for the Green Band (H3-H4) and Red Band (L3-L4) on your chart.
Watch for Breakouts:
Enter a long position when the price closes decisively above the Green Band (H4).
Enter a short position when the price closes decisively below the Red Band (L4).
Manage Your Risk:
Use the opposite band (L3 or H3) as a stop-loss level to protect your trade.
Consider trailing your stop-loss as the trend progresses.
Add Confirmation: For greater accuracy, combine this strategy with other tools such as volume spikes, candlestick patterns, or higher timeframe trend analysis.
Case Study Example:
Take a closer look at the chart provided:
The price broke below the Red Band (L3-L4), confirming a bearish breakout.
Post-breakout, the price continued its downtrend, offering a high-reward opportunity for short-sellers.
By adhering to the system's clear breakout rules, you could have entered the trade early and capitalized on the trend with confidence.
Benefits of the GOLDEN Trading System:
Simplicity: Focuses on straightforward rules, making it beginner-friendly.
Consistency: Reduces emotional trading by adhering to defined breakout zones.
Scalability: Works across multiple timeframes and markets, including indices, stocks, and commodities.
Pro Tip for Advanced Traders:
Combine GTS with volume analysis, RSI divergence, or moving averages to add layers of confirmation to your trades. This helps filter out false breakouts and improves your win rate.
Join the GTS movement and elevate your trading game today! Share your feedback, results, and tweaks to make the strategy even better. Happy trading! 🚀
