EURUSD — Strong Supply Rejection After Buyer-Zone Breakout EURUSD completed a full Wyckoff-style distribution, starting with UTA and DTA phases, followed by range formation and a clear rounded top near the strong supply zone. The breakout above the buyer zone was a false move, trapping late buyers and confirming smart money selling pressure.
Price was aggressively rejected from supply and is now trading back below the buyer zone, indicating bearish control. If the marked support is broken, continuation toward the first target is likely, with extended downside potential into the major demand zone area.
Overall structure favors shorts while price remains below the supply zone, with targets aligned toward lower liquidity and demand.
Breakouttrading

Another wedge?Price is landing on a string demand area and at the same time is forming a falling wedge. Looks very expulsive like the shown on the chart. Risk-reward is good. I opened a long position, SL triggers if a daily candles closes below the demand zone.

How will gold prices fluctuate before major news is released? 1️⃣ Trend & Trendline
Price is moving within a medium-term ascending channel (two black trendlines).
After a strong breakout, price is pulling back toward the upper trendline of the channel → this is a key decision zone for the short-term trend.
The overall structure remains Higher High – Higher Low, indicating that the main trend is still intact.
2️⃣ Key Support
4,257: Confluence support zone (trendline + previous price structure).
→ Holding above this level: favor a recovery in line with the bullish trend.
→ Losing this level: price may slide toward the lower boundary of the ascending channel.
3️⃣ Resistance / Targets
4,352: Near-term resistance – previous high; a clear breakout is needed to confirm continuation.
4,379: Higher resistance at the previous ATH – next target if 4,352 is broken successfully.
4️⃣ Main Scenarios
Bullish scenario: Hold above 4,257 → rebound toward 4,352 → extend to 4,379.
Short-term bearish scenario: Break below 4,257 → deeper correction toward the lower trendline of the ascending channel before new buying interest appears.
Trading Plan
BUY GOLD: 4,257 – 4,255
Stop Loss: 4,245
Take Profit: 100 – 300 – 500 pips
SELL GOLD: 4,379 – 4,381
Stop Loss: 4,391
Take Profit: 100 – 300 – 500 pips

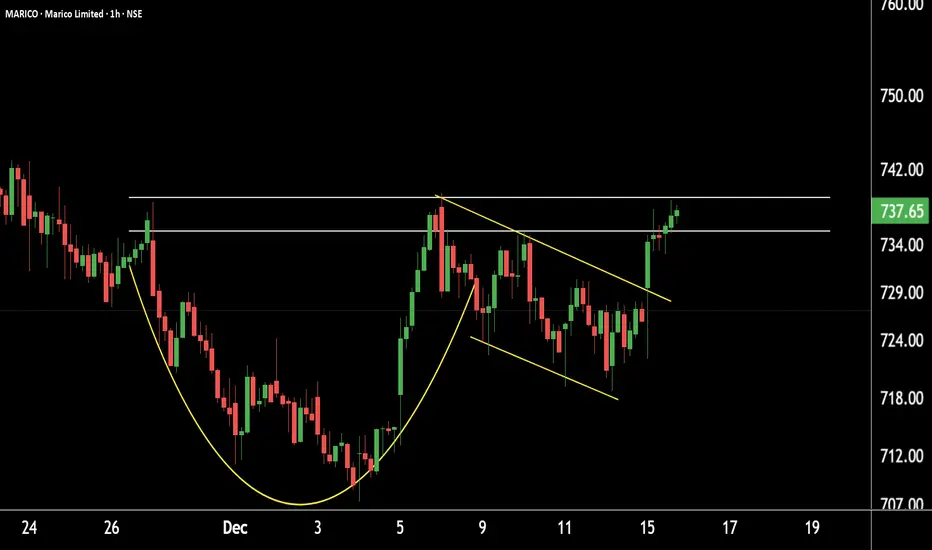
MARICO Technical Setup | Cup & Handle Pattern Developing .MARICO – Technical View (1-Hour Timeframe)
MARICO is forming a Cup & Handle pattern on the 1-hour chart and is currently trading near the key resistance zone of 740–745.
The stock has a strong support base around 700–710, indicating underlying strength.
Upside Scenario:
A decisive breakout and sustained move above 740 could open the door for an upside target near 770.
Confirmation and sustainability above resistance will be crucial for further momentum.
EUR/USD Weekly: Structural Shift; Long-Term Bearish TrendSummary:
OANDA:EURUSD EUR/USD has transitioned from a bullish to a bearish structure on the weekly timeframe, indicating a potential long-term reversal. Over the past 168 days, price action confirmed a market structure shift after breaking the swing low established during the week of June 30, 2025. This breach marked the beginning of a bearish phase.
Key Technical Observations:
Bearish Pin Bar Confirmation:
During the week of September 15, 2025, a textbook bearish pin bar formed, invalidating prior buying orders and reinforcing bearish sentiment.
Resistance Zone & Accumulation Phases:
Strong resistance persists between 1.17774 – 1.18299, acting as the primary accumulation zone following the initial phase from July 28 to September 29, 2025. Current price action suggests we are in Phase Two of the buying climax, targeting this resistance before a potential rollover.
Lower Highs & Lower Lows:
The market continues to print lower highs and lower lows. The bearish mother bar from July 28, 2025 remains dominant, with multiple inside bars failing to break its high—evidence of sustained bearish pressure.
Liquidity & Institutional Activity:
The 1.1299 level is a critical liquidity pool and may see a third test. Volume Price Analysis indicates repeated invalid buying attempts on up legs, likely driven by institutional positioning to absorb retail buy-side liquidity. Recent upticks appear to be profit-taking and repositioning rather than genuine bullish momentum.
Outlook:
Expect EUR/USD to remain under bearish pressure, with a potential rollover during the first 5–7 months of 2026. Unless the key resistance zone is decisively breached, the structural bias favors sellers.
Charting
Primary Trend: Bearish
Key Resistance: 1.17774 – 1.18299
Critical Support / Liquidity Zone: 1.13900

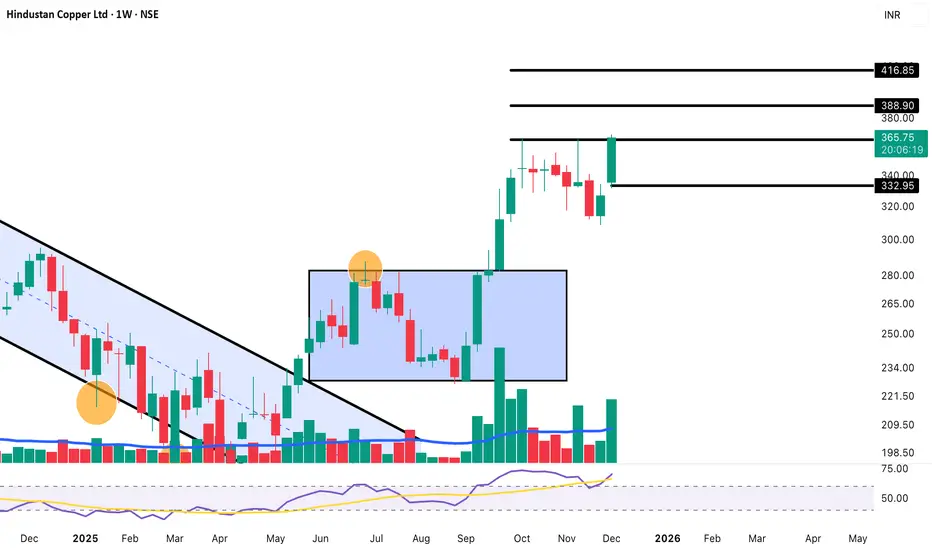
Hindustan Copper – Weekly Chart Analysis Professional Breakdown✔️ Buy Range
₹360 - ₹365
Or first green candle after pullback
🛑 Stop Loss
₹330 (Weekly SL)
🎯 Targets
T1 ₹388
T2 ₹402
T3 ₹416–₹420
T4 ₹450+ breakout possible
Disclaimer: For educational purposes only. Not SEBI registered.
EURUSD — Bullish Breakout Failure at Strong Supply Zone EURUSD showed a bullish entry attempt after breaking above the buyer zone, confirming short-term strength and a valid breakout structure. However, price failed to sustain above the level and faced strong rejection from the higher supply zone, indicating active sellers and distribution at premium prices.
Following the failed breakout, the market shifted into a corrective phase (DTA), signaling weakening bullish momentum. As long as price remains below the supply zone, bearish continuation is favored, with downside targets aligned at the seller zone and major support levels. A deeper move could extend toward the demand zone if support fails.


BTC – Retracement Likely Before Bullish Expansion | Watching 89kBitcoin remains in a strong macro uptrend, but short-term price action is showing signs of exhaustion near the 93k zone. Price rejected this level twice, forming a short-term double top and showing a loss of momentum on the lower timeframes.
On the 45m chart, BTC is slowly breaking below local support, while the 2h shows price sitting high inside a larger ascending channel. A healthy retracement looks increasingly likely before the next impulsive move.
I’m watching the 89,00 –90,000 zone closely, which lines up with:
Mid-range equilibrium
Previous consolidation
Untapped liquidity below
Local FVG imbalance
Trendline support
A sweep into this zone would create a perfect setup for buyers to step back in and continue the higher-timeframe trend.
Macro Context
December typically brings volatility in crypto. With anticipation around December rate decisions, liquidity thinning, and strong bullish positioning in BTC derivatives, a short-term correction would actually benefit the long-term trend.
As long as Bitcoin stays above 85k, the structure remains bullish and any dips are likely to be corrective.
📈 Technical Levels I'm Watching
Major Resistance:
93,200 – 93,800 (strong rejection zone)
96,000 (next major magnet if broken)
Key Support:
90,000
88,500
87,200–87,000 (main demand zone)
85,800 (larger timeframe invalidation)
Bullish Scenario:
A flush into 89k → liquidity grab → reaction → bullish continuation toward 95–96k.
Bearish Scenario (less likely unless macro shocks):
Break and close below 85,800 → deeper correction toward 83k region.
📌 My Trade Planning Outlook
Bias: Bullish on pullback
Looking for continuation long entries around 89,000–90,000, if confirmed with reaction.
Short-term targets:
• 91,500
• 93,000–93,800
Medium-term targets:
• 95,600
• 97,000
As long as BTC maintains the higher timeframe channel structure, I’ll treat dips as opportunities rather than reversals.
Trade Safe,
– JackOfAllTrades

GBPUSD Breakout in Play – Key Levels Before the Next MoveGBPUSD is currently reacting inside a well-defined intraday structure after a sharp downside move. Price has rebounded from the intraday support zone, showing early bullish attempts—but the pair is still trading below a major resistance block, keeping the market in a bearish bias unless broken.
🔍 Key Technical Highlights
Strong Resistance Zone: Price rejected this area multiple times, confirming sellers are active.
Breakout Area: A clean breakdown earlier shifted the trend bearish, and the market is retesting this region.
Strong Support (Retest Zone): This area is acting as a temporary barrier, but no strong bullish breakout yet.
Intraday Support: Price is currently holding above this zone; a break below it can accelerate bearish momentum.
Breakout Target: 1.3272 remains the primary target if bears take control again.
🎯 Bias & Expectation
As long as price stays below strong resistance, GBPUSD favors a sell-on-rally scenario.
A close below intraday support can open doors for a deeper drop toward 1.3272.
However, a strong bullish breakout above resistance may shift short-term momentum in favor of buyers.

Gold is still compressed and waiting for a breakout1️⃣ Trendline
Main ascending trendline (lower): Still holding firmly → the medium-term bullish structure remains intact. Every pullback continues to react positively at this trendline.
Short-term ascending trendline (upper – mild slope): Price is moving very close to this line → showing signs of consolidation / price compression before the next directional move.
2️⃣ Resistance
4,240 – 4,245 (blue zone): Strong resistance. Price has tested this area multiple times without a clear breakout → selling pressure is still present.
4,380: Distant resistance / extended target if price successfully breaks above the resistance zone.
3️⃣ Support
4,210 – 4,215 (Fibo 0.618): Key short-term support, aligned with the short-term uptrend → a decisive zone for near-term direction.
4,135 – 4,130 (Fibo 0.5 + main ascending trendline): Strong structural support. A breakdown below this area would significantly weaken the bullish trend.
4️⃣ Primary scenarios
Holding above 4,210 – 4,215: Continued consolidation → wait for a breakout above 4,270 to confirm bullish continuation.
Break below 4,165: Price may pull back toward 4,135 – 4,140 to test demand.
👉 Overall trend: Bullish, but currently at a sensitive zone. A resistance breakout is needed to confirm continuation.
📈 Trading Plan
BUY GOLD: 4,130 – 4,132
Stop Loss: 4,122
Take Profit: 100 – 300 – 500 pips
SELL GOLD: 4,213 – 4,215
Stop Loss: 4,223
Take Profit: 100 – 300 – 500 pips

Gold is trending sideways ahead of major news.1️⃣ Trendline
Short-term rising trendline (black dotted):
Price is still moving above the trendline → the uptrend remains valid. Every pullback continues to find support.
Long-term rising trendline (below):
This is the major structural support, crucial for determining the medium-term trend if it gets broken.
2️⃣ Resistance
4,260 – 4,265:
A strong resistance zone where price has been rejected multiple times → strong selling pressure.
➜ Break and close above this zone: opens a new upside expansion.
➜ Failure to break out: likely leads to a corrective move.
3️⃣ Support
4,165 – 4,170:
Short-term support, a confluence of the rising trendline and a previous demand zone.
Below 4,165:
Price may slide quickly toward a lower rising trendline → higher risk of a deeper correction.
4️⃣ Main scenarios
Primary scenario: Sideways consolidation below resistance → pullback toward 4,165, then watch for price reaction.
Strong bullish scenario: Only valid if price decisively breaks above 4,265 with volume confirmation.
👉 Strategy: Avoid FOMO at resistance. Focus on price reaction at support or clear, confirmed breakouts.
Trading Plan
BUY GOLD: 4,169 – 4,067
Stop Loss: 4,159
Take Profit: 100 – 300 – 500 pips
SELL GOLD: 4,263 – 4,265
Stop Loss: 4,275
Take Profit: 100 – 300 – 500 pips

Amazing breakout on WEEKLY Timeframe - AIAENGCheckout an amazing breakout happened in the stock in Weekly timeframe, macroscopically seen in Daily timeframe. Having a great favor that the stock might be bullish expecting a staggering returns of minimum 25% TGT. IMPORTANT BREAKOUT LEVELS ARE ALWAYS RESPECTED!
NOTE for learners: Place the breakout levels as per the chart shared and track it yourself to get amazed!!
#No complicated chart patterns
#No big big indicators
#No Excel sheet or number magics
TRADE IDEA: WAIT FOR THE STOCK TO BREAKOUT IN WEEKLY TIMEFRAME ABOVE THIS LEVEL.
Checkout an amazing breakout happened in the stock in Weekly timeframe.
Breakouts happening in longer timeframe is way more powerful than the breakouts seen in Daily timeframe. You can blindly invest once the weekly candle closes above the breakout line and stay invested forever. Also these stocks breakouts are lifelong predictions, it means technically these breakouts happen giving more returns in the longer runs. Hence, even when the scrip makes a loss of 10% / 20% / 30% / 50%, the stock will regain and turn around. Once they again enter the same breakout level, they will flyyyyyyyyyyyy like a ROCKET if held in the portfolio in the longer run.
Time makes money, GREEDY & EGO will not make money.
Also, magically these breakouts tend to prove that the companies turn around and fundamentally becoming strong. Also the magic happens when more diversification is done in various sectors under various scripts with equal money invested in each N500 scripts.
The real deal is when to purchase and where to purchase the stock. That is where Breakout study comes into play.
LET'S PUMP IN SOME MONEY AND REVOLUTIONIZE THE NATION'S ECONOMY!

Amazing breakout on WEEKLY Timeframe - PRICOLLTDCheckout an amazing breakout happened in the stock in Weekly timeframe, macroscopically seen in Daily timeframe. Having a great favor that the stock might be bullish expecting a staggering returns of minimum 25% TGT. IMPORTANT BREAKOUT LEVELS ARE ALWAYS RESPECTED!
NOTE for learners: Place the breakout levels as per the chart shared and track it yourself to get amazed!!
#No complicated chart patterns
#No big big indicators
#No Excel sheet or number magics
TRADE IDEA: WAIT FOR THE STOCK TO BREAKOUT IN WEEKLY TIMEFRAME ABOVE THIS LEVEL.
Checkout an amazing breakout happened in the stock in Weekly timeframe.
Breakouts happening in longer timeframe is way more powerful than the breakouts seen in Daily timeframe. You can blindly invest once the weekly candle closes above the breakout line and stay invested forever. Also these stocks breakouts are lifelong predictions, it means technically these breakouts happen giving more returns in the longer runs. Hence, even when the scrip makes a loss of 10% / 20% / 30% / 50%, the stock will regain and turn around. Once they again enter the same breakout level, they will flyyyyyyyyyyyy like a ROCKET if held in the portfolio in the longer run.
Time makes money, GREEDY & EGO will not make money.
Also, magically these breakouts tend to prove that the companies turn around and fundamentally becoming strong. Also the magic happens when more diversification is done in various sectors under various scripts with equal money invested in each N500 scripts.
The real deal is when to purchase and where to purchase the stock. That is where Breakout study comes into play.
LET'S PUMP IN SOME MONEY AND REVOLUTIONIZE THE NATION'S ECONOMY!
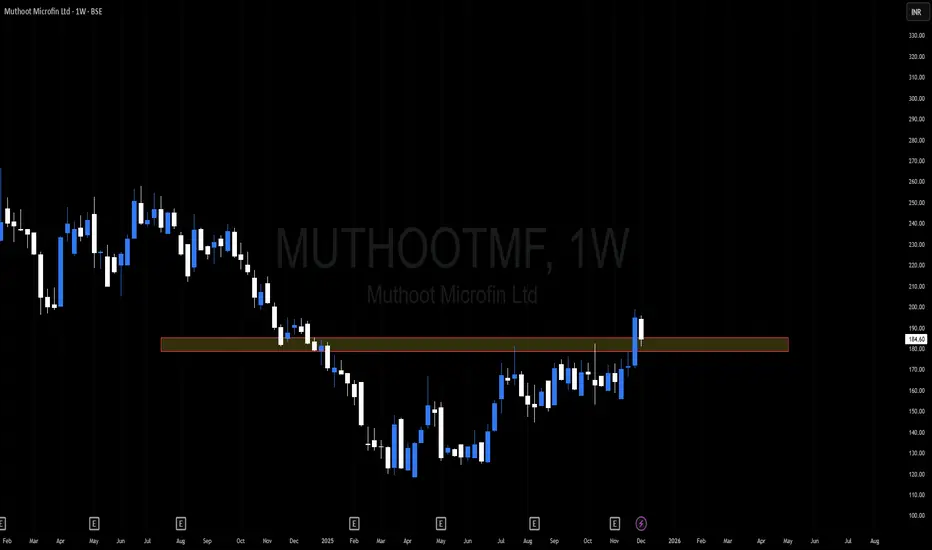
Amazing breakout on WEEKLY Timeframe - MUTHOOTMFCheckout an amazing breakout happened in the stock in Weekly timeframe, macroscopically seen in Daily timeframe. Having a great favor that the stock might be bullish expecting a staggering returns of minimum 25% TGT. IMPORTANT BREAKOUT LEVELS ARE ALWAYS RESPECTED!
NOTE for learners: Place the breakout levels as per the chart shared and track it yourself to get amazed!!
#No complicated chart patterns
#No big big indicators
#No Excel sheet or number magics
TRADE IDEA: WAIT FOR THE STOCK TO BREAKOUT IN WEEKLY TIMEFRAME ABOVE THIS LEVEL.
Checkout an amazing breakout happened in the stock in Weekly timeframe.
Breakouts happening in longer timeframe is way more powerful than the breakouts seen in Daily timeframe. You can blindly invest once the weekly candle closes above the breakout line and stay invested forever. Also these stocks breakouts are lifelong predictions, it means technically these breakouts happen giving more returns in the longer runs. Hence, even when the scrip makes a loss of 10% / 20% / 30% / 50%, the stock will regain and turn around. Once they again enter the same breakout level, they will flyyyyyyyyyyyy like a ROCKET if held in the portfolio in the longer run.
Time makes money, GREEDY & EGO will not make money.
Also, magically these breakouts tend to prove that the companies turn around and fundamentally becoming strong. Also the magic happens when more diversification is done in various sectors under various scripts with equal money invested in each N500 scripts.
The real deal is when to purchase and where to purchase the stock. That is where Breakout study comes into play.
LET'S PUMP IN SOME MONEY AND REVOLUTIONIZE THE NATION'S ECONOMY!
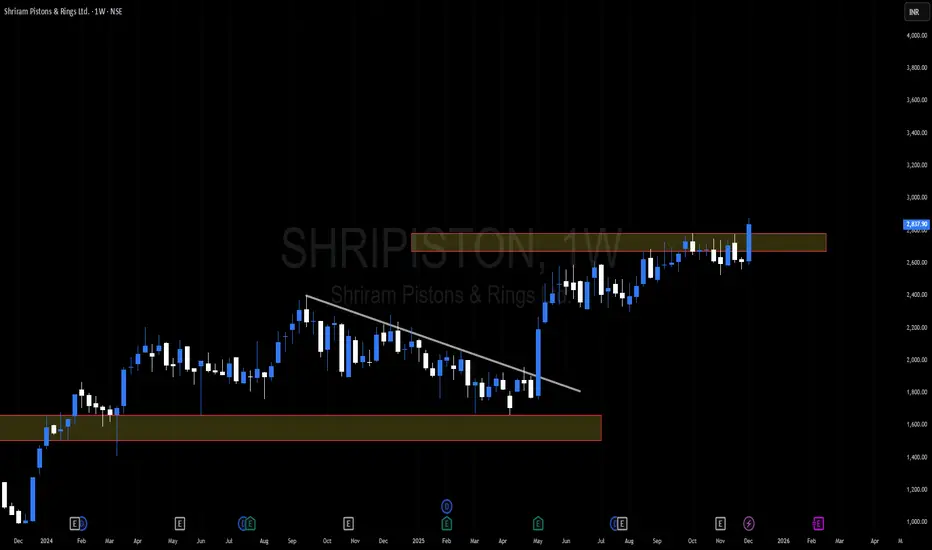
Amazing breakout on WEEKLY Timeframe - SHRIPISTONCheckout an amazing breakout happened in the stock in Weekly timeframe, macroscopically seen in Daily timeframe. Having a great favor that the stock might be bullish expecting a staggering returns of minimum 25% TGT. IMPORTANT BREAKOUT LEVELS ARE ALWAYS RESPECTED!
NOTE for learners: Place the breakout levels as per the chart shared and track it yourself to get amazed!!
#No complicated chart patterns
#No big big indicators
#No Excel sheet or number magics
TRADE IDEA: WAIT FOR THE STOCK TO BREAKOUT IN WEEKLY TIMEFRAME ABOVE THIS LEVEL.
Checkout an amazing breakout happened in the stock in Weekly timeframe.
Breakouts happening in longer timeframe is way more powerful than the breakouts seen in Daily timeframe. You can blindly invest once the weekly candle closes above the breakout line and stay invested forever. Also these stocks breakouts are lifelong predictions, it means technically these breakouts happen giving more returns in the longer runs. Hence, even when the scrip makes a loss of 10% / 20% / 30% / 50%, the stock will regain and turn around. Once they again enter the same breakout level, they will flyyyyyyyyyyyy like a ROCKET if held in the portfolio in the longer run.
Time makes money, GREEDY & EGO will not make money.
Also, magically these breakouts tend to prove that the companies turn around and fundamentally becoming strong. Also the magic happens when more diversification is done in various sectors under various scripts with equal money invested in each N500 scripts.
The real deal is when to purchase and where to purchase the stock. That is where Breakout study comes into play.
LET'S PUMP IN SOME MONEY AND REVOLUTIONIZE THE NATION'S ECONOMY!
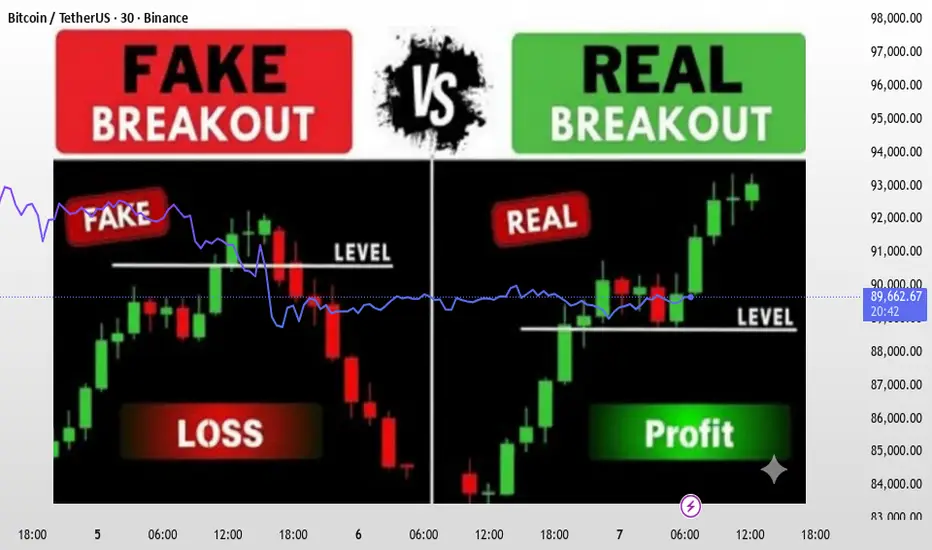
Breakout vs Fakeout – How to Identify the DifferenceBreakout vs Fakeout — The Complete Professional Guide
How Smart Money Creates Traps & How Traders Can Avoid Them
Breakouts and fakeouts are among the most misunderstood events in trading. Many traders enter too early, get trapped, and watch price reverse exactly after their entry. This educational idea explains, in depth, how institutions create fakeouts, how real breakouts are structured, and how you can confirm the difference using pure price action.
---
🔹 Understanding Market Behavior Behind Breakouts
Markets move from accumulation → manipulation → expansion.
The breakout or fakeout usually happens during the manipulation phase.
Smart Money (SMC) concepts play a major role here:
- Market builds liquidity above equal highs & below equal lows.
- Traders place buy stops or sell stops near key zones.
- Institutions trigger these stops to fill large orders.
- Only after trapping liquidity does the real move begin.
So before analysing a breakout, always ask:
👉 Who needs liquidity here — retail or institutions?
---
🔹 What Makes a Breakout Real?
A real breakout is not just a wick or a temporary push. It is a structural shift backed by momentum and confirmation.
✅ 1. Strong Candles With Clear Body Closes
A real breakout has wide-body candles closing decisively above resistance or below support.
Weak candles = weak intention.
✅ 2. Break + Retest + Continuation
The strongest breakouts follow this pattern:
1. Price breaks the level
2. Comes back for a clean retest
3. Holds structure
4. Forms a continuation pattern
This retest phase filters 70–80% of fakeouts.
✅ 3. Market Structure Shift (MSS / BOS)
For a bullish breakout:
- Price creates Higher Highs (HH) and Higher Lows (HL)
For bearish breakout:
- Price creates Lower Lows (LL) and Lower Highs (LH)
A breakout without structure change is not reliable.
✅ 4. Volume & Volatility Expansion
Breakouts must show an increase in:
- Volatility
- Candle size
- Trading activity
If volume remains flat, the breakout may fail.
---
🔹 How to Spot a Fakeout Before It Traps You
Fakeouts are intentional liquidity grabs. Here are the strongest warning signs:
❌ 1. Break Happens With Weak Candles
Small bodies, long wicks, hesitation candles — all indicate uncertainty.
❌ 2. Price Fails to Close Outside the Zone
This is the #1 rule:
If price does not close outside resistance/support, it is most likely a fakeout.
❌ 3. Instant Rejection Back Into the Range
If price breaks the level and immediately returns inside, institutions are hunting stops.
❌ 4. No Retest — Just a Sharp Reverse
Real breakouts retest.
Fakeouts don’t.
They reverse fast because their only purpose was liquidity collection.
❌ 5. Presence of Equal Highs / Equal Lows
When the market forms equal highs/lows, it signals liquidity pools.
Fakeouts usually occur right above/below these areas.
---
🔹 Advanced Confirmation Technique (Institutional Logic)
Here’s a professional-level method used by SMC traders:
1. Identify the liquidity zone (EQ highs/lows)
These serve as targets for traps.
2. Wait for the first breakout
Do not enter here.
3. Look for the rejection candle
A “fakeout candle” usually has:
- Long wick
- Small body
- Closes back inside the structure
4. Wait for BOS (Break of Structure)
Once price reverses and breaks an internal structure, the fakeout is confirmed.
5. Enter on the retest of the trap zone
This is the safest and most profitable entry.
---
🔹 Practical Example (General)
Let’s say Gold is ranging between $2400 - $2420.
- Price spikes above $2420, hits stops, and forms a long-wick candle
- The breakout candle fails to close above resistance
- Price immediately drops back inside the range
- Internal structure breaks → fakeout confirmed
- Retest of $2420 becomes the ideal sell entry
This exact behavior happens in XAUUSD almost daily.
---
🧠 Final Professional Tip
Breakouts are easy to trade once you stop trying to predict them.
Let the market show you:
- Strong close
- Clear retest
- Momentum
- Structural break
And avoid all entries based only on a wick touching resistance or support.
Patience is the difference between a trapped trader and a profitable trader.
Your boosts, comments, and likes motivate me to share more accurate analyses like this.
👉 If you found this helpful, please Boost the idea and leave a comment — it really helps!
— JT_CHARTsMaster
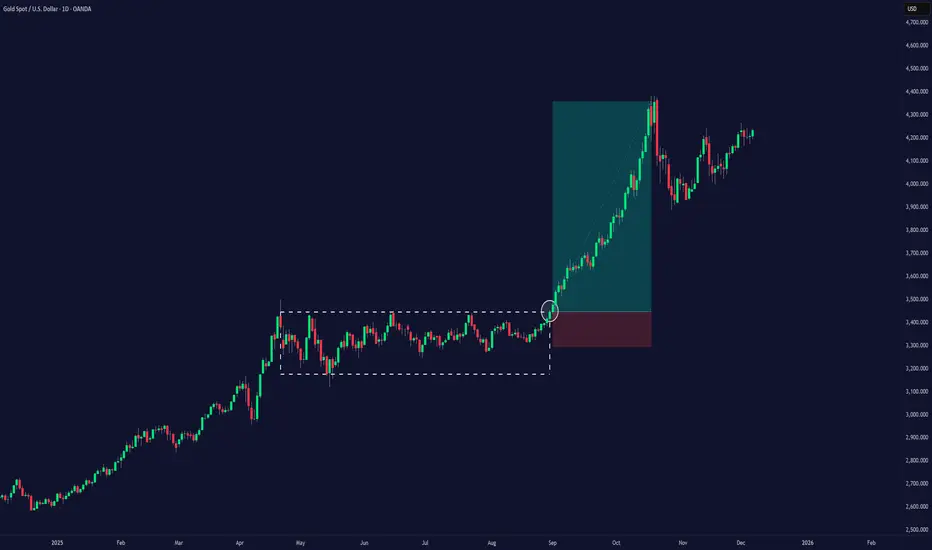
Silver and Gold Flag and Pole PatternBoth Silver and Gold are forming Flag and pole pattern on charts. If the breakout sustains and prices go higher with support of relatively higher volumes, both commodities can achieve higher prices in near term. The momentum is currently on bulls side in both commodities but silver has more relative strength than gold. So watch both commodities for breakout.

Breakout Trading: How Low Win-Rate Systems Beat the Market█ Breakout Trading: How Low Win-Rate Systems Beat the Market
Most traders misunderstand breakout strategies. They expect high win-rates, smooth equity curves, and clean continuation.
But real breakout systems operate differently:
Low win-rate
Many small losses
Occasional massive winners
And long periods of nothing
A breakout strategy is not about predicting direction. It is about exploiting asymmetry, volatility expansion, and structural price imbalances. It is not about being right often; it is about being paid well when you are right.
█ What a Breakout Really Is
A breakout occurs when the price finally moves out of a range or breaks through a key level. It is not magic, and it is not random. It is mechanics, liquidity, and pressure.
Inside a range or right at a major level:
Liquidity builds on both sides
Stops accumulate above resistance and below support
Traders wait for confirmation
Algorithms sit idle during volatility contraction
When price pushes through a key level, it triggers a chain reaction:
stop orders → breakout entries → momentum algos → forced exits. This cascade is what creates the explosive leg everyone tries to catch.
In simple terms , a breakout happens when the price moves outside a well-defined support or resistance zone with strong momentum. This surge often marks the beginning of a new trend, a volatility expansion, or a major shift in market sentiment.
Breakouts appear in every asset class: stocks, futures, crypto, forex, and commodities, and on every timeframe from minutes to weeks. They are popular because when they succeed, they can deliver large, rapid moves and outsized profits.
But here is the part most traders ignore:
Most breakouts do not follow through. False breaks are common, and markets have become more efficient over time. Only breakouts with the right conditions, such as momentum, liquidity imbalance, and volatility expansion, have a high probability of running.
█ The Truth Most Traders Don’t Want to Hear
Most breakouts fail. Even strong breakout systems may only win 20 to 40 percent of the time.
Why does this happen?
Many breakout levels are weak
Liquidity is thin around obvious highs and lows
Algorithms hunt stop clusters before the real move
Price often snaps back into the range before expanding
But here is the part that actually matters:
Breakouts do not need a high win rate.
They need high asymmetry.
Small, controlled losses.
Occasional large, runaway winners.
This is the core structure behind every profitable breakout strategy.
⚪ Win-Rate and Risk/Reward: What Traders Should Actually Expect
The simple overview above is backed by decades of quantitative research. Breakout systems consistently show low win-rates but high R-multiple payoffs, and this is not an opinion. It is a measurable statistical pattern across markets and timeframes.
1. Low Win-Rate Is Normal and Expected
Across studies, breakout strategies typically win between 20 and 40 percent of the time.
Research by Bulkowski, academic momentum studies, and intraday ORB tests all show the same thing:
Breakouts frequently fail
Modern markets generate more false breaks than in the past
Algorithms exploit obvious levels and stop clusters
Short-term price action is dominated by mean reversion
A low hit rate is not a flaw. It is the natural behavior of breakout mechanics.
2. The Edge Comes From Asymmetric Payoff Distribution
A breakout strategy becomes profitable not by winning often, but by winning big relative to the risk taken.
Historical performance shows:
Losers: usually −1R
Winners: often +3R, +5R, +10R and beyond
When a system captures even a few of these extended moves, it more than pays for the many small stop-outs.
3. Breakout Systems Exploit Fat Tails and Volatility Expansions
Financial returns are not normal. They are fat-tailed. Breakouts are designed to capture these rare, outsized price moves.
The return distribution typically looks like:
Many small losses from failed breaks
A few large wins during volatility expansion
Long flat periods during range-bound conditions
Occasional massive trends that define the entire year
This right-skewed distribution is well-documented in momentum and trend-following research.
4. Academic and Quant Research Confirms the Pattern
Multiple studies validate the same expectations:
Zarattini, Barbon & Aziz (2024): ORB strategy on “stocks in play” produced over 1,600 percent return with modest win-rates
Moskowitz, Ooi & Pedersen: Trend-following (a breakout variant) shows positive expectancy across a century of data
Bulkowski: Breakout failure rates increase over time, confirming the need for filters and asymmetry
CTA/Managed Futures: Long-term breakout systems show strong convexity; a few big winners generate the majority of returns
The conclusion is clear:
Breakout strategies work when they harness asymmetry, not prediction.
█ Example: Breakout System 1
Win-rate: 20.28%
Breakout System Gain: +274%
Buy & Hold Gain: +96%
Explanation of the chart:
Flat periods → range markets
Dips → false breaks and stop-outs
Explosive steps upward → successful breakouts that trend hard
This step-like equity curve is the fingerprint of all trend-and-breakout systems.
█ Example: Breakout System 2
This system shows the same profile:
Many trades fail, but losses stay small
Occasionally a breakout runs far enough to cover dozens of losses
The equity curve’s “zig-zag then spike” pattern is normal behavior
The system wins big because the winners are massive R-multiples, not because it’s right often
This is the signature of low win-rate, high reward asymmetry.
█ The Real Mechanics Behind a Successful Breakout
A real breakout is powered by multiple forces hitting at once:
New longs entering / new shorts entering (initiative flow)
Stops being triggered (forced participation)
Short covering or long liquidation (fuel)
Algos joining the momentum (acceleration)
Volatility expansion is making moves larger
⚪ Read more about what makes prices move up and down:
█ What Makes Breakout Strategies Hard for Humans
Breakout trading is psychologically painful because:
You lose often
You sit through boring periods
Most trades look like “nothing happens”
Only a few trades create 80–90% of the long-term profits
To succeed, you need:
Patience
Small, consistent risk
The discipline to let winners run
The acceptance that many trades will fail
Breakout success = emotional resilience + asymmetry, not prediction.
█ The Takeaway
Breakout strategies are simple in theory and brutal in practice:
Low win-rate
High reward
Long quiet periods
Occasional massive expansions
Step-like equity curves
Outperformance through asymmetry
In the end:
You don’t trade breakouts to be right often — you trade breakouts to get paid big when the market finally moves.
-----------------
Disclaimer
The content provided in my scripts, indicators, ideas, algorithms, and systems is for educational and informational purposes only. It does not constitute financial advice, investment recommendations, or a solicitation to buy or sell any financial instruments. I will not accept liability for any loss or damage, including without limitation any loss of profit, which may arise directly or indirectly from the use of or reliance on such information.
All investments involve risk, and the past performance of a security, industry, sector, market, financial product, trading strategy, backtest, or individual's trading does not guarantee future results or returns. Investors are fully responsible for any investment decisions they make. Such decisions should be based solely on an evaluation of their financial circumstances, investment objectives, risk tolerance, and liquidity needs.
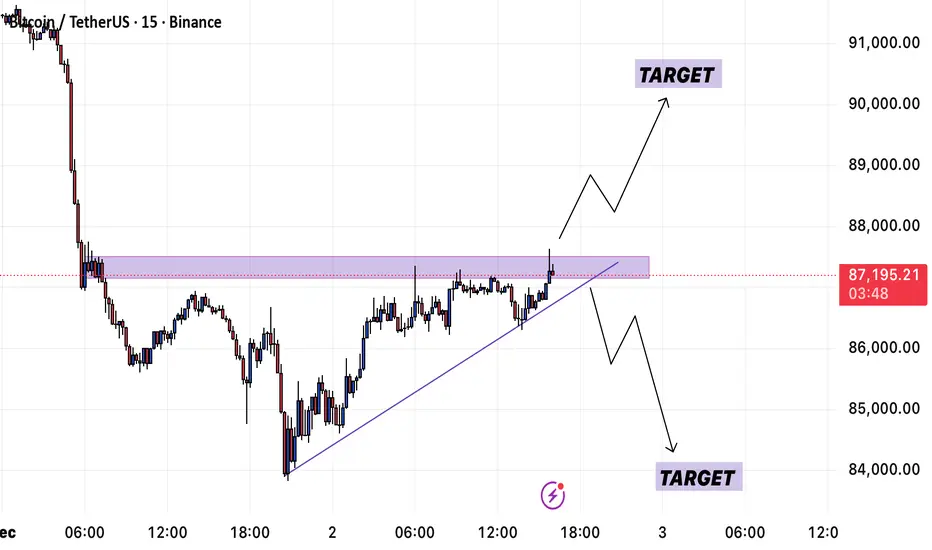
Bitcoin Squeezing Into Key Resistance: Breakout SetupBitcoin is currently testing a key horizontal resistance zone (highlighted in purple) after forming a steady series of higher lows along the ascending trendline. This creates a compression pattern where price is being squeezed toward a breakout point.
A decisive move above the resistance zone could trigger bullish continuation, with momentum potentially pushing price toward the next liquidity area around the upper target zone.
However, a rejection from this resistance or a break below the ascending trendline would shift the short-term bias bearish. In that case, price may revisit the lower liquidity pocket marked as the downside target.
Key Points:
• Structure: Higher lows forming against strong resistance
• Bullish Scenario: Break and hold above resistance → continuation toward 89k–90k zone
• Bearish Scenario: Trendline break + failure at resistance → move toward 84k area
• Decision Zone: Current resistance region is critical for determining direction
Bias:
Neutral-to-bullish while price holds above the ascending trendline. Confirmation required for either breakout or rejection.
Gold plans in Asian and European trading sessions1️⃣ Trend Lines
• Descending Trend Line (Key Dynamic Resistance)
Price has touched this trend line several times but has not broken through, confirming that selling pressure remains dominant.
This is a crucial area: if a breakout does not occur, the price could potentially reverse sharply lower.
• Long-Term Ascending Trend Line
This is the main bullish structure in the market.
A larger decline will likely break through this trend line before the price reacts.
2️⃣ Resistance (Red Zone Above)
This is the intersection of:
✓ Descending Trend Line
✓ Nearest Local Peak (High)
This is the best sell zone under current market conditions.
Only if the price is able to close the candle with a strong breakout can a bullish reversal be confirmed.
3️⃣ Support (Green zone below)
This zone has been a recurring price reaction area, serving as important short-term support.
If the price breaks through this support zone, the downtrend will likely continue towards the long-term uptrend line.
📈 BUY GOLD: 4167 – 4165
Stop Loss: 4155
Take Profit: 100 – 300 – 500 pips
📉 SELL GOLD: 4264 – 4266
Stop Loss: 4276
Take Profit: 100 – 300 – 500 pips

Gold price trend ahead of ADP news release on December 31️⃣ Trendline
▪ Rising Trendline (red / upward slope)
Price is moving within a bullish structure, continuously forming Higher Lows.
→ This acts as the main dynamic support guiding the uptrend.
Price is likely to retest this trendline around 4,145 before continuing upward.
▪ Falling Trendline (black / downward slope)
This is the major dynamic resistance, also overlapping with the extended Fibonacci zone.
→ The next potential touchpoint lies near the strong resistance area 4,300–4,340.
2️⃣ Key Support – Resistance Zones
▪ SUPPORT: 4,145 – 4,150
Confluence with EMA + trendline.
This is a high-probability zone where buyers are expected to defend the price.
▪ RESISTANCE: 4,335 – 4,340
Overlaps with the descending trendline.
Matches the 2.618 Fibonacci extension.
This is the main target of the current bullish structure.
→ A reaction or correction is expected when price reaches this area.
Trading Plan
BUY GOLD: 4145 – 4148
Stop Loss: 4135
Take Profit: 100 – 300 – 500 pips
SELL GOLD: 4260 – 4263
Stop Loss: 4270
Take Profit: 100 – 300 – 500 pips

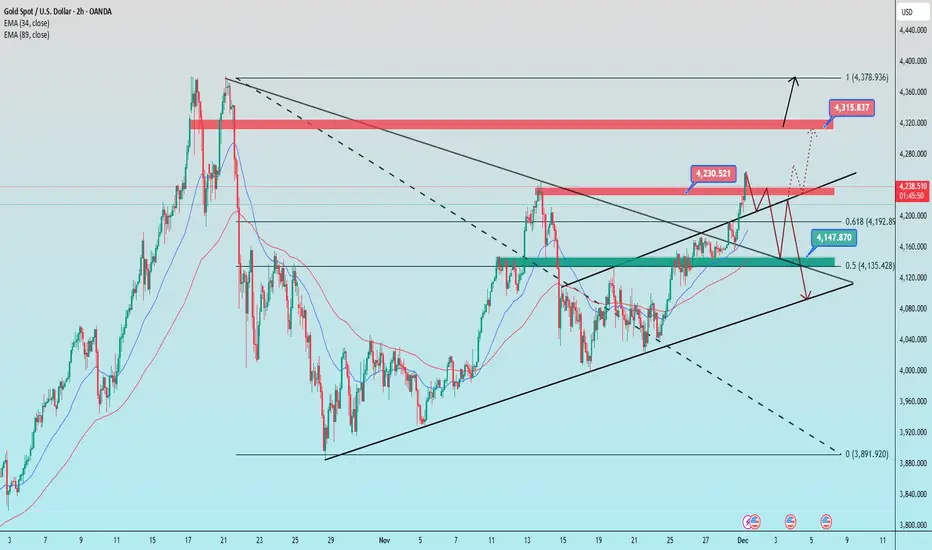
How did gold move in the first week of December? CONCISE & COMPREHENSIVE TECHNICAL ANALYSIS
1. Trend Lines
Ascending trend line (lower black line)
This is the main dynamic support of the current uptrend structure.
The price has bounced off this trend line several times → the short-term trend remains bullish as long as this line is not broken.
Major descending trend line (upper black line)
This is strong dynamic resistance on larger time frames, and the price recently touched this area.
This is an area where selling pressure frequently arises.
2. Support – Resistance
Resistance
4,243–4,245 (red zone):
This is the confluence of the previous peak and the descending trend line → selling pressure appears right in this area.
4,315–4,320 (next major resistance):
If this area is broken, the price will likely head towards 4,375–4,380.
Support
4.147–4.150 (green zone confluence):
Confluence of moving averages, the nearest swing low, and Fibonacci levels → important support that maintains the bullish structure.
4.105–4.120 (lower trendline):
If the price breaks through this area → the short-term trend has the potential to turn bearish.
3. Fibonacci
Fibonacci 0.618 = 4.194
→ Area with a high probability of a rebound if the price corrects.
Fibonacci 0.5 = 4.135
→ Confluence with strong support + trendline → potential buy zone if a deeper pullback occurs.
4. Price Scenarios
Scenario 1 – Continue Upward (Priority)
If the price remains above 4,200–4,215, there is potential for a retest:
➡️ 4,230 → 4,315 → 4,375
Scenario 2 – Downward Correction
If the price breaks through 4,190 and breaks through the green zone of 4,144–4,150, then:
➡️ Risk of a downward movement towards the 4,105–4,120 trend line
📌 Trading Plan
BUY GOLD: 4,148 – 4,250
Stop Loss: 4,138
Take Profit: 100–300–500 pips
SELL GOLD: 4,313 – 4,315
Stop Loss: 4,325
Take Profit: 100–300–500 pip