Amazing breakout on WEEKLY Timeframe - GOODLUCKCheckout an amazing breakout happened in the stock in Weekly timeframe, macroscopically seen in Daily timeframe. Having a great favor that the stock might be bullish expecting a staggering returns of minimum 25% TGT. IMPORTANT BREAKOUT LEVELS ARE ALWAYS RESPECTED!
NOTE for learners: Place the breakout levels as per the chart shared and track it yourself to get amazed!!
#No complicated chart patterns
#No big big indicators
#No Excel sheet or number magics
TRADE IDEA: WAIT FOR THE STOCK TO BREAKOUT IN WEEKLY TIMEFRAME ABOVE THIS LEVEL.
Checkout an amazing breakout happened in the stock in Weekly timeframe.
Breakouts happening in longer timeframe is way more powerful than the breakouts seen in Daily timeframe. You can blindly invest once the weekly candle closes above the breakout line and stay invested forever. Also these stocks breakouts are lifelong predictions, it means technically these breakouts happen giving more returns in the longer runs. Hence, even when the scrip makes a loss of 10% / 20% / 30% / 50%, the stock will regain and turn around. Once they again enter the same breakout level, they will flyyyyyyyyyyyy like a ROCKET if held in the portfolio in the longer run.
Time makes money, GREEDY & EGO will not make money.
Also, magically these breakouts tend to prove that the companies turn around and fundamentally becoming strong. Also the magic happens when more diversification is done in various sectors under various scripts with equal money invested in each N500 scripts.
The real deal is when to purchase and where to purchase the stock. That is where Breakout study comes into play.
LET'S PUMP IN SOME MONEY AND REVOLUTIONIZE THE NATION'S ECONOMY!
Breakouttrading

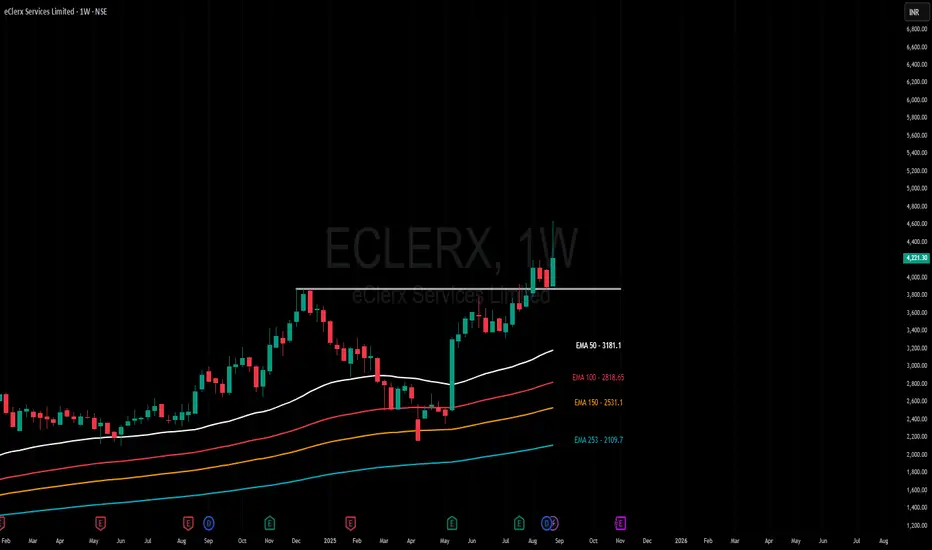
Amazing breakout on WEEKLY Timeframe - ECLERXCheckout an amazing breakout happened in the stock in Weekly timeframe, macroscopically seen in Daily timeframe. Having a great favor that the stock might be bullish expecting a staggering returns of minimum 25% TGT. IMPORTANT BREAKOUT LEVELS ARE ALWAYS RESPECTED!
NOTE for learners: Place the breakout levels as per the chart shared and track it yourself to get amazed!!
#No complicated chart patterns
#No big big indicators
#No Excel sheet or number magics
TRADE IDEA: WAIT FOR THE STOCK TO BREAKOUT IN WEEKLY TIMEFRAME ABOVE THIS LEVEL.
Checkout an amazing breakout happened in the stock in Weekly timeframe.
Breakouts happening in longer timeframe is way more powerful than the breakouts seen in Daily timeframe. You can blindly invest once the weekly candle closes above the breakout line and stay invested forever. Also these stocks breakouts are lifelong predictions, it means technically these breakouts happen giving more returns in the longer runs. Hence, even when the scrip makes a loss of 10% / 20% / 30% / 50%, the stock will regain and turn around. Once they again enter the same breakout level, they will flyyyyyyyyyyyy like a ROCKET if held in the portfolio in the longer run.
Time makes money, GREEDY & EGO will not make money.
Also, magically these breakouts tend to prove that the companies turn around and fundamentally becoming strong. Also the magic happens when more diversification is done in various sectors under various scripts with equal money invested in each N500 scripts.
The real deal is when to purchase and where to purchase the stock. That is where Breakout study comes into play.
LET'S PUMP IN SOME MONEY AND REVOLUTIONIZE THE NATION'S ECONOMY!
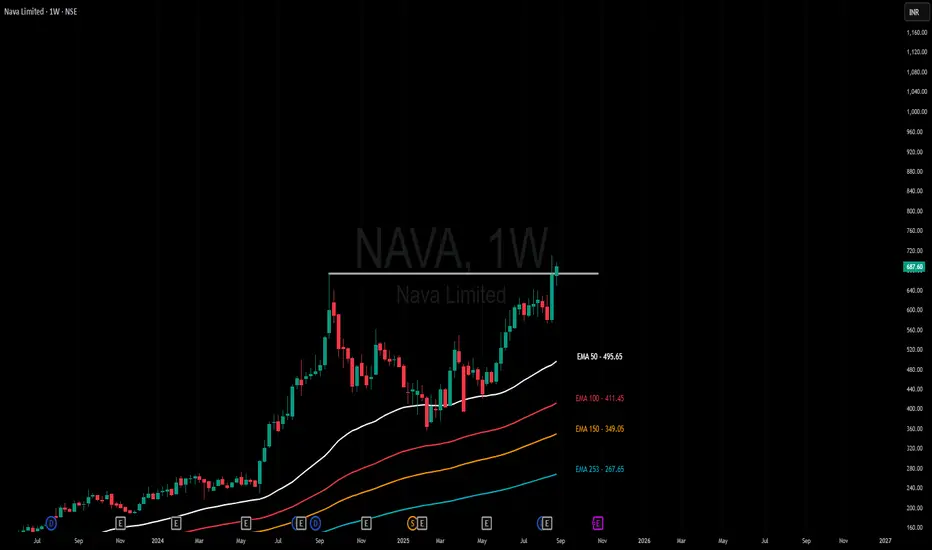
Amazing breakout on WEEKLY Timeframe - NAVACheckout an amazing breakout happened in the stock in Weekly timeframe, macroscopically seen in Daily timeframe. Having a great favor that the stock might be bullish expecting a staggering returns of minimum 25% TGT. IMPORTANT BREAKOUT LEVELS ARE ALWAYS RESPECTED!
NOTE for learners: Place the breakout levels as per the chart shared and track it yourself to get amazed!!
#No complicated chart patterns
#No big big indicators
#No Excel sheet or number magics
TRADE IDEA: WAIT FOR THE STOCK TO BREAKOUT IN WEEKLY TIMEFRAME ABOVE THIS LEVEL.
Checkout an amazing breakout happened in the stock in Weekly timeframe.
Breakouts happening in longer timeframe is way more powerful than the breakouts seen in Daily timeframe. You can blindly invest once the weekly candle closes above the breakout line and stay invested forever. Also these stocks breakouts are lifelong predictions, it means technically these breakouts happen giving more returns in the longer runs. Hence, even when the scrip makes a loss of 10% / 20% / 30% / 50%, the stock will regain and turn around. Once they again enter the same breakout level, they will flyyyyyyyyyyyy like a ROCKET if held in the portfolio in the longer run.
Time makes money, GREEDY & EGO will not make money.
Also, magically these breakouts tend to prove that the companies turn around and fundamentally becoming strong. Also the magic happens when more diversification is done in various sectors under various scripts with equal money invested in each N500 scripts.
The real deal is when to purchase and where to purchase the stock. That is where Breakout study comes into play.
LET'S PUMP IN SOME MONEY AND REVOLUTIONIZE THE NATION'S ECONOMY!
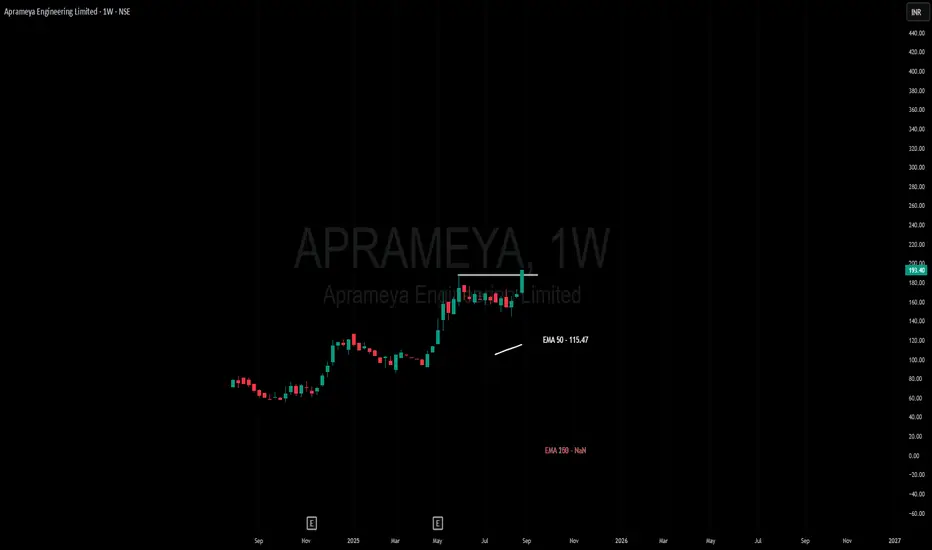
Amazing breakout on WEEKLY Timeframe - APRAMEYACheckout an amazing breakout happened in the stock in Weekly timeframe, macroscopically seen in Daily timeframe. Having a great favor that the stock might be bullish expecting a staggering returns of minimum 25% TGT. IMPORTANT BREAKOUT LEVELS ARE ALWAYS RESPECTED!
NOTE for learners: Place the breakout levels as per the chart shared and track it yourself to get amazed!!
#No complicated chart patterns
#No big big indicators
#No Excel sheet or number magics
TRADE IDEA: WAIT FOR THE STOCK TO BREAKOUT IN WEEKLY TIMEFRAME ABOVE THIS LEVEL.
Checkout an amazing breakout happened in the stock in Weekly timeframe.
Breakouts happening in longer timeframe is way more powerful than the breakouts seen in Daily timeframe. You can blindly invest once the weekly candle closes above the breakout line and stay invested forever. Also these stocks breakouts are lifelong predictions, it means technically these breakouts happen giving more returns in the longer runs. Hence, even when the scrip makes a loss of 10% / 20% / 30% / 50%, the stock will regain and turn around. Once they again enter the same breakout level, they will flyyyyyyyyyyyy like a ROCKET if held in the portfolio in the longer run.
Time makes money, GREEDY & EGO will not make money.
Also, magically these breakouts tend to prove that the companies turn around and fundamentally becoming strong. Also the magic happens when more diversification is done in various sectors under various scripts with equal money invested in each N500 scripts.
The real deal is when to purchase and where to purchase the stock. That is where Breakout study comes into play.
LET'S PUMP IN SOME MONEY AND REVOLUTIONIZE THE NATION'S ECONOMY!
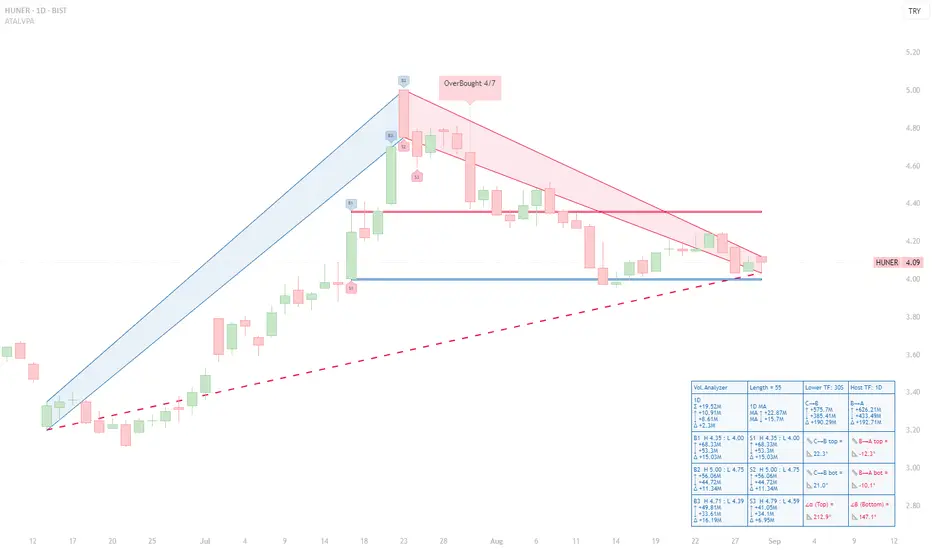
HUNER (1D) — Seller Bias After OB Cluster; Descending BA SlopesHUNER (1D) — Seller Bias After OB Cluster; Descending BA Slopes, 4.00 Support Under Test
Executive read (VPA, 55-bar window)
◉ OB/OS: An OverBought 4/7 tag printed at the apex; no confirmed OS on the right edge. That OB cluster preceded the entire red B→A leg and frames the current risk.
◉ Ranked volume peaks (Top-3):
- B1 (H 4.35/L 4.00) ↑ 68.33M, ↓ 53.3M, Δ +15.03M.
- B2 (H 5.00/L 4.75) ↑ 56.06M, ↓ 44.72M, Δ +11.34M.
- B3 (H 4.71/L 4.39) ↑ 49.81M, ↓ 33.61M, Δ +16.19M.
- S3 (H 4.79/L 4.59) ↑ 41.05M, ↓ 34.1M, Δ +6.95M.
Takeaway: Buying peaks were heavy, but subsequent price action failed to sustain higher highs; sellers have since controlled the B→A leg.
◉ Segment diagnostics:
- C→B advance: top/bottom slopes +22.3° / +21.0° → mature but constructive.
- B→A decline: top/bottom slopes –12.3° / –10.1° → persistent downside pressure.
- Orientation at B: α 212.9° (red) / β 147.1° (red) confirm the bearish state of the current swing geometry.
◉ Levels & structure:
- Support: the S1 low ≈ 4.00 is the active horizontal shelf repeatedly defended.
- Resistance: 4.35 (B1/S1 pivot), 4.71–4.79 (B3/S3 band), then 5.00 (B2). The descending B→A trendline caps bounces before these levels.
Actionable interpretation (educational):
Bias stays bearish-to-neutral while price trades beneath the B→A upper line and below 4.35. A credible shift would require (i) a fresh B-ranked bar with positive Δ near the right edge, and (ii) a close back above the B→A top. Failure to reclaim 4.35 after bounces leaves 4.00 vulnerable; a daily close below 4.00 would validate extension into the S-zones. Conversely, an OS print near 4.00 coupled with flattening BA slopes would set up a tactical mean-reversion toward 4.35 → 4.71/4.79.
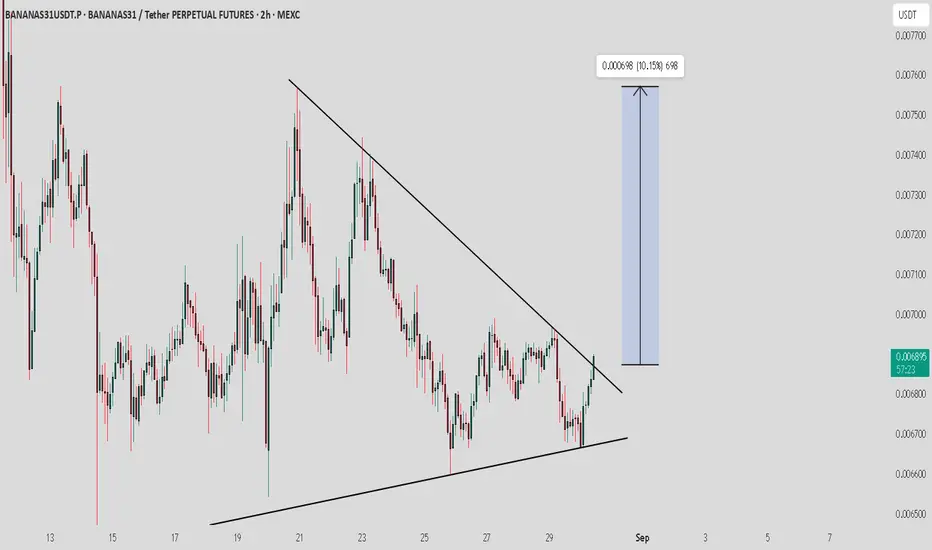
BANANAS31 / USDT : Breaking out from symmetrical triangleBANANAS31/USDT is breaking out of its trendline resistance. If this breakout holds, a short-term rally toward $0.0075 looks likely.
📌 Best strategy: Wait for confirmation through a bullish move or successful retest before entering. Always manage risk and avoid chasing without confirmation.
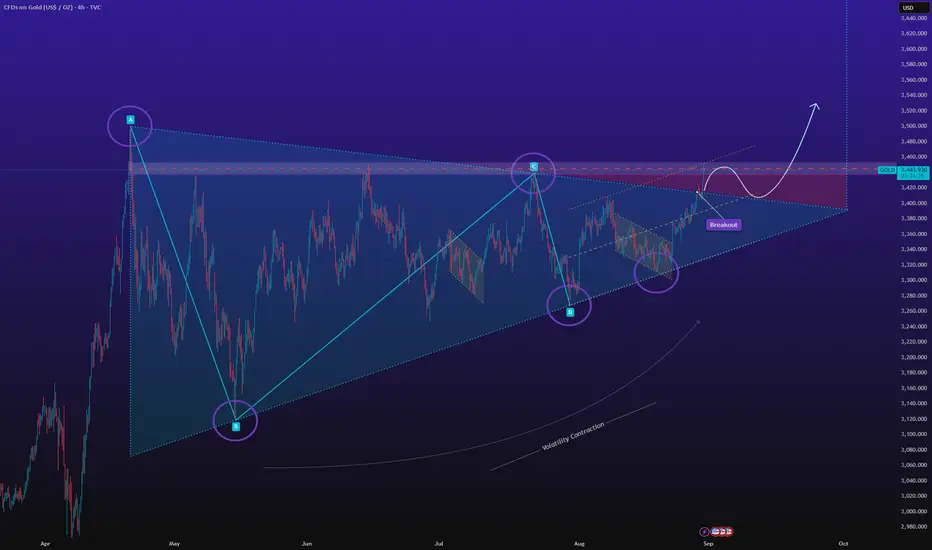
GOLD – Breakout Confirmed, Retesting 3415 Before PushGOLD has broken out of a 4-month bullish symmetric triangle, where volatility had been contracting as the pattern matured.
The triangle showed 3 reversal points on the bottom trendline and 2 on the top before the breakout.
Momentum confirmed the move, pushing price through resistance.
We will now see a strong sell-off for a healthy retest of the breakout zone around 3415. So short in the short term but long on the long term.
The measured move projection points to a new target at 3845.
📊 Key levels to watch:
Retest support: 3415 (critical level to hold)
Stop-loss zone: near the apex of the triangle (invalidates the pattern if broken)
Target: 3845
The breakout structure remains bullish, and as long as 3415 holds, the path toward 3845 remains intact.
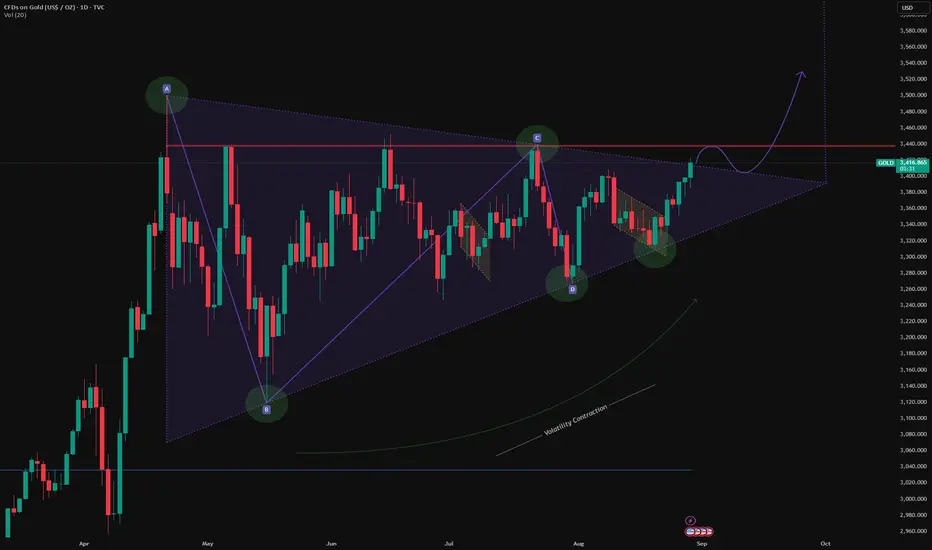
GOLD – Bullish Symmetric Triangle Breakout Targeting 4173GOLD has been consolidating inside a bullish symmetric triangle for the past 4 months, with volatility contracting significantly as the pattern matured.
On the support side, we can clearly identify 3 reversal points.
On the resistance side, price has tested 2 reversal points before finally breaking out to the upside.
The breakout leg shows strong bullish momentum, confirming buyers are in control.
Based on the measured move objective of the triangle, the projected target stands at 4173.
This breakout suggests continuation of the broader bullish trend, with volatility expansion likely to follow.
📊 Key levels to watch:
Support: former triangle resistance now turned into potential support
Stop-loss zone: near the apex of the triangle
Target: 4173
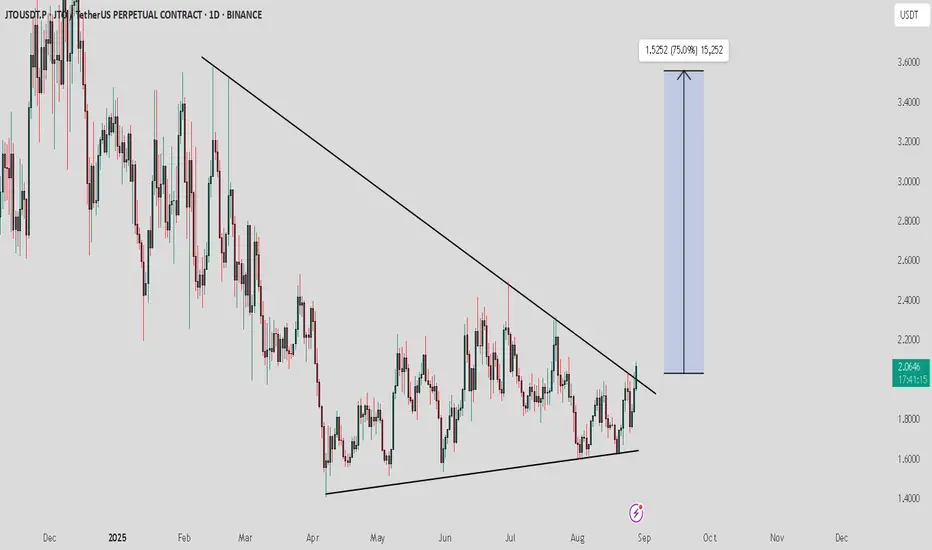
JTO / USDT : Breaking out from symmetrical triangleJTO/USDT is breaking out of a symmetrical triangle pattern. If this breakout sustains, we could see a strong bullish rally toward the $3 – $4 zone.
Recommendation: Spot buying is favorable here — enter after confirmation and consider holding for midterm gains. Always manage risk wisely.
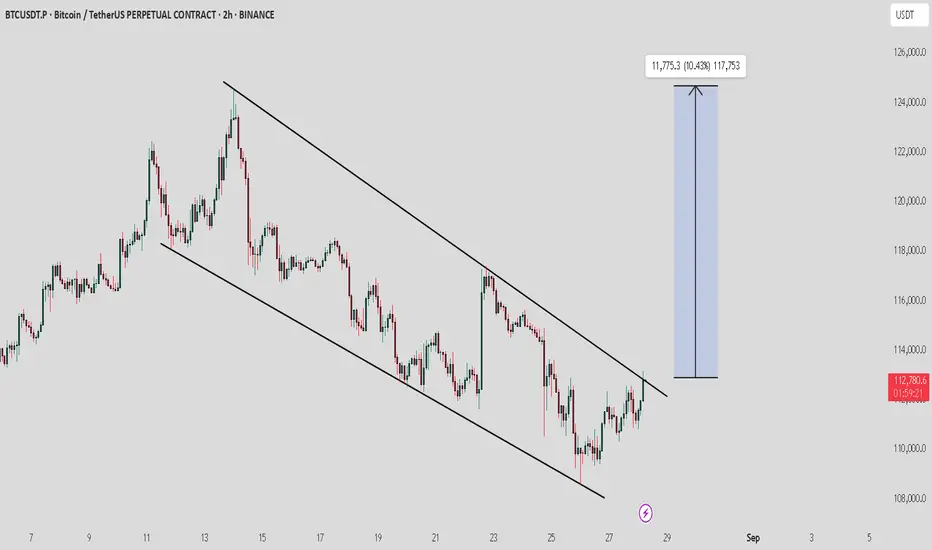
BTC / USDT : Trying to breakout from descending channelBTC/USDT is breaking out of the descending channel on the 2H timeframe. If this breakout holds, we could see a bullish rally of around +10%, targeting the $124,000 zone.
Trade Setup:
Entry: After breakout confirmation / retest hold above $113,000
Targets: $118,000 – $124,000
Stop-Loss: Below $111,000 (channel support invalidation)
As always, wait for confirmation to avoid fake breakouts and manage risk properly.
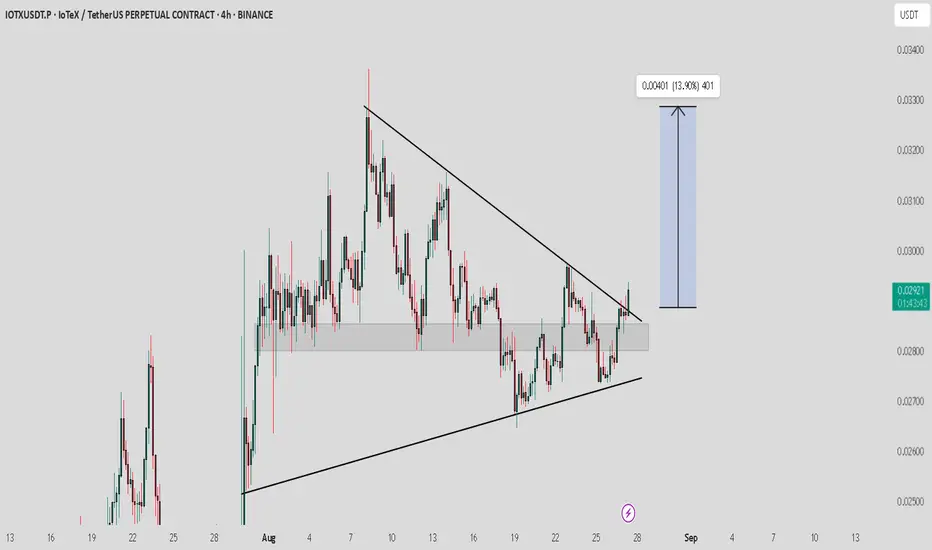
IOTX / USDT : Breaking out from symmetrical triangleIOTX/USDT has broken out from the symmetrical triangle. The key now is confirmation — a retest of the breakout zone may occur before continuation. If this level holds, price could rally toward the $0.0315 – $0.033 zone (+13–15%).
Trade Setup:
Entry: On successful retest hold / bullish confirmation candle above $0.030
Targets: $0.0315 – $0.033
Stop-Loss: Below $0.028 (breakout zone invalidation)
Best strategy: Wait for retest confirmation to avoid getting trapped in a false breakout.
Denison Mines: A very bullish chartDenison Mines is on the verge of breaking a 14 years consolidation.
The whole sector of uranium has been very strong in 2025 but the price of uranium itself hasn't moved that much and neither most of the small and mid cap names in the space. I'm expecting those to start waking up soon and when they do, their moves can be very powerful.
"The longer the range, the bigger the breakout" is a famous quote in trading. Let say how this one plays out above $2.45.

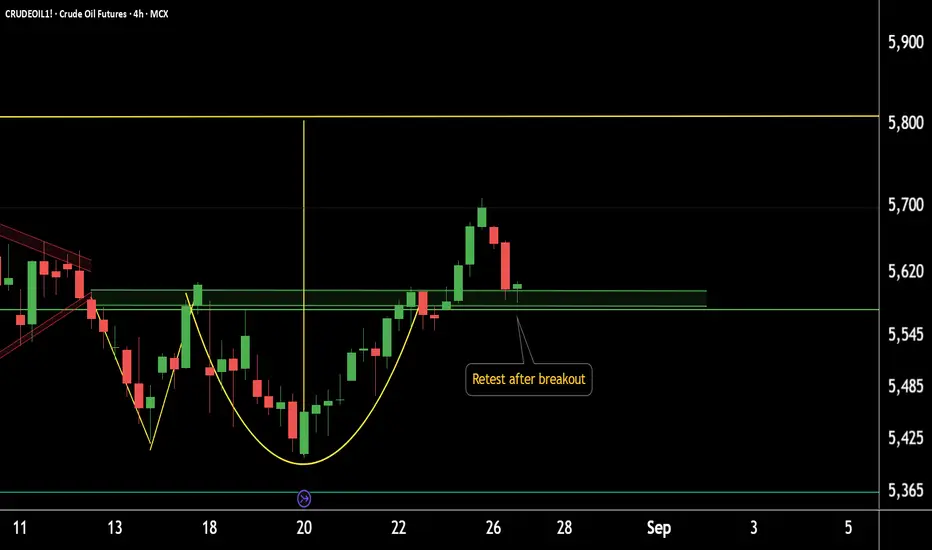
CRUDEOIL1! breakout + support confirmation=potential upside move4-Hour Chart Update: CRUDEOIL1!
CRUDEOIL1! has retested the breakout zone at 5580–5600.
If this level sustains, we may see higher prices ahead in CRUDEOIL1!.
Thank you!
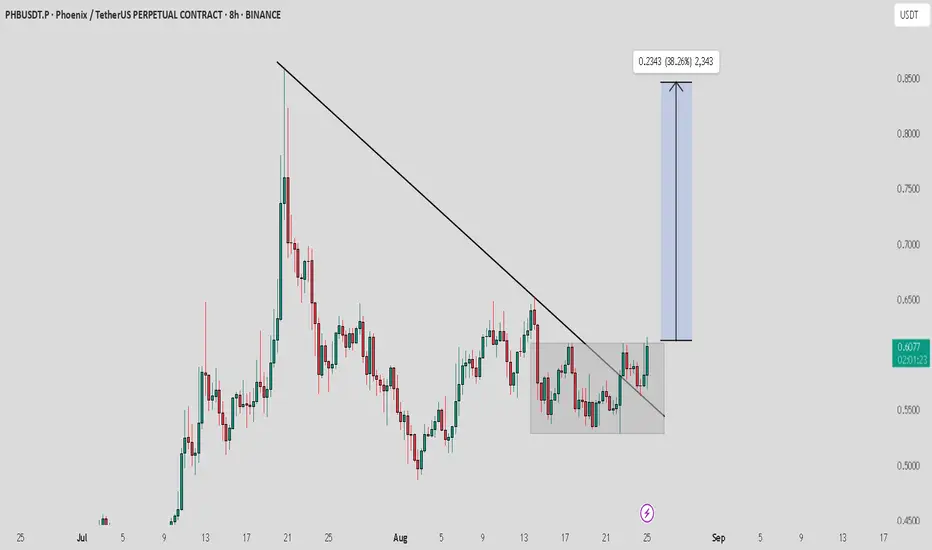
PHB / USDT : Looking bullish..Waiting for box breakoutPHB/USDT has broken above its trendline resistance after a period of consolidation. This breakout is showing strong potential, and if momentum sustains, price could rally toward the $0.80–0.85 zone.
Best approach: Wait for confirmation on retest or a strong bullish candle with volume before entering to avoid fake breakouts. Always manage risk properly.
SUDARSHANCHEMSUDARSHANCHEM showing very good strength and consolidating since a month near ATH. Result is expected tomorrow on 25-Aug. If it declares bumper result then we may see next leg of steep rally. In recent time accumulation has been observed. Provided that if it closes above 1380 level then one may get very good risk-reward trade from hereon. Keep a stock in watch list. Just a small volume may push it above resistance line.

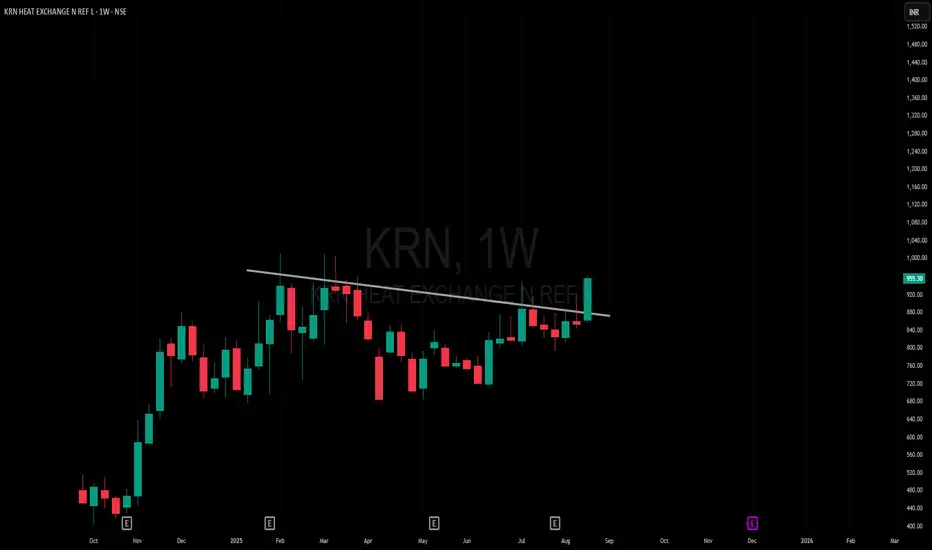
Amazing breakout on WEEKLY Timeframe - KRNCheckout an amazing breakout happened in the stock in Weekly timeframe, macroscopically seen in Daily timeframe. Having a great favor that the stock might be bullish expecting a staggering returns of minimum 25% TGT. IMPORTANT BREAKOUT LEVELS ARE ALWAYS RESPECTED!
NOTE for learners: Place the breakout levels as per the chart shared and track it yourself to get amazed!!
#No complicated chart patterns
#No big big indicators
#No Excel sheet or number magics
TRADE IDEA: WAIT FOR THE STOCK TO BREAKOUT IN WEEKLY TIMEFRAME ABOVE THIS LEVEL.
Checkout an amazing breakout happened in the stock in Weekly timeframe.
Breakouts happening in longer timeframe is way more powerful than the breakouts seen in Daily timeframe. You can blindly invest once the weekly candle closes above the breakout line and stay invested forever. Also these stocks breakouts are lifelong predictions, it means technically these breakouts happen giving more returns in the longer runs. Hence, even when the scrip makes a loss of 10% / 20% / 30% / 50%, the stock will regain and turn around. Once they again enter the same breakout level, they will flyyyyyyyyyyyy like a ROCKET if held in the portfolio in the longer run.
Time makes money, GREEDY & EGO will not make money.
Also, magically these breakouts tend to prove that the companies turn around and fundamentally becoming strong. Also the magic happens when more diversification is done in various sectors under various scripts with equal money invested in each N500 scripts.
The real deal is when to purchase and where to purchase the stock. That is where Breakout study comes into play.
Check this stock which has made an all time low and high chances that it makes a "V" shaped recovery.
> Taking support at last years support or breakout level
> High chances that it reverses from this point.
> Volume dried up badly in last few months / days.
> Very high suspicion based analysis and not based on chart patterns / candle patterns deeply.
> VALUABLE STOCK AVAILABLE AT A DISCOUNTED PRICE
> OPPURTUNITY TO ACCUMULATE ADEQUATE QUANTITY
> MARKET AFTER A CORRECTION / PANIC FALL TO MAKE GOOD INVESTMENT
DISCLAIMER : This is just for educational purpose. This type of analysis is equivalent to catching a falling knife. If you are a warrior, you throw all the knives back else you will be sorrow if it hits SL. Make sure to do your analysis well. This type of analysis only suits high risks investor and whose is willing to throw all the knives above irrespective of any sectoral rotation. BE VERY CAUTIOUS AS IT IS EXTREME BOTTOM FISHING.
HOWEVER, THIS IS HOW MULTIBAGGERS ARE CAUGHT !
STOCK IS AT RIGHT PE / RIGHT EVALUATION / MORE ROAD TO GROW / CORRECTED IV / EXCELLENT BOOKS / USING MARKET CRASH AS AN OPPURTUNITY / EPS AT SKY.
LET'S PUMP IN SOME MONEY AND REVOLUTIONIZE THE NATION'S ECONOMY!
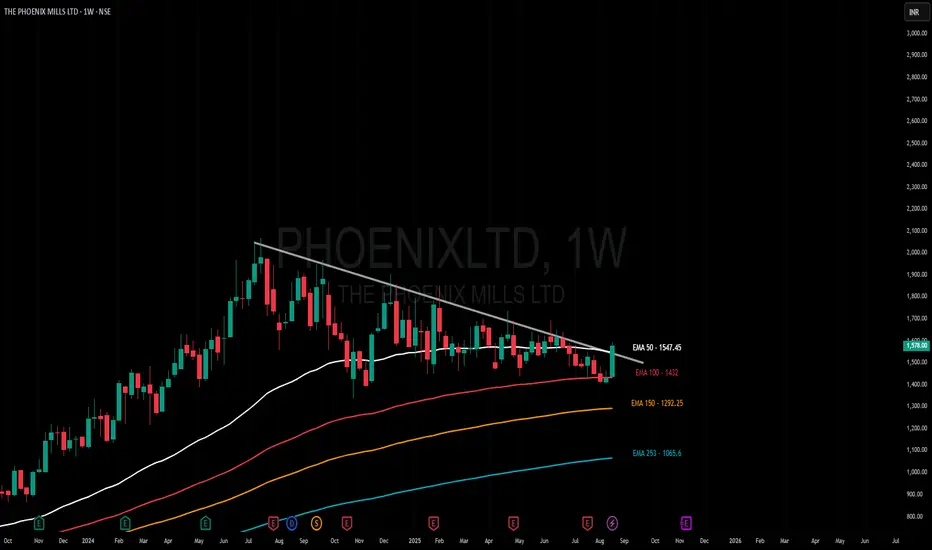
Amazing breakout on WEEKLY Timeframe - PHOENIXLTDCheckout an amazing breakout happened in the stock in Weekly timeframe, macroscopically seen in Daily timeframe. Having a great favor that the stock might be bullish expecting a staggering returns of minimum 25% TGT. IMPORTANT BREAKOUT LEVELS ARE ALWAYS RESPECTED!
NOTE for learners: Place the breakout levels as per the chart shared and track it yourself to get amazed!!
#No complicated chart patterns
#No big big indicators
#No Excel sheet or number magics
TRADE IDEA: WAIT FOR THE STOCK TO BREAKOUT IN WEEKLY TIMEFRAME ABOVE THIS LEVEL.
Checkout an amazing breakout happened in the stock in Weekly timeframe.
Breakouts happening in longer timeframe is way more powerful than the breakouts seen in Daily timeframe. You can blindly invest once the weekly candle closes above the breakout line and stay invested forever. Also these stocks breakouts are lifelong predictions, it means technically these breakouts happen giving more returns in the longer runs. Hence, even when the scrip makes a loss of 10% / 20% / 30% / 50%, the stock will regain and turn around. Once they again enter the same breakout level, they will flyyyyyyyyyyyy like a ROCKET if held in the portfolio in the longer run.
Time makes money, GREEDY & EGO will not make money.
Also, magically these breakouts tend to prove that the companies turn around and fundamentally becoming strong. Also the magic happens when more diversification is done in various sectors under various scripts with equal money invested in each N500 scripts.
The real deal is when to purchase and where to purchase the stock. That is where Breakout study comes into play.
Check this stock which has made an all time low and high chances that it makes a "V" shaped recovery.
> Taking support at last years support or breakout level
> High chances that it reverses from this point.
> Volume dried up badly in last few months / days.
> Very high suspicion based analysis and not based on chart patterns / candle patterns deeply.
> VALUABLE STOCK AVAILABLE AT A DISCOUNTED PRICE
> OPPURTUNITY TO ACCUMULATE ADEQUATE QUANTITY
> MARKET AFTER A CORRECTION / PANIC FALL TO MAKE GOOD INVESTMENT
DISCLAIMER : This is just for educational purpose. This type of analysis is equivalent to catching a falling knife. If you are a warrior, you throw all the knives back else you will be sorrow if it hits SL. Make sure to do your analysis well. This type of analysis only suits high risks investor and whose is willing to throw all the knives above irrespective of any sectoral rotation. BE VERY CAUTIOUS AS IT IS EXTREME BOTTOM FISHING.
HOWEVER, THIS IS HOW MULTIBAGGERS ARE CAUGHT !
STOCK IS AT RIGHT PE / RIGHT EVALUATION / MORE ROAD TO GROW / CORRECTED IV / EXCELLENT BOOKS / USING MARKET CRASH AS AN OPPURTUNITY / EPS AT SKY.
LET'S PUMP IN SOME MONEY AND REVOLUTIONIZE THE NATION'S ECONOMY!
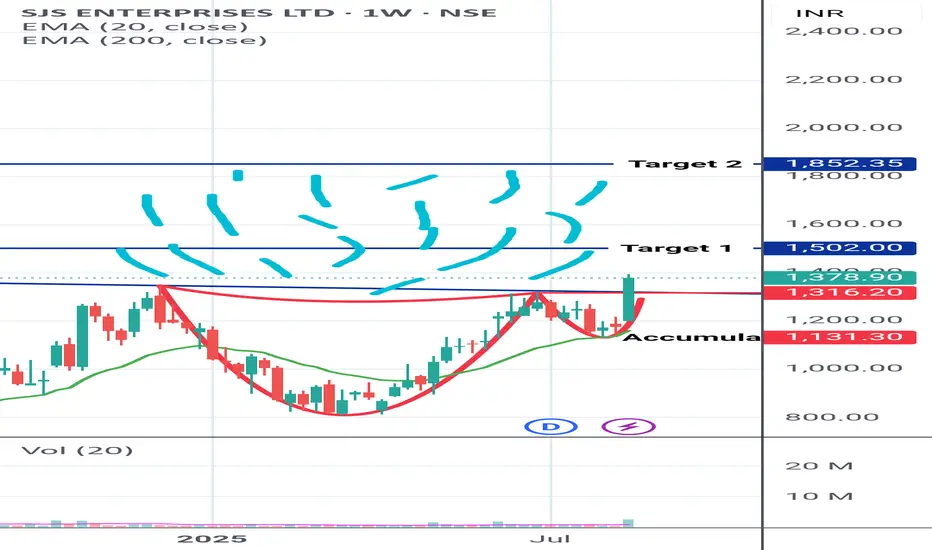
SJS ENTERPRISES VERY HOTSJS ENTERPRISES
Presents you a Hot Beautiful Cup of Coffee for tasting.
Those who wish to Enjoy the Taste can pay and start tasting it
Note Levels mentioned in chart itself. Kindly go through it
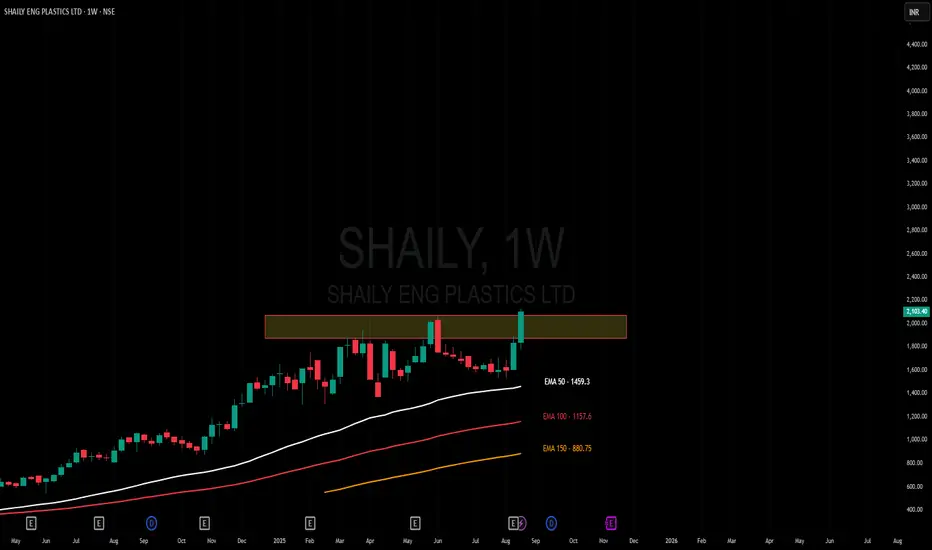
Amazing breakout on WEEKLY Timeframe - SHAILYCheckout an amazing breakout happened in the stock in Weekly timeframe, macroscopically seen in Daily timeframe. Having a great favor that the stock might be bullish expecting a staggering returns of minimum 25% TGT. IMPORTANT BREAKOUT LEVELS ARE ALWAYS RESPECTED!
NOTE for learners: Place the breakout levels as per the chart shared and track it yourself to get amazed!!
#No complicated chart patterns
#No big big indicators
#No Excel sheet or number magics
TRADE IDEA: WAIT FOR THE STOCK TO BREAKOUT IN WEEKLY TIMEFRAME ABOVE THIS LEVEL.
Checkout an amazing breakout happened in the stock in Weekly timeframe.
Breakouts happening in longer timeframe is way more powerful than the breakouts seen in Daily timeframe. You can blindly invest once the weekly candle closes above the breakout line and stay invested forever. Also these stocks breakouts are lifelong predictions, it means technically these breakouts happen giving more returns in the longer runs. Hence, even when the scrip makes a loss of 10% / 20% / 30% / 50%, the stock will regain and turn around. Once they again enter the same breakout level, they will flyyyyyyyyyyyy like a ROCKET if held in the portfolio in the longer run.
Time makes money, GREEDY & EGO will not make money.
Also, magically these breakouts tend to prove that the companies turn around and fundamentally becoming strong. Also the magic happens when more diversification is done in various sectors under various scripts with equal money invested in each N500 scripts.
The real deal is when to purchase and where to purchase the stock. That is where Breakout study comes into play.
Check this stock which has made an all time low and high chances that it makes a "V" shaped recovery.
> Taking support at last years support or breakout level
> High chances that it reverses from this point.
> Volume dried up badly in last few months / days.
> Very high suspicion based analysis and not based on chart patterns / candle patterns deeply.
> VALUABLE STOCK AVAILABLE AT A DISCOUNTED PRICE
> OPPURTUNITY TO ACCUMULATE ADEQUATE QUANTITY
> MARKET AFTER A CORRECTION / PANIC FALL TO MAKE GOOD INVESTMENT
DISCLAIMER : This is just for educational purpose. This type of analysis is equivalent to catching a falling knife. If you are a warrior, you throw all the knives back else you will be sorrow if it hits SL. Make sure to do your analysis well. This type of analysis only suits high risks investor and whose is willing to throw all the knives above irrespective of any sectoral rotation. BE VERY CAUTIOUS AS IT IS EXTREME BOTTOM FISHING.
HOWEVER, THIS IS HOW MULTIBAGGERS ARE CAUGHT !
STOCK IS AT RIGHT PE / RIGHT EVALUATION / MORE ROAD TO GROW / CORRECTED IV / EXCELLENT BOOKS / USING MARKET CRASH AS AN OPPURTUNITY / EPS AT SKY.
LET'S PUMP IN SOME MONEY AND REVOLUTIONIZE THE NATION'S ECONOMY!
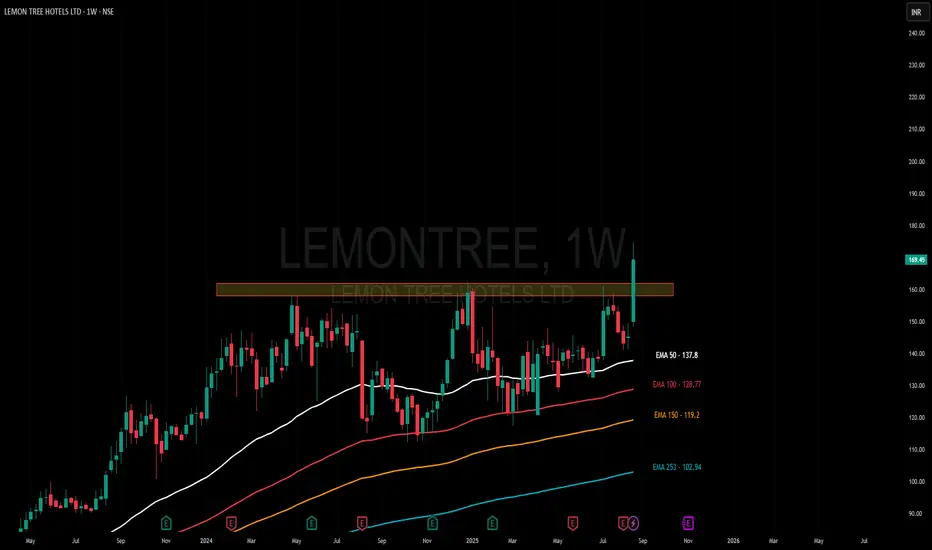
Amazing breakout on WEEKLY Timeframe - LEMONTREECheckout an amazing breakout happened in the stock in Weekly timeframe, macroscopically seen in Daily timeframe. Having a great favor that the stock might be bullish expecting a staggering returns of minimum 25% TGT. IMPORTANT BREAKOUT LEVELS ARE ALWAYS RESPECTED!
NOTE for learners: Place the breakout levels as per the chart shared and track it yourself to get amazed!!
#No complicated chart patterns
#No big big indicators
#No Excel sheet or number magics
TRADE IDEA: WAIT FOR THE STOCK TO BREAKOUT IN WEEKLY TIMEFRAME ABOVE THIS LEVEL.
Checkout an amazing breakout happened in the stock in Weekly timeframe.
Breakouts happening in longer timeframe is way more powerful than the breakouts seen in Daily timeframe. You can blindly invest once the weekly candle closes above the breakout line and stay invested forever. Also these stocks breakouts are lifelong predictions, it means technically these breakouts happen giving more returns in the longer runs. Hence, even when the scrip makes a loss of 10% / 20% / 30% / 50%, the stock will regain and turn around. Once they again enter the same breakout level, they will flyyyyyyyyyyyy like a ROCKET if held in the portfolio in the longer run.
Time makes money, GREEDY & EGO will not make money.
Also, magically these breakouts tend to prove that the companies turn around and fundamentally becoming strong. Also the magic happens when more diversification is done in various sectors under various scripts with equal money invested in each N500 scripts.
The real deal is when to purchase and where to purchase the stock. That is where Breakout study comes into play.
Check this stock which has made an all time low and high chances that it makes a "V" shaped recovery.
> Taking support at last years support or breakout level
> High chances that it reverses from this point.
> Volume dried up badly in last few months / days.
> Very high suspicion based analysis and not based on chart patterns / candle patterns deeply.
> VALUABLE STOCK AVAILABLE AT A DISCOUNTED PRICE
> OPPURTUNITY TO ACCUMULATE ADEQUATE QUANTITY
> MARKET AFTER A CORRECTION / PANIC FALL TO MAKE GOOD INVESTMENT
DISCLAIMER : This is just for educational purpose. This type of analysis is equivalent to catching a falling knife. If you are a warrior, you throw all the knives back else you will be sorrow if it hits SL. Make sure to do your analysis well. This type of analysis only suits high risks investor and whose is willing to throw all the knives above irrespective of any sectoral rotation. BE VERY CAUTIOUS AS IT IS EXTREME BOTTOM FISHING.
HOWEVER, THIS IS HOW MULTIBAGGERS ARE CAUGHT !
STOCK IS AT RIGHT PE / RIGHT EVALUATION / MORE ROAD TO GROW / CORRECTED IV / EXCELLENT BOOKS / USING MARKET CRASH AS AN OPPURTUNITY / EPS AT SKY.
LET'S PUMP IN SOME MONEY AND REVOLUTIONIZE THE NATION'S ECONOMY!
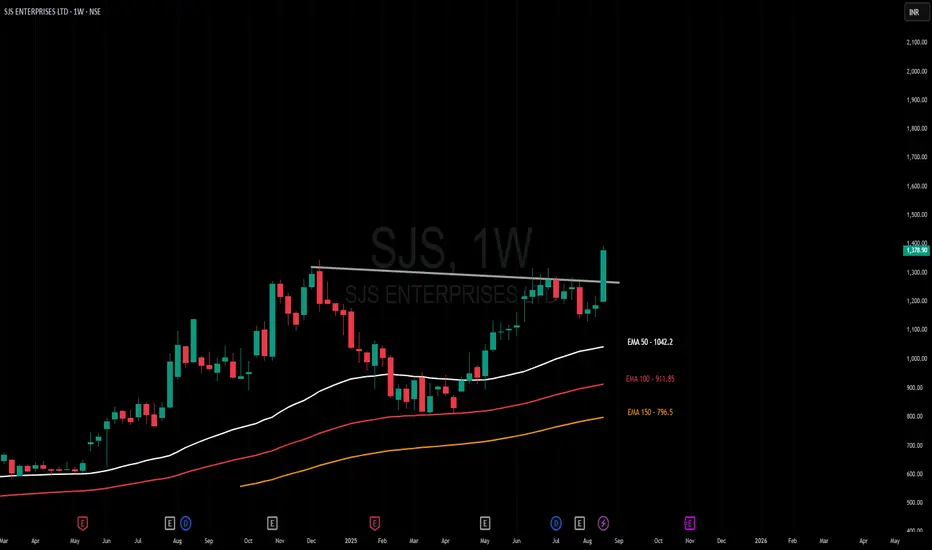
Amazing breakout on WEEKLY Timeframe - SJSCheckout an amazing breakout happened in the stock in Weekly timeframe, macroscopically seen in Daily timeframe. Having a great favor that the stock might be bullish expecting a staggering returns of minimum 25% TGT. IMPORTANT BREAKOUT LEVELS ARE ALWAYS RESPECTED!
NOTE for learners: Place the breakout levels as per the chart shared and track it yourself to get amazed!!
#No complicated chart patterns
#No big big indicators
#No Excel sheet or number magics
TRADE IDEA: WAIT FOR THE STOCK TO BREAKOUT IN WEEKLY TIMEFRAME ABOVE THIS LEVEL.
Checkout an amazing breakout happened in the stock in Weekly timeframe.
Breakouts happening in longer timeframe is way more powerful than the breakouts seen in Daily timeframe. You can blindly invest once the weekly candle closes above the breakout line and stay invested forever. Also these stocks breakouts are lifelong predictions, it means technically these breakouts happen giving more returns in the longer runs. Hence, even when the scrip makes a loss of 10% / 20% / 30% / 50%, the stock will regain and turn around. Once they again enter the same breakout level, they will flyyyyyyyyyyyy like a ROCKET if held in the portfolio in the longer run.
Time makes money, GREEDY & EGO will not make money.
Also, magically these breakouts tend to prove that the companies turn around and fundamentally becoming strong. Also the magic happens when more diversification is done in various sectors under various scripts with equal money invested in each N500 scripts.
The real deal is when to purchase and where to purchase the stock. That is where Breakout study comes into play.
Check this stock which has made an all time low and high chances that it makes a "V" shaped recovery.
> Taking support at last years support or breakout level
> High chances that it reverses from this point.
> Volume dried up badly in last few months / days.
> Very high suspicion based analysis and not based on chart patterns / candle patterns deeply.
> VALUABLE STOCK AVAILABLE AT A DISCOUNTED PRICE
> OPPURTUNITY TO ACCUMULATE ADEQUATE QUANTITY
> MARKET AFTER A CORRECTION / PANIC FALL TO MAKE GOOD INVESTMENT
DISCLAIMER : This is just for educational purpose. This type of analysis is equivalent to catching a falling knife. If you are a warrior, you throw all the knives back else you will be sorrow if it hits SL. Make sure to do your analysis well. This type of analysis only suits high risks investor and whose is willing to throw all the knives above irrespective of any sectoral rotation. BE VERY CAUTIOUS AS IT IS EXTREME BOTTOM FISHING.
HOWEVER, THIS IS HOW MULTIBAGGERS ARE CAUGHT !
STOCK IS AT RIGHT PE / RIGHT EVALUATION / MORE ROAD TO GROW / CORRECTED IV / EXCELLENT BOOKS / USING MARKET CRASH AS AN OPPURTUNITY / EPS AT SKY.
LET'S PUMP IN SOME MONEY AND REVOLUTIONIZE THE NATION'S ECONOMY!
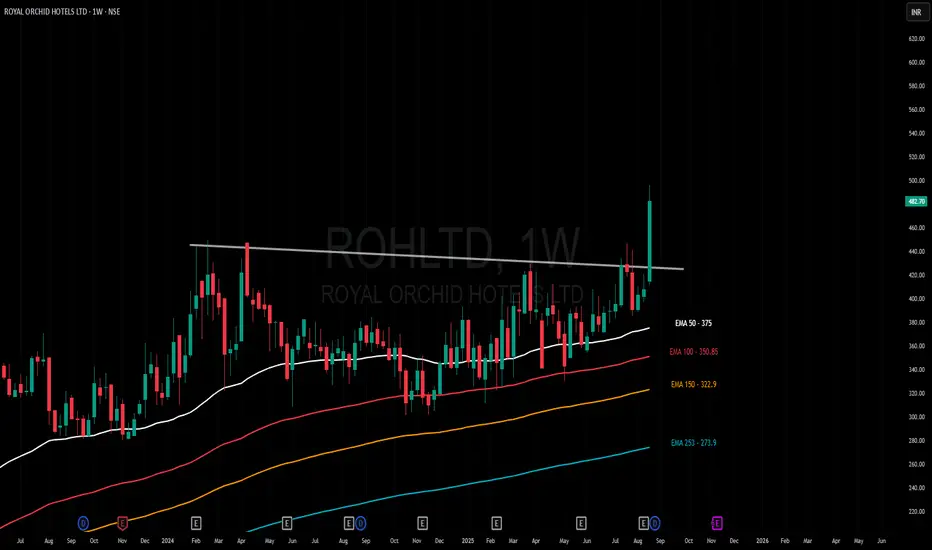
Amazing breakout on WEEKLY Timeframe - ROHLTDCheckout an amazing breakout happened in the stock in Weekly timeframe, macroscopically seen in Daily timeframe. Having a great favor that the stock might be bullish expecting a staggering returns of minimum 25% TGT. IMPORTANT BREAKOUT LEVELS ARE ALWAYS RESPECTED!
NOTE for learners: Place the breakout levels as per the chart shared and track it yourself to get amazed!!
#No complicated chart patterns
#No big big indicators
#No Excel sheet or number magics
TRADE IDEA: WAIT FOR THE STOCK TO BREAKOUT IN WEEKLY TIMEFRAME ABOVE THIS LEVEL.
Checkout an amazing breakout happened in the stock in Weekly timeframe.
Breakouts happening in longer timeframe is way more powerful than the breakouts seen in Daily timeframe. You can blindly invest once the weekly candle closes above the breakout line and stay invested forever. Also these stocks breakouts are lifelong predictions, it means technically these breakouts happen giving more returns in the longer runs. Hence, even when the scrip makes a loss of 10% / 20% / 30% / 50%, the stock will regain and turn around. Once they again enter the same breakout level, they will flyyyyyyyyyyyy like a ROCKET if held in the portfolio in the longer run.
Time makes money, GREEDY & EGO will not make money.
Also, magically these breakouts tend to prove that the companies turn around and fundamentally becoming strong. Also the magic happens when more diversification is done in various sectors under various scripts with equal money invested in each N500 scripts.
The real deal is when to purchase and where to purchase the stock. That is where Breakout study comes into play.
Check this stock which has made an all time low and high chances that it makes a "V" shaped recovery.
> Taking support at last years support or breakout level
> High chances that it reverses from this point.
> Volume dried up badly in last few months / days.
> Very high suspicion based analysis and not based on chart patterns / candle patterns deeply.
> VALUABLE STOCK AVAILABLE AT A DISCOUNTED PRICE
> OPPURTUNITY TO ACCUMULATE ADEQUATE QUANTITY
> MARKET AFTER A CORRECTION / PANIC FALL TO MAKE GOOD INVESTMENT
DISCLAIMER : This is just for educational purpose. This type of analysis is equivalent to catching a falling knife. If you are a warrior, you throw all the knives back else you will be sorrow if it hits SL. Make sure to do your analysis well. This type of analysis only suits high risks investor and whose is willing to throw all the knives above irrespective of any sectoral rotation. BE VERY CAUTIOUS AS IT IS EXTREME BOTTOM FISHING.
HOWEVER, THIS IS HOW MULTIBAGGERS ARE CAUGHT !
STOCK IS AT RIGHT PE / RIGHT EVALUATION / MORE ROAD TO GROW / CORRECTED IV / EXCELLENT BOOKS / USING MARKET CRASH AS AN OPPURTUNITY / EPS AT SKY.
LET'S PUMP IN SOME MONEY AND REVOLUTIONIZE THE NATION'S ECONOMY!
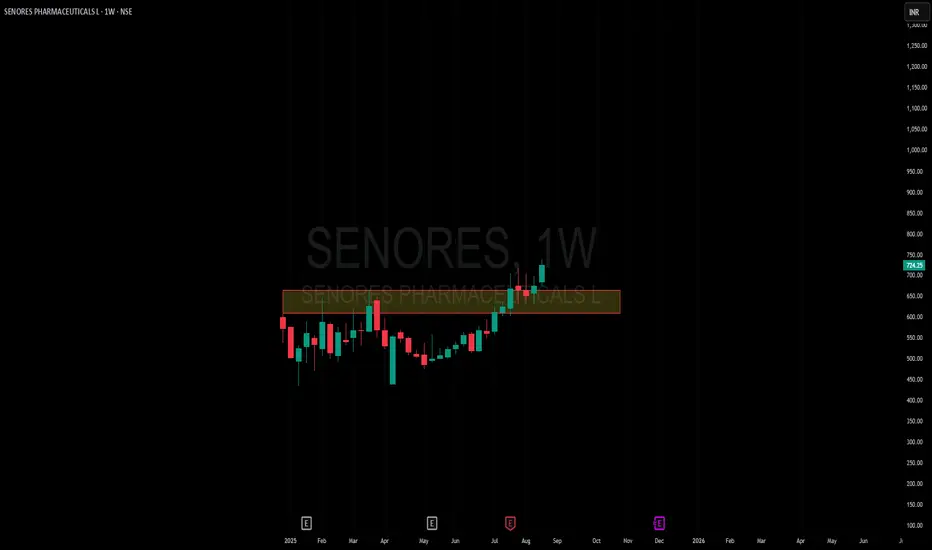
Amazing breakout on WEEKLY Timeframe - SENORESCheckout an amazing breakout happened in the stock in Weekly timeframe, macroscopically seen in Daily timeframe. Having a great favor that the stock might be bullish expecting a staggering returns of minimum 25% TGT. IMPORTANT BREAKOUT LEVELS ARE ALWAYS RESPECTED!
NOTE for learners: Place the breakout levels as per the chart shared and track it yourself to get amazed!!
#No complicated chart patterns
#No big big indicators
#No Excel sheet or number magics
TRADE IDEA: WAIT FOR THE STOCK TO BREAKOUT IN WEEKLY TIMEFRAME ABOVE THIS LEVEL.
Checkout an amazing breakout happened in the stock in Weekly timeframe.
Breakouts happening in longer timeframe is way more powerful than the breakouts seen in Daily timeframe. You can blindly invest once the weekly candle closes above the breakout line and stay invested forever. Also these stocks breakouts are lifelong predictions, it means technically these breakouts happen giving more returns in the longer runs. Hence, even when the scrip makes a loss of 10% / 20% / 30% / 50%, the stock will regain and turn around. Once they again enter the same breakout level, they will flyyyyyyyyyyyy like a ROCKET if held in the portfolio in the longer run.
Time makes money, GREEDY & EGO will not make money.
Also, magically these breakouts tend to prove that the companies turn around and fundamentally becoming strong. Also the magic happens when more diversification is done in various sectors under various scripts with equal money invested in each N500 scripts.
The real deal is when to purchase and where to purchase the stock. That is where Breakout study comes into play.
Check this stock which has made an all time low and high chances that it makes a "V" shaped recovery.
> Taking support at last years support or breakout level
> High chances that it reverses from this point.
> Volume dried up badly in last few months / days.
> Very high suspicion based analysis and not based on chart patterns / candle patterns deeply.
> VALUABLE STOCK AVAILABLE AT A DISCOUNTED PRICE
> OPPURTUNITY TO ACCUMULATE ADEQUATE QUANTITY
> MARKET AFTER A CORRECTION / PANIC FALL TO MAKE GOOD INVESTMENT
DISCLAIMER : This is just for educational purpose. This type of analysis is equivalent to catching a falling knife. If you are a warrior, you throw all the knives back else you will be sorrow if it hits SL. Make sure to do your analysis well. This type of analysis only suits high risks investor and whose is willing to throw all the knives above irrespective of any sectoral rotation. BE VERY CAUTIOUS AS IT IS EXTREME BOTTOM FISHING.
HOWEVER, THIS IS HOW MULTIBAGGERS ARE CAUGHT !
STOCK IS AT RIGHT PE / RIGHT EVALUATION / MORE ROAD TO GROW / CORRECTED IV / EXCELLENT BOOKS / USING MARKET CRASH AS AN OPPURTUNITY / EPS AT SKY.
LET'S PUMP IN SOME MONEY AND REVOLUTIONIZE THE NATION'S ECONOMY!