Gold plans in Asian and European trading sessions1️⃣ Trend Lines
• Descending Trend Line (Key Dynamic Resistance)
Price has touched this trend line several times but has not broken through, confirming that selling pressure remains dominant.
This is a crucial area: if a breakout does not occur, the price could potentially reverse sharply lower.
• Long-Term Ascending Trend Line
This is the main bullish structure in the market.
A larger decline will likely break through this trend line before the price reacts.
2️⃣ Resistance (Red Zone Above)
This is the intersection of:
✓ Descending Trend Line
✓ Nearest Local Peak (High)
This is the best sell zone under current market conditions.
Only if the price is able to close the candle with a strong breakout can a bullish reversal be confirmed.
3️⃣ Support (Green zone below)
This zone has been a recurring price reaction area, serving as important short-term support.
If the price breaks through this support zone, the downtrend will likely continue towards the long-term uptrend line.
📈 BUY GOLD: 4167 – 4165
Stop Loss: 4155
Take Profit: 100 – 300 – 500 pips
📉 SELL GOLD: 4264 – 4266
Stop Loss: 4276
Take Profit: 100 – 300 – 500 pips
Breakouttrading

Gold price trend ahead of ADP news release on December 31️⃣ Trendline
▪ Rising Trendline (red / upward slope)
Price is moving within a bullish structure, continuously forming Higher Lows.
→ This acts as the main dynamic support guiding the uptrend.
Price is likely to retest this trendline around 4,145 before continuing upward.
▪ Falling Trendline (black / downward slope)
This is the major dynamic resistance, also overlapping with the extended Fibonacci zone.
→ The next potential touchpoint lies near the strong resistance area 4,300–4,340.
2️⃣ Key Support – Resistance Zones
▪ SUPPORT: 4,145 – 4,150
Confluence with EMA + trendline.
This is a high-probability zone where buyers are expected to defend the price.
▪ RESISTANCE: 4,335 – 4,340
Overlaps with the descending trendline.
Matches the 2.618 Fibonacci extension.
This is the main target of the current bullish structure.
→ A reaction or correction is expected when price reaches this area.
Trading Plan
BUY GOLD: 4145 – 4148
Stop Loss: 4135
Take Profit: 100 – 300 – 500 pips
SELL GOLD: 4260 – 4263
Stop Loss: 4270
Take Profit: 100 – 300 – 500 pips

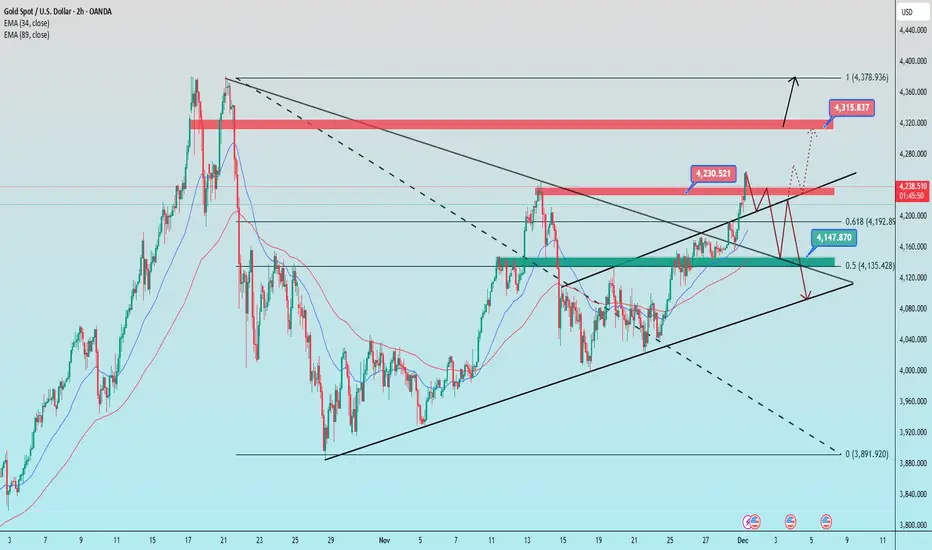
How did gold move in the first week of December? CONCISE & COMPREHENSIVE TECHNICAL ANALYSIS
1. Trend Lines
Ascending trend line (lower black line)
This is the main dynamic support of the current uptrend structure.
The price has bounced off this trend line several times → the short-term trend remains bullish as long as this line is not broken.
Major descending trend line (upper black line)
This is strong dynamic resistance on larger time frames, and the price recently touched this area.
This is an area where selling pressure frequently arises.
2. Support – Resistance
Resistance
4,243–4,245 (red zone):
This is the confluence of the previous peak and the descending trend line → selling pressure appears right in this area.
4,315–4,320 (next major resistance):
If this area is broken, the price will likely head towards 4,375–4,380.
Support
4.147–4.150 (green zone confluence):
Confluence of moving averages, the nearest swing low, and Fibonacci levels → important support that maintains the bullish structure.
4.105–4.120 (lower trendline):
If the price breaks through this area → the short-term trend has the potential to turn bearish.
3. Fibonacci
Fibonacci 0.618 = 4.194
→ Area with a high probability of a rebound if the price corrects.
Fibonacci 0.5 = 4.135
→ Confluence with strong support + trendline → potential buy zone if a deeper pullback occurs.
4. Price Scenarios
Scenario 1 – Continue Upward (Priority)
If the price remains above 4,200–4,215, there is potential for a retest:
➡️ 4,230 → 4,315 → 4,375
Scenario 2 – Downward Correction
If the price breaks through 4,190 and breaks through the green zone of 4,144–4,150, then:
➡️ Risk of a downward movement towards the 4,105–4,120 trend line
📌 Trading Plan
BUY GOLD: 4,148 – 4,250
Stop Loss: 4,138
Take Profit: 100–300–500 pips
SELL GOLD: 4,313 – 4,315
Stop Loss: 4,325
Take Profit: 100–300–500 pip
Will gold prices rise again in the new week?1️⃣ Trendline
Long-term descending trendline (upper black line)
Price has strongly broken above the long-standing descending trendline.
→ This signals a transition from a bearish phase to a medium-term bullish trend.
Short-term ascending trendline (small channel)
Price is moving inside a short-term ascending channel, consistently forming higher lows.
The recent breakout came with strong momentum → bullish strength is currently dominant.
2️⃣ Support – Resistance
Key Support Levels
4,111 – 4,108:
A confluence zone of the ascending channel’s bottom, EMA, and the 0.618 Fibonacci level → strong support if price pulls back.
4,145 – 4,150:
This is the breakout zone and will act as a retest support if price revisits it.
Key Resistance Levels
4,238 – 4,245 (Fibo 1.618 + previous structure high)
→ First major resistance zone. Price may consolidate or shake before breaking through.
4,375 – 4,380 (Fibo 2.618 + major upper zone, ATH area)
→ Large upside target if price breaks and holds above 4,245.
3️⃣ Fibonacci
The current upward swing is targeting the 1.618 Fibonacci extension at 4,238 – 4,245.
If this zone is broken and price closes above:
→ Next extension target is 2.618 Fibonacci near 4,375 – 4,380.
4️⃣ Trend Outlook
Trend: Short-term bullish → shifting to medium-term bullish after breaking the major descending trendline.
Key level to hold:
Above 4,145–4,150 = bullish continuation.
Upside targets:
4,238 – 4,245
4,372 – 4,380 (if bullish momentum continues)
Trading Plan
BUY GOLD: 4111 – 4108
Stop Loss: 4098
Take Profit: 200 – 400 – 700 pips
SELL GOLD: 4278 – 4281
Stop Loss: 4291
Take Profit: 200 – 400 – 700 pips

Bank holiday what will gold price be on 28 november 2025?1️⃣ Trendline
Ascending Trendline (red channel)
Price is moving inside a short-term ascending channel, forming higher highs and higher lows.
Recently touched the upper boundary → a technical pullback toward the lower boundary is likely.
Descending Trendline (red dotted)
This is a dynamic resistance from the higher timeframe.
Price has just broken above it; a retest is normal → creating a strong confluence area.
2️⃣ Key Support & Resistance
Resistance
4,240 – 4,245 (Fibo 1.618 + major supply zone)
→ This is the upside target if price continues to hold within the ascending channel.
Support 1 (nearest)
4,165 – 4,170 (trendline + MA + previous consolidation zone)
→ This zone is crucial for maintaining the bullish structure.
Support 2 (stronger)
4,095 – 4,112 (Fibo 0.5 – 0.618 + broad demand zone)
→ If Support 1 breaks, price may retrace deeply into this area.
3️⃣ Fibonacci Levels
Fibo 1.0 at 4,162 → currently the main retest point.
Fibo 0.618 at 4,111 → strong confluence with the major demand zone.
Fibo 1.618 at 4,245–4,255 → matches the top resistance → primary bullish target if the trendline holds.
4️⃣ Scenarios
Bullish Scenario (preferred)
If price holds above 4,165 – 4,170
→ it continues following the ascending channel → target 4,240 – 4,245.
Bearish Scenario
Break of the trendline + candle close below 4,165
→ confirms a correction phase → price likely moves down to 4,109 – 4,105.
Trade Ideas
BUY GOLD:
4165 – 4162
Stoploss: 4152
Take Profit: 100 – 300 – 500 pips
SELL GOLD:
4240 – 4243
Stoploss: 4250
Take Profit: 100 – 300 – 500 pips

Bitcoin Analysis October 2025Bitcoin faced correction after last flash crash where bitcoin had 10% pullback, and it now has nice rally to the upside. Fixed volume range showed accumulation of buying orders. I expect price to push to the previous high on the left.

Bitcoin prediction Nov 2025Bitcoin prediction Nov 2025, Bitcoin is expected to push to the upside after it broke previous high and came to test previous low and bullish order block and start to move toward previous high (Bullish Extension). This move may break previous all-time high and break record of 2025 All-time high.

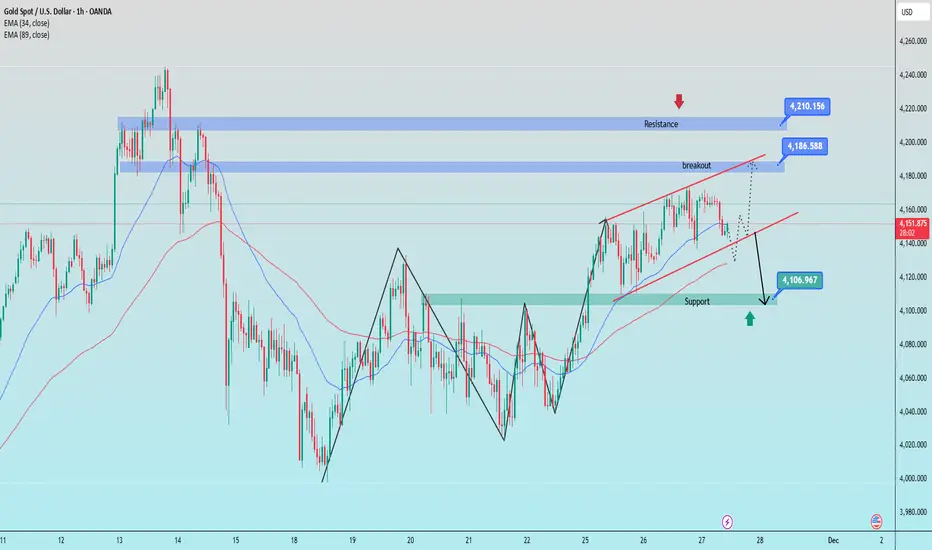
Gold is still moving sideways and waiting for a breakout1. Trendline Structure
Ascending Channel (red)
Upper trendline: price has been repeatedly rejected at the upper boundary → strong dynamic resistance.
Lower trendline: recently pierced slightly → indicates weakening buying pressure and increased correction risk.
2. Key Resistance
4,186 – 4,210: Strong supply zone + confluence with the upper trendline.
This is a zone that price will struggle to break without strong volume.
→ If price breaks above and successfully retests → the next target is the 4,210 area.
3. Key Support
4,105 – 4,110: Major support zone, confluence with EMA & the 0.5 Fibonacci level.
→ High probability that buyers will step in around this area.
4. Overview
Major Resistance: 4,186 – 4,210
Major Support: 4,105 – 4,110
Short-term Trend: weakening, leaning toward a corrective move.
Key Signal: a break below 4,140 → confirms a drop toward the support zone.
Bullish Scenario: only activated if the price reclaims 4,186.
BUY GOLD : 4107 - 4109
Stoploss : 4097
Take Profit : 100-300-500pips
SELL GOLD : 4209 - 4211
Stoploss : 4221
Take Profit : 100-300-500pips
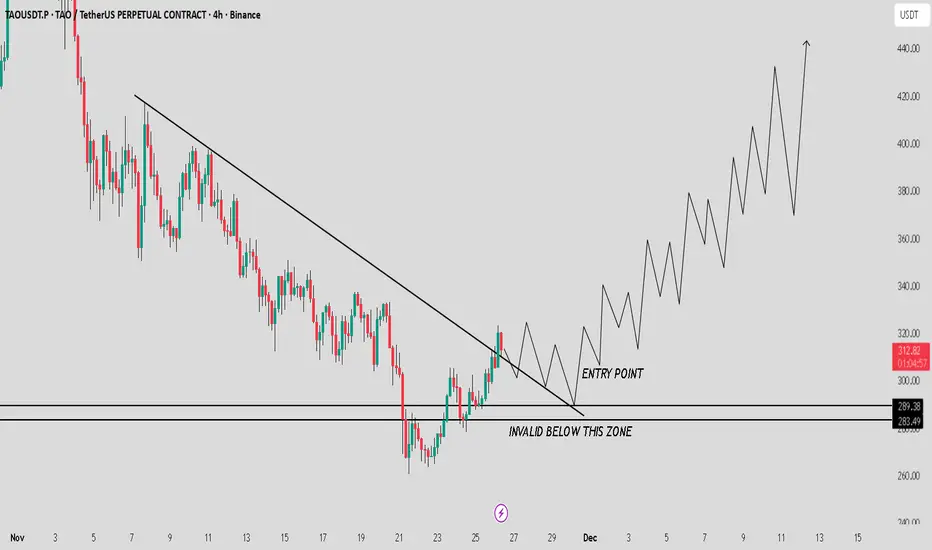
TAO / USDT : Strong above support and Ready for a bullish moveTAO / USDT is looking so good above the $283 – $289 levels…
If we see a clean retest and price holds above this zone, I’m expecting a strong upward movement towards $350 – $400 in the coming days. Momentum is picking up and structure is turning bullish step by step.
Manage risk wisely and follow the chart carefully… Breakdown below this zone will invalidate the setup.
How did gold perform after the PPI news?🧭 1. Trendline
Descending trendline (red – dynamic resistance)
Price has clearly broken out above the descending trendline.
Price is currently in a slight retest of this trendline → if it holds above 4,150–4,160, a short-term uptrend is confirmed.
Ascending trendline (hidden in the underlying structure)
Confluence support zone is around 4,107–4,110
→ This is a very strong area for a pullback if it occurs.
🧱 2. Support – Resistance
Key Resistance
4,209–4,212: Strong supply zone, also a confluence with the previous peak area.
4,240–4,242: 1.618 Fibonacci extension + peak in the major supply zone → important target.
Support
4.107 – 4.110: Confluence of:
Fibonacci 0.5 – 0.618
EMA as support
Retest zone breakout
→ This is a priority buy area if the price pulls back.
📐 3. Fibonacci
The 0.5 – 0.618 Fibonacci of the rising wave is right in the green support zone → confirming strong demand.
The 1.618 Fibonacci extension points to 4.240 – 4.245 → most likely the final target of this rising wave.
BUY GOLD: 4107 - 4110
Stop Loss: 4097
Take Profit: 100-300-500 pips
SELL GOLD: 4209 - 4212
Stop Loss: 4222
Take Profit: 100-300-500 pips

EURUSD – Breakout Level WatchThis zone around 1.15560 is not an ordinary level…
It’s a strong resistance which rejected price multiple times in the past.
Every time buyers pushed up, this level acted like a wall and sent price back down.
Right now price is again testing this same resistance, and for me the plan is very simple:
✨ My Trading Approach
I’m waiting for a clear breakout above 1.15560.
Not a wick… I need a solid candle-body close with satisfying volume.
Only then the upside momentum becomes meaningful.
If that happens, I expect price to expand toward the next Fib Extension zones.
These green lines are my expectation areas:
🎯 Target 1: 1.15850
🎯 Target 2: 1.16200
These levels are calculated based on the Fib Extension tool, not random guessing.
⚠️ Invalid Setup Condition
If the breakout appears without proper volume support, then this entire setup becomes invalid for me.
I will not continue the idea if it lacks strength.
📘 Disclaimer
This is my personal market approach, not financial advice.
Trade safely.

Bitcoin - H1 Breakout Alert – Bulls Taking Control!BTC/USDT - Bitcoin has officially broken its descending trendline and completed a successful retest from the demand zone. This shift signals a potential momentum reversal, with buyers stepping in aggressively after weeks of corrective price action. BINANCE:BTCUSDT
🔍 Technical Overview
✔️ Clean trendline breakout on H1 timeframe
✔️ Strong retest at demand zone → buyers defended perfectly
✔️ Price now trading above the trendline, indicating bullish structure
✔️ First target: $95,000 (psychological level + key resistance)
✔️ Second target: $100,000 (major psychological level)
If bullish pressure continues, liquidity grabs above these zones could fuel an extended move.
📊 Fundamental Insight
Institutional interest rises, especially around accumulation zones
ETF inflows remain positive, boosting overall sentiment
#BTC #Bitcoin #BTCUSDT #Crypto #CryptoTrading #BitcoinAnalysis #TradingSetup #Breakout #TrendlineBreakout #PriceAction #TechnicalAnalysis #Binance #CryptoMarket #Bullish
💬 Support the Idea
If you found this analysis useful,
👉 Please LIKE 👍 and COMMENT 💬
Your support helps me share more setups daily!
⚠️ Disclaimer
This analysis is for educational purposes only.
Not financial advice. Always manage risk (1–2% per trade) and follow your trading plan.

Gold trend continues today November 25th✅ 1. Trend Lines
Upper trend line (red - descending)
Connects a series of lower highs → acts as strong dynamic resistance.
Price has broken through the trend line and is retesting it → the short-term trend will turn bullish if the retest is successful.
Lower trend line (red - ascending)
Connects the upper lows → acts as dynamic support for a symmetrical triangle pattern (consolidation).
This area coincides with a Fibonacci level → strong support – confluence if the price continues to correct.
✅ 2. Key Support – Resistance
Resistance
4,210 – 4,240:
→ Key resistance – short-term bearish potential.
Breaking above the 1.618 Fibonacci level
→ Strong resistance – take-profit zone for buyers.
Support
4.105 – 4.100 (green zone):
Retest zone after breakout
Fibonacci support 0.5–0.618
→ Best buy zone if price retests.
✅ 3. Fibonacci
0.618 at 4.105: First retest → chart reaction.
On the downside, the 4.071 zone touches the trendline.
Extension 1.618 at 4.240: Maximum target if the uptrend is confirmed.
🎯 Trading Plan
BUY GOLD: 4105 – 4103
Stop Loss: 4093
Take Profit: 100 – 300 – 500 pips
SELL GOLD: 4210 – 4212
Stop Loss: 4222
Take Profit: 100 – 300 – 500 pips

Max Healthcare Showing Strength Near Support ZoneThis is the daily timeframe chart of Max Healthcare.
The stock is moving within a well-defined channel and is currently trading near the support zone at 1090–1120.
Trendline resistance is placed near the 1200 level; a breakout above this zone may lead to new highs.
If the support zone holds, we may see higher prices in Max Healthcare.
Thank you !!

Gold prepares for the US trading session1. Trendline Structure
Upper trendline (descending – red)
Connects descending highs → acts as key dynamic resistance.
Price has been tested and rejected several times → medium-term trend remains down.
Possible bullish breakout zone: 4105 – 4110.
Lower trendline (ascending – red)
Connects higher lows → key dynamic support.
Price is approaching a convergence point, indicating an imminent breakout from the contracting triangle.
2. Resistance Zone
Strong resistance: 4090 – 4110
Coincides with the descending trendline and the previous supply zone.
If a breakout occurs and consolidation occurs above 4110 → further growth potential opens up.
3. Support Zone
Support 1: 4000 – 4004
Nearest demand zone.
If broken, the breakout of the lower trendline will be confirmed, leading to a sharp decline.
Support 2: 3955 – 3965
Fibonacci extension 2.618 + key low zone.
Deep downside target.
Trading Plan
BUY GOLD: 4004 – 4002
Stop Loss: 3994
Take Profit: 100–300–500 pips
SELL GOLD: 4104 – 4106
Stop Loss: 4114
Take Profit: 100–300–500 pips

Eicher Motors – Breakout Trade SetupPrice has broken out of a 2-month consolidation range (₹6,880–₹7,200) with strong volume.
This indicates momentum continuation toward upper resistance levels.
✅ Buy Above: ₹7,200 (Breakout confirmation zone)
🎯 Targets (Swing / Short-Term):
T1 – ₹7,227
T2 – ₹7,336
T2 – ₹7,468
🛡️ Stop-Loss: ₹6,880 (below range support + 20EMA area)
⏳ Duration:
5–10 trading sessions (short-term swing trade)
📈 Reasoning (Professional View):
Breakout from a long consolidation box
Strong bullish candle + volume expansion
RSI breakout above 60 shows momentum shift
Above 20EMA after a sharp reversal
education purpose only

Gold trend in the last week of November⚔️1. Trendline
Descending Trendline (upper red line)
Acts as the main dynamic resistance.
Every retest results in rejection → the overall trend remains bearish.
The 4.150 – 4.160 zone is likely where price may retest the trendline before reversing lower.
Ascending Trendline (lower red line)
Previously the nearest dynamic support but has now been broken.
The downside breakout signals weakening momentum, favoring SELL setups.
⚔️2. Resistance Zones
Resistance 1: 4.148 – 4.150 (Fibo 0.5 – 0.618)
Confluence of Fibonacci retracement and the descending trendline.
High probability that price will retest this area and reject strongly.
Resistance 2: 4.245 – 4.250
The strongest resistance zone (Fibo 1.0).
Only reachable if a strong bullish pullback occurs.
⚔️3. Support Zones
Support 1: 3.995 – 4.000 & 4.028 – 4.030
Confluence of static support + psychological level.
A technical bounce may appear here.
Support 2: 3.890 – 3.900
The strongest support zone.
Main downside target if the price gets rejected from the upper resistance.
⚔️4. Price Scenarios
⭐️Primary Scenario (Bearish)
Price pulls back to 4.148 – 4.152, retests the descending trendline → rejection → moves down toward:
TP1: 3.995
TP2: 3.890
⭐️Alternative Scenario (Bullish)
Valid only if:
Price breaks above the descending trendline
Closes above 4.160
→ Next target: 4.250
TRADING RECOMMENDATIONS
BUY GOLD: 3890 – 3888
SL: 3878
TP: 100 – 300 – 500 pips
SELL GOLD: 4250 – 4248
SL: 4260
TP: 100 – 300 – 500 pips

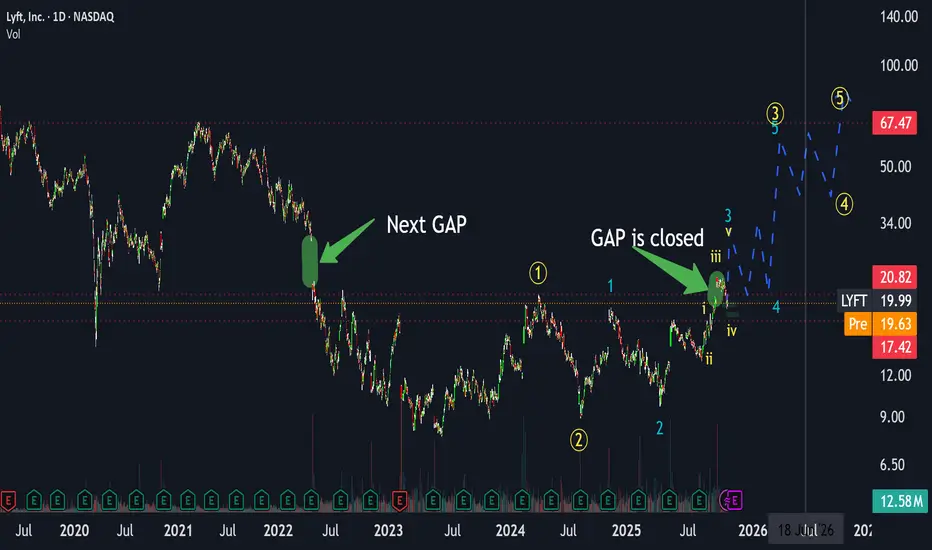
LYFT: The Hidden Gem in My October Top 3 PicksAs I’ve mentioned in my recent videos, LYFT is one of my top 3 priority stocks for October — and for good reason.
The fundamentals have exploded while the price is still lagging far behind.
🔸 Fundamentals
EPS growth has been massive .
– In March, EPS was up +128% YoY,
– and by June, it jumped to +234% YoY.
EPS has finally moved into positive territory , which is a strong signal.
Revenue continues to rise steadily, and EPS literally took off while the price hasn’t followed yet.
To put it in perspective — when LYFT traded around $60, EPS was negative .
Now, EPS is many times higher, but the stock still trades far below those levels.
Even emission has stopped increasing (we saw –0.25% in June 2025), and the forward P/E is only 15.3 ,
which is extremely low for this kind of EPS acceleration.
→ In short: LYFT looks deeply undervalued from a fundamental standpoint.
🔸 Technical Picture
Technically, LYFT has just closed a local gap , exactly as expected.
We are currently finishing the fourth sub-wave of the third global wave .
This means the fifth wave is coming next, and the current target around $70 represents only the peak of the third sub-wave — there is still additional upside expected beyond $70.
In the short term, we could see a retest around $18 ,
followed by the next major move — closing the May 2022 gap near $30 , forming the third wave of this cycle.
After that, some consolidation is likely in the $20–30 range,
followed by the next impulse targeting $50–70 .
This will be the fourth wave pullback, eventually leading into the fifth wave breakout above $70 ,
with potential for even higher upside as the global third wave continues.
Summary
Overall, LYFT shows a perfect mix of improving fundamentals and bullish technical structure.
As I’ve said in my latest videos, this stock could take off soon —
and it remains one of my Top 3 picks for October .
Call to Action
If you enjoy this type of analysis or would like me to review other tickers, tap on rocket 🚀 and leave a ticker in the comments .
I’ll make sure to cover your suggestions in upcoming posts soon!
(Full breakdown and context discussed in my recent videos — you can find them via my profile.)
Moving sideways and waiting for a breakout🔍 1. Descending Trendline (red line)
This is an important dynamic resistance.
Price has touched the descending trendline many times and been rejected → the overall trend still leans bearish.
Each retest of the trendline that fails to break gives a sell signal.
👉 Only when price closes above the descending trendline will the short-term trend have a chance to reverse.
🟦 2. Upper Resistance (light blue zone)
This is the area where the market previously made a strong reversal → strong supply zone.
If price breaks the trendline and moves toward this zone, it is a high-probability area where selling pressure may appear again.
🟩 3. Key Support (green zone)
Price has reacted many times at this support zone → strong support.
This is also where price can form a reversal pattern if buyers return.
👉 If price breaks below this support, the bearish trend will continue strongly toward the lower support zone.
🔄 4. Trading Scenarios
Scenario 1: Breakout of the descending trendline → Price moves up to resistance
Price may bounce from the current support area → move up to retest the descending trendline.
If the trendline is broken and retested successfully → target is the major resistance zone above.
For BUY:
Wait for a break & retest of the descending trendline.
BUY GOLD : 4000 - 3998
Stoploss : 3988
Take Profit : 100-300-500pips
SELL GOLD : 4130 - 4132
Stoploss : 4142
Take Profit : 100-300-500pips

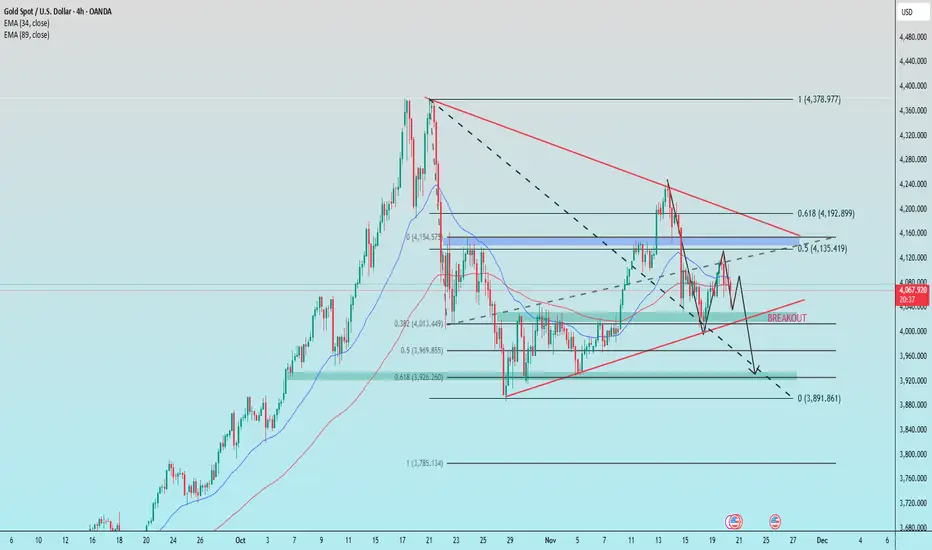
NONFARM returns after many days of closure1. Trendline
Descending trendline (upper): Strong dynamic resistance, price is repeatedly rejected → main trend remains bearish.
Ascending trendline (lower): Dynamic support, but has just been broken downward → buying pressure is weakening.
2. Key Support Levels
3,926 – 3,969 (Fibo 0.5–0.618): Strong confluence zone, the main target if the ascending trendline breaks.
3,891 (Fibo extension 1.0): Deep support, potential area for a short-term bottom.
3. Key Resistance Levels
4,135 – 4,155 (Fibo 0.5 + supply): Strongest resistance, price faced strong rejection here.
4,192 – 4,200 (Fibo 0.618): Higher resistance, aligned with the descending trendline → strong selling confluence.
Trade Ideas
BUY GOLD : 3948 – 3950
Stoploss: 3938
Take Profit: 100–300–500 pips
SELL GOLD : 4148 – 4150
Stoploss: 4160
Take Profit: 100–300–500 pips
SILVER (XAG/USD): More Growth is Coming📈SILVER is demonstrating a very bullish posture following a confirmed breakout above a minor intraday horizontal resistance.
We are observing a positive reaction after its retest.
I anticipate that the price may soon achieve the 52.35 level.

GBPJPY - BULLISH BIASSymbol - GBPJPY
GBPJPY has broken the structure of its recent local downtrend amid continued weakness in the Japanese yen. This shift opens the door for a potential continuation of the broader bullish trend.
The yen continues to lose value, while the British pound remains on an upward path. A breakout above local trend resistance is taking shape, strengthening the overall bullish market structure. The key support zone is 203.50 – 203.26 Holding steady above this zone would confirm sustained buyer momentum and could set the stage for further upside. If bulls manage to defend 203.50, the likelihood of an extended rally increases.
Resistance levels: 204.06, 205.32
Support levels: 203.52, 203.26
A strong battle between buyers and sellers is developing around the 203.50 level. Continued consolidation above 203.00 underscores the importance of this zone. The current bias favors the bulls - maintaining price action above 203.50 would support additional gains, while a break below this area could trigger a pullback toward support.

USD/CAD: Breakout Alert: 2 Strong Bullish Patterns Say YesAs you can see, 📈USDCAD is resuming its growth.
After completing a bullish accumulation, the price is currently breaking both the neckline of an ascending triangle and of an inverted head and shoulders formation on a 4H timeframe.
I anticipate that the price will continue to rise and reach the 1.4070 resistance soon.
