"FTM eyes a rebound with Sonic conversion and airdrop catalysts! Fantom (FTM) shows a recent downtrend, but the upcoming Sonic (S) conversion and the associated incentives like the free swaps and airdrop could catalyze significant price action. Here’s a detailed analysis:
Current Technical Overview:
1. Price Action:
- The price is currently trading at $0.74250, down significantly from its recent highs, but it appears to be nearing a support level.
- Historically, these levels may attract buyers looking for value or anticipating upcoming events.
2. Moving Averages:
- The yellow line represents the 50-day moving average (MA), while the red line is the 200-day MA.
- The price is below both MAs, suggesting bearish momentum in the short term. However, a catalyst like the Sonic conversion could reverse this trend if it sparks significant buying activity.
3. RSI (Relative Strength Index):
- The RSI is near 38.93, which is close to the oversold region (below 30).
- This indicates potential for a rebound, especially with the upcoming news providing a fundamental driver.
4. Volume:
- There is moderate volume, but it hasn't yet shown the surge that might accompany the January 19 event. If trading activity picks up in anticipation, this could signal increased interest.
Impact of Upcoming Events:
1. Sonic (S) Conversion:
- The free swaps for the first 90 days provide a strong incentive for current holders to stay invested and for new investors to join.
- This could reduce selling pressure on FTM while potentially driving demand.
2. Airdrop*:
- A points-based airdrop with 6% of the supply set aside can encourage accumulation of FTM to qualify, likely increasing buying pressure over the coming months.
3. Psychological and Market Sentiment:
- Such large-scale events often generate positive sentiment and FOMO (Fear of Missing Out), potentially pushing the price upwards as we approach the event.
Strategy and Outlook:
1.Short-Term:
- As the January 19 date approaches, there is a strong possibility of a price rebound if volume picks up and sentiment turns bullish.
- Traders may look for entries near the current support level with tight stop-losses in case of further downside.
2. Mid-Term:
- The incentives from the free swaps and airdrop could sustain higher interest in FTM through Q1 2025.
- Monitor for a breakout above the 50-day MA as a confirmation of trend reversal.
3. Risks:
- If the broader market remains bearish or if the events fail to meet expectations, the price could consolidate or continue its downtrend.
- Keep an eye on the volume and RSI for early signals of a move.
Key Levels to Watch:
- Support: $0.70 (current zone) and $0.60 (major support).
- Resistance: $0.95 (50-day MA) and $1.20 (recent high).
With the January 19 event on the horizon, this could be a pivotal moment for Fantom's price action. It's a good opportunity to prepare for potential volatility and capitalize on positive momentum.
Breakouttrading

FIVE STAR READY FOR BREAK RANGE BREAKOUT...NSE:FIVESTAR trade at 825 level. After break the 850 level you can watch it as a next resistance at 1000 level.

READY FOR BREAK ALL TIME HIGH...NSE:NIFTYNXT501! trade at 75250 level. It takes 4 times resistance at 75500-75800 level. After break all time resistance you can watch for more a huge upside move.

COPPER READY FOR ALL TIME HIGH...MCX:COPPER1! trade at 812 level. Chart shows that its break a trendline on daily chart. So you can watch for an upside move...

ZINC READY FOR BREAKOUT...MCX:ZINC1! trade at 270 level. Chart shows that stock ready to give a breakout on its weekly time frame. You can watch for an upside movement...

CRISIL LTD TRADE IN AN UPTREND CHANNEL...NSE:CRISIL trade at 4700 level. Stocks trade in an Uptrend Channel, So you can watch more upside move...

GUJARAT FLUOROCHEM LTD GIVE A BREAKOUT WITH BIG VOLUME...NSE:FLUOROCHEM trade at 3975 level. Stock give a breakout with big volume at 3800 level.
You can watch for an upside move at 4800-5000 level...

ASTERDM Ready for All Time High...NSE:ASTERDM trade at 405. You can watch for after brekout at 500-550 level.

Ride for break all Resisstance...NSE:WHIRLPOOL trade at 2180 level.
Support is at 2000
Resistance is at 2250
You can watch it for 2470, 2770, 3070

WAIT FOR RANGE BREAKOUT....NSE:CONCORDBIO trade at 1665 level. Support is at 1600. Resistance is at 1800.
After breakout you can watch it next resisstance at 2100.

Can Break the Supply Zone...?Godrej Industries limited face a heavy supply zone, If its break this time then its on all time high in BLUE SKY ZONE, and its next resistence is 1200-1300...

Ready for Breakout...NSE:PNBHOUSING trade @ 865. Resistence @ 950 Support @ 750.
After the Breakout you can watch it next resistence @ 1200 and 1400.

Ready for a Range Breakout...NSE:ECLERX trade at 2715. Resistence is @ 2820 & Support is @ 2320
on the daily time frame chart make a long range. After the Breakout you can watch it as a next Resistence @ 3400...

Follow The Trend or Wait for Retracement...NSE:BAJAJ_AUTO trade at 10500. Support is at 9700 and Resistance at 10600.
P/E RATIO - 36.35 Industry P/E - 23.75
On the 23rd AUG Bajaj Auto give a Breakout above 10000 level. You can wait for Retracement otherwise Follow the Trend for Next Resistance at 11200-11500.

Play for a Range Breakout...NSE:LAURUSLABS trade @ 445, Resistence is 485 & Support is 385. lauruslabs trade in range since APR/2023. You can watch for a breakout and next resistence is @ 600-625 after that its ATH @ 725.

GRAB It Before Breakout...L&T Technology Service Ltd seen a breakout above 5800. Now its trading in range upto 4800-5800. You can watch a big upside move after breakout and its next resisence is 8000-8200...

SAFARI IND SEEN A STRONG BREAKOUT...SAFARI IND Stocks give a strong breakout. You should watch for a upside swing. Next resistence is at 2800-3000...

CENTURYPLY Seen an Upside Swing Move...CENTURYPLY made a triangle pattern. and give a breakout above 750. You can watch for a Swing move. Next Resistence is at 1000...

$NASDAQ:LCID Going for the break out?Up 8% after testing lower, but holding the $3.20 support line in the previous trading day.
Upside is to ~$8/share.
Check for end of day volume for confirmation, should be relatively high volume spike.

Amazing breakout on Weekly Timeframe - JUBLFOODCheckout an amazing breakout happened in the stock in Weekly timeframe, macroscopically seen in Daily timeframe. Having a great favor that the stock might be bullish expecting a staggering returns of minimum 25% TGT. IMPORTANT BREAKOUT LEVELS ARE ALWAYS RESPECTED!
NOTE for learners: Place the breakout levels as per the chart shared and track it yourself to get amazed!!
#No complicated chart patterns
#No big big indicators
#No Excel sheet or number magics
TRADE IDEA: WAIT FOR THE STOCK TO BREAKOUT IN LOWER TIMEFRAME AND RETRACE IF NEEDED. SL IS NEARER SUPPORT ZONE IN Daily TIMEFRAME.
Checkout an amazing breakout happened in the stock in Weekly timeframe.
Breakouts happening in longer timeframe is way more powerful than the breakouts seen in Daily timeframe. You can blindly invest once the weekly candle closes above the breakout line and stay invested forever. Also these stocks breakouts are lifelong predictions, it means technically these breakouts happen giving more returns in the longer runs. Hence, even when the scrip makes a loss of 10% / 20% / 30% / 50%, the stock will regain and turn around. Once they again enter the same breakout level, they will flyyyyyyyyyyyy like a ROCKET if held in the portfolio in the longer run.
Time makes money, GREEDY & EGO will not make money.
Also, magically these breakouts tend to prove that the companies turn around and fundamentally becoming strong. Also the magic happens when more diversification is done in various sectors under various scripts with equal money invested in each N500 scripts.
The real deal is when to purchase and where to purchase the stock. That is where Breakout study comes into play.
LET'S PUMP IN SOME MONEY AND REVOLUTIONIZE THE NATION'S ECONOMY!

Amazing breakout on Weekly Timeframe - GREAVESCOTCheckout an amazing breakout happened in the stock in Weekly timeframe, macroscopically seen in Daily timeframe. Having a great favor that the stock might be bullish expecting a staggering returns of minimum 25% TGT. IMPORTANT BREAKOUT LEVELS ARE ALWAYS RESPECTED!
NOTE for learners: Place the breakout levels as per the chart shared and track it yourself to get amazed!!
#No complicated chart patterns
#No big big indicators
#No Excel sheet or number magics
TRADE IDEA: WAIT FOR THE STOCK TO BREAKOUT IN LOWER TIMEFRAME AND RETRACE IF NEEDED. SL IS NEARER SUPPORT ZONE IN Daily TIMEFRAME.
Checkout an amazing breakout happened in the stock in Weekly timeframe.
Breakouts happening in longer timeframe is way more powerful than the breakouts seen in Daily timeframe. You can blindly invest once the weekly candle closes above the breakout line and stay invested forever. Also these stocks breakouts are lifelong predictions, it means technically these breakouts happen giving more returns in the longer runs. Hence, even when the scrip makes a loss of 10% / 20% / 30% / 50%, the stock will regain and turn around. Once they again enter the same breakout level, they will flyyyyyyyyyyyy like a ROCKET if held in the portfolio in the longer run.
Time makes money, GREEDY & EGO will not make money.
Also, magically these breakouts tend to prove that the companies turn around and fundamentally becoming strong. Also the magic happens when more diversification is done in various sectors under various scripts with equal money invested in each N500 scripts.
The real deal is when to purchase and where to purchase the stock. That is where Breakout study comes into play.
LET'S PUMP IN SOME MONEY AND REVOLUTIONIZE THE NATION'S ECONOMY!

QNT Breaks Out! Is a 64% Rally on the Horizon?QNT/USDT has broken out of a descending triangle, signaling a potential bullish move. If the breakout holds, the price could target a 64% upside, as projected by the measured move.
Watch for a retest of the breakout level and triangle support for confirmation.

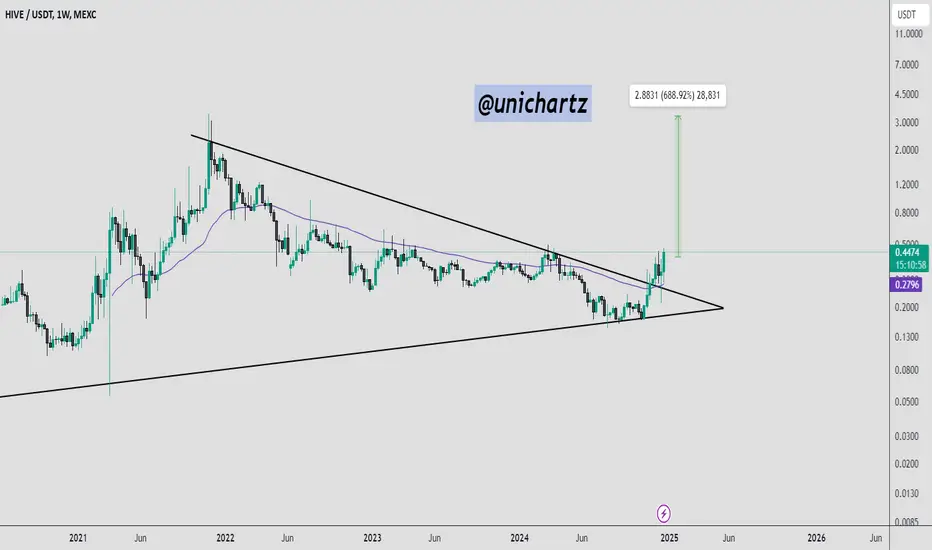
HIVE/USDT Breaks Multi-Year Triangle: Bullish Momentum Ahead?HIVE has broken out of a multi-year symmetrical triangle pattern on the weekly timeframe, with the price currently trading at $0.4456. It is now well above the 50-week EMA, which provides dynamic support around $0.28.
This breakout signals a strong bullish move, with potential resistance targets at $0.50 and $0.65. Watch for a retest of the breakout level for possible re-entry opportunities.