Breakouttrading

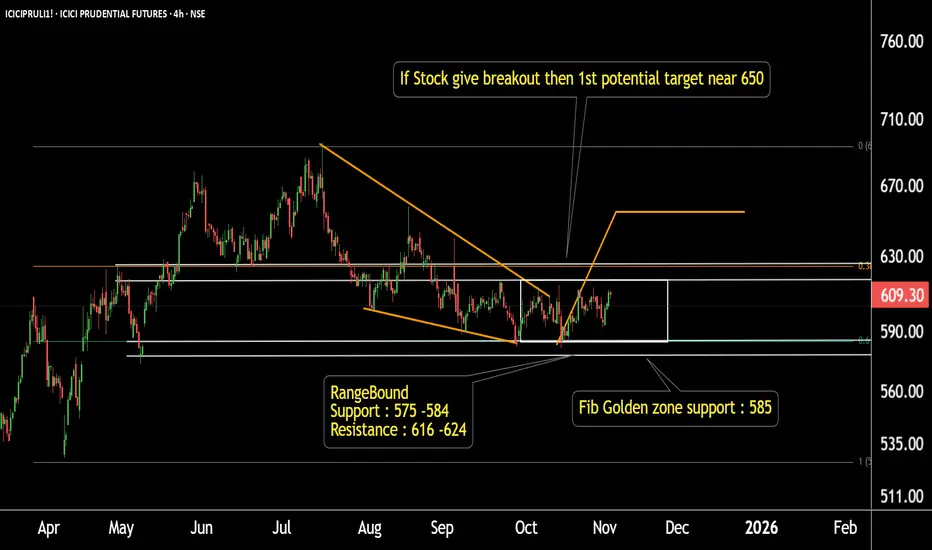
ICICI Prudential: Range-Bound Phase, Eyeing a Potential BreakoutICICI Prudential FUTURES (4-Hour Timeframe Analysis)
ICICI Prudential is currently holding a strong support zone based on Fibonacci and range-bound structure near ₹575–585.
On the upside, the stock may face resistance around ₹615–618.
If the price manages to break above this resistance zone, the next potential target could be around ₹640–650.
Thank you !!
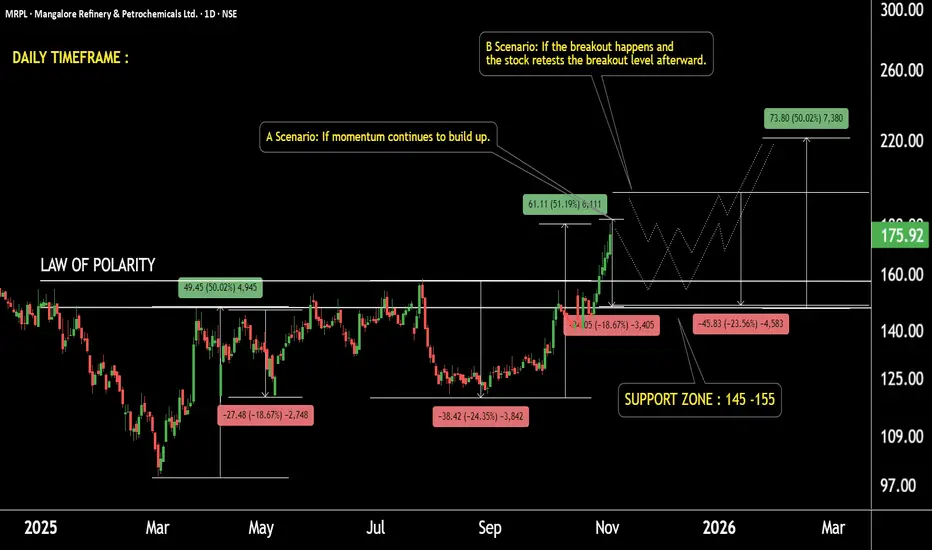
MRPL Showing Strength !! Momentum Building for Next Rally !!MRPL — Technical Overview
On the long-term timeframe, MRPL is moving within an ascending parallel channel, with a strong support zone between 120–135 and a resistance zone near 420–520.
According to the Supertrend indicator, the stock remains in a bullish phase, showing two key dynamic supports — the first around 145, and the second near 125.
On the daily timeframe, after a 50% upward move, the stock witnessed a healthy correction of around 20–24%, bringing it back toward its support area between 145–155.
This correction zone aligns with the law of polarity, where previous resistance has now turned into support.
Scenario A: If the momentum continues to build, the price may move toward higher levels directly.
Scenario B: If the breakout retests the previous breakout zone, the price may revisit 145–155 before resuming the next leg higher.
Based on this structure, the potential target for the next leg lies around 220 levels, supported by the channel resistance projection and measured move.
GOLD (XAU/USD): Bulls Eye $4,125 – Breakout Imminent?Gold dropped to a significant horizontal support level last week.
The price subsequently rebounded from this level, forming a rising triangle pattern on a 4-hour timeframe.
The neckline of this triangle is defined by an intraday horizontal resistance.
Its bullish violation (4H candle close above) can be a nice trigger to buy Gold with a confirmation.
Should this occur, a bullish continuation towards 4125 would be anticipated.
Conversely, a bearish movement and a break below the vertical support level could potentially lead to a further decline in price.

EURNZD: sellers remain in control - upside still rejectedEURNZD confirmed weakness above resistance once again. Breakout attempt failed, price returned below supply and trend line. Every bullish push is absorbed, indicating sellers still dominate. H4 structure stays bearish: failed breakout followed by BOS down, weak buyer on retest.
FVG above and supply zone remain untouched, acting as liquidity cap. Lack of momentum up and return into range support continuation toward 2.0050 and then 1.9750, where previous accumulation and liquidity cluster sit.
Plan: look for shorts on pullback into FVG with weak orderflow, targets 2.0050 and 1.9750. Bullish scenario only above 2.0230 with strong momentum and follow-through — then buy pullback toward 2.0400.
When market teases breakout but every rally dies instantly — trend continuation is still in play. Confirmation first, assumptions later.

TA / USDT : Breakout setup loading / Target $0.55 - $0.60TA / USDT is showing strength and currently testing a key resistance zone.
If price breaks out with strong momentum, we may see a bullish move toward $0.55 – $0.60.
Manage risk wisely and always wait for clear breakout confirmation before entering.
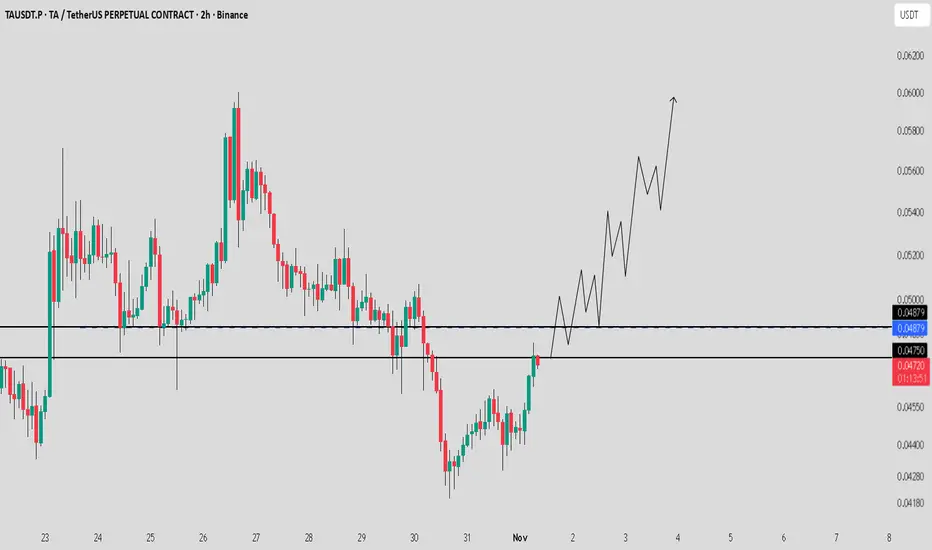
TAO / USDT gaining momentum- Eyes on $700-$750 zoneTAO is looking strong and showing good momentum for a bullish rally towards the $700 – $750 range in the coming days.
Trend structure remains positive — watch for continuation signals and manage risk wisely.

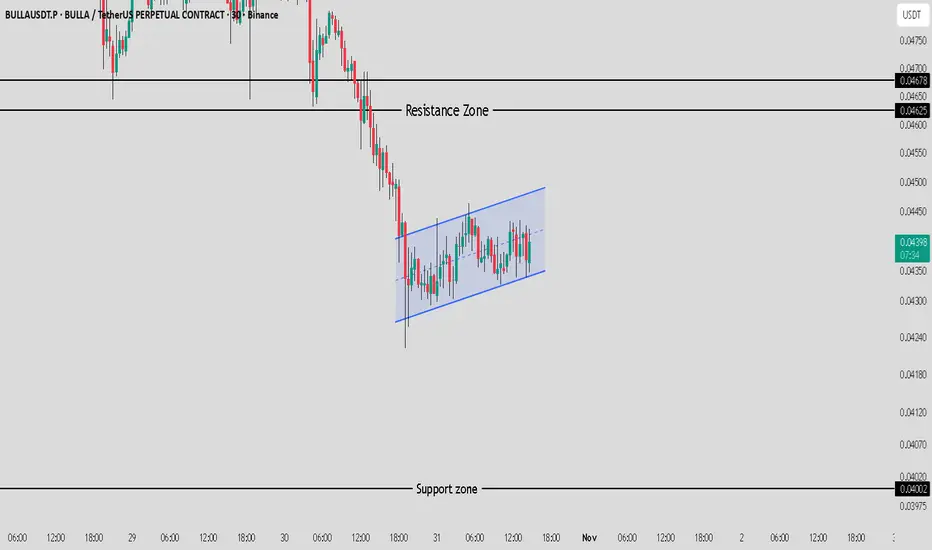
Bulla /USDT :Breakout or Breakdown imminent? Key levels to watchBulla / USDT is currently trading inside a parallel channel and we are watching for a clear breakout or breakdown from this structure.
Bullish Scenario:
If price breaks out above the channel with strength, we can expect a move towards $0.04635 – $0.04675.
Bearish Scenario:
If price breaks down from the channel, a correction towards $0.04000 is likely.
Key Note:
Always wait for confirmation before entering a trade and manage risk wisely.
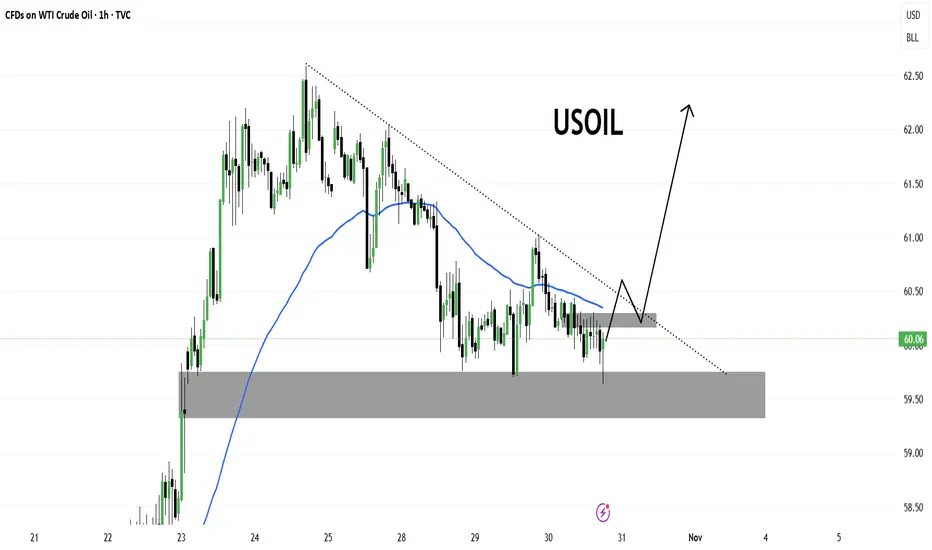
USOILCrude oil is currently trading around the $60.00 level, consolidating after a recent bearish phase. Price has respected the support zone near $59.50–59.80, forming a potential accumulation base.
A descending trendline is acting as dynamic resistance, while the 50-period moving average is flattening—indicating that bearish momentum is losing strength.
The projection suggests a possible breakout above the trendline, followed by a retest of the breakout zone before a potential rally toward the $62.00–62.50 area.
As long as the price holds above the support zone, the bullish scenario remains valid. A breakdown below $59.50 would invalidate this setup.
Breakout in ENGINERSINBreakout in ENGINERSIN.
Entry - 206
Target - 250
SL - 196
DISCLAIMER: I am not SEBI registered and the ideas posted are only for educational purpose. Do a proper analysis and always trade with STOP LOSS.

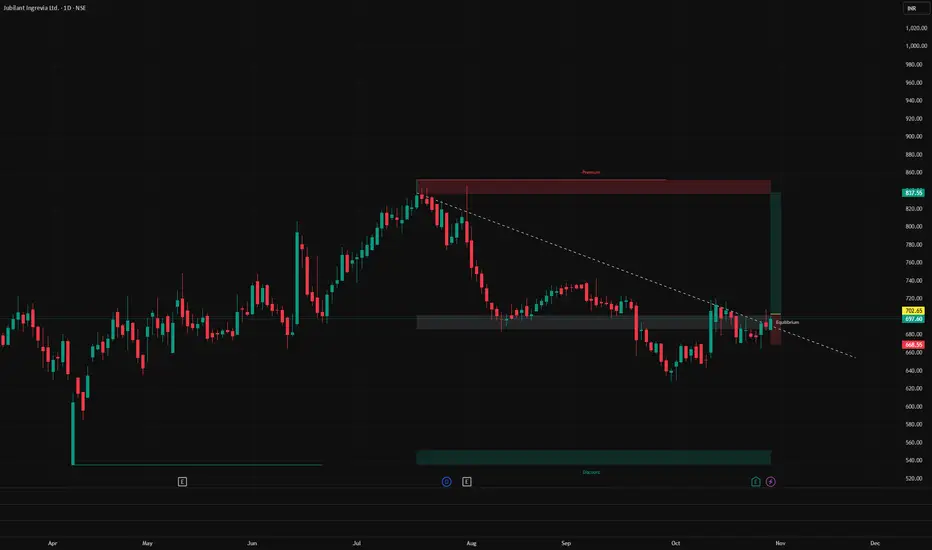
Breakout in JUBILANT INGREVIA.Breakout in JUBILANT INGREVIA.
Entry - 702
Target - 830
SL - 670
DISCLAIMER: I am not SEBI registered and the ideas posted are only for educational purpose. Do a proper analysis and always trade with STOP LOSS.
Breakout in VAIBHAV GLOBALBreakout in VAIBHAV GLOBAL.
Entry - 239
Target - 265
SL - 228
DISCLAIMER: I am not SEBI registered and the ideas posted are only for educational purpose. Do a proper analysis and always trade with STOP LOSS.

Bitcoin (BTC/USD) - Bullish Continuation from Order Block (OB)The analysis uses concepts from Technical Analysis and Smart Money Concepts (SMC), indicating a short-term bullish bias:
Recent Trend: The chart shows a recent strong upswing followed by a slight pullback. The overall movement from October 27th onwards suggests a continuation of the upward momentum.
Market Structure Shift (MSS): The price recently broke above a local swing high (near $114,500), which is often termed a Market Structure Shift (MSS) in SMC. This break confirmed that the prevailing short-term trend is upward.
Order Block (OB): The gray shaded box, labeled OB, represents an Order Block. This is a specific area where smart money (institutions) may have placed buy orders, and it is identified as a strong area of support.
The current price action shows the price has dropped back into this critical support zone (around $112,500 to $113,500).
Consequent Retracement Levels (CRT):
CRT-L (around $111,800) is the lowest level of the recent swing or the bottom of the structure being referenced for support.
CRT-H (around $116,000) is the swing high, which is also identified as the primary target for the expected bullish move.
Proposed Price Action: The primary black arrow suggests that after testing the OB support zone, the price is expected to turn sharply upward and rally back toward the high at CRT-H ($116,000). The current slight rebound from the OB supports this idea.
Interpretation and Trading Bias
The analysis has a clear bullish continuation bias. The trader is looking for long (buy) entries inside the Order Block (OB) zone, anticipating that the price will hold this institutional support and target the previous swing high at $116,000.

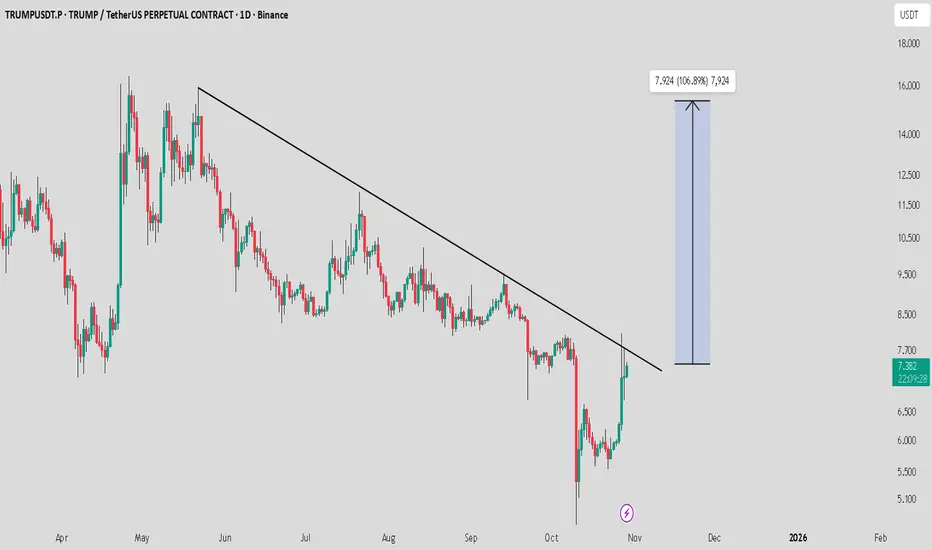
TRUMP / USDT setting up for a potential breakout moveTRUMP is looking strong for a bullish rally toward $15. Buying with lower risk may make sense at current levels.
Always manage risk wisely and wait for clear confirmation before entering.
TTD – Potential Inverse Head & Shoulders Formation in PlayA potential inverse Head & Shoulders formation appears to be developing on The Trade Desk (TTD) daily chart.
The neckline sits near 55.56.
A break and close above 55.56 could trigger the pattern, with an upside target around 67.28 based on the measured move. The target aligned with both the 50% Fibonacci retracement and the Ichimoku Senkou Span B — a key confluence area.
Invalidation lies below 48.54; a breakdown there would negate the setup.
Focus on the chart, not the headlines.
(Educational idea – not financial advice.)

Possibility of breakout in SWANCORPPossibility of breakout in SWANCORP.
Entry - 476
Target - 526
SL - 459
DISCLAIMER: I am not SEBI registered and the ideas posted are only for educational purpose. Do a proper analysis and always trade with STOP LOSS.

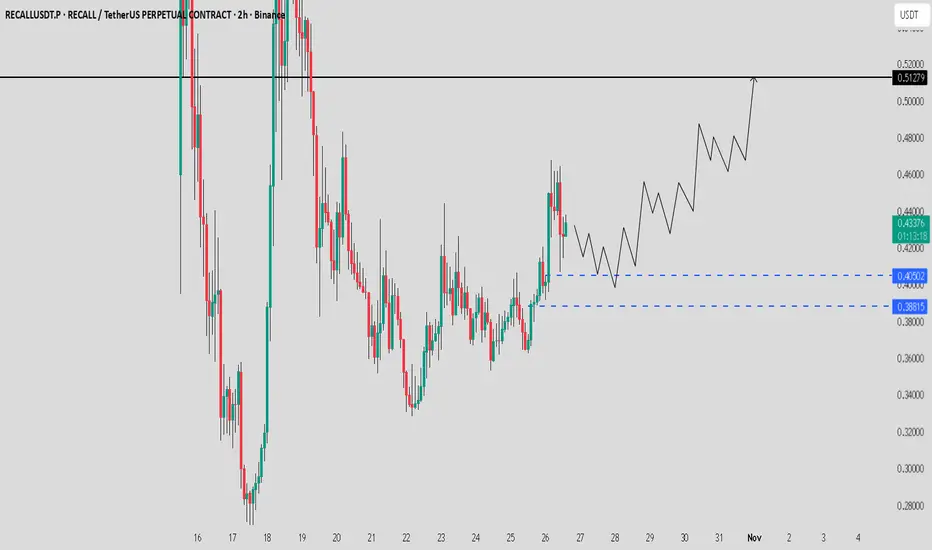
RECALL / USDT preparing for a bullish reversal towards $0.52RECALL is looking strong for a potential bullish rally towards $0.52.
Currently watching this level for a possible reversal — if we see a bullish candle with good volume, that could mark the beginning of a bullish wave towards the target.
Note: Wait for confirmation before entering.
A breakdown from this level will invalidate the setup.DYOR
ENSO / USDT approaching key breakout zone- Big move aheadCurrently watching ENSO for a potential breakout or breakdown from this symmetrical triangle formation.
Overall structure remains strong and bullish.
Bullish scenario: A breakout from the triangle could lead to a move towards $2.6 – $3.
Bearish scenario: A breakdown could trigger a correction towards $1.94 – $1.77.
Manage risk and wait for confirmation before entering any trade.

Breakout in CAMSBreakout in CAMS
Entry - 3967
Target - 4370
SL - 3870
DISCLAIMER: I am not SEBI registered and the ideas posted are only for educational purpose. Do a proper analysis and always trade with STOP LOSS.

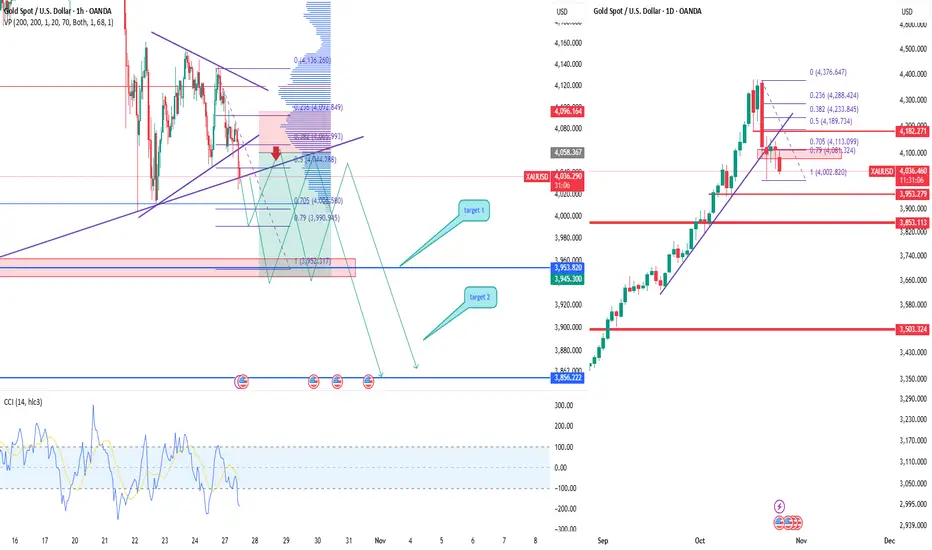
XAUUSD Gold testing support, correction possibleAfter a strong rally, gold entered a correction phase. Price broke the ascending channel and now trades around 4030–4050. The chart structure suggests a potential retest near 4070–4090 before continuation to 3960 (Target 1) and 3856 (Target 2).
CCI confirms weak buying momentum and volume profile shows high liquidity zones above current price — favoring a pullback.
Investors are taking profits after gold’s rally amid softer Fed outlook and possible dollar rebound. While long-term fundamentals stay bullish, short-term correction looks likely.
Sell setup from 4070–4090 zone with targets 3960 and 3856, stop 4110.
Valid while price remains below 4110.
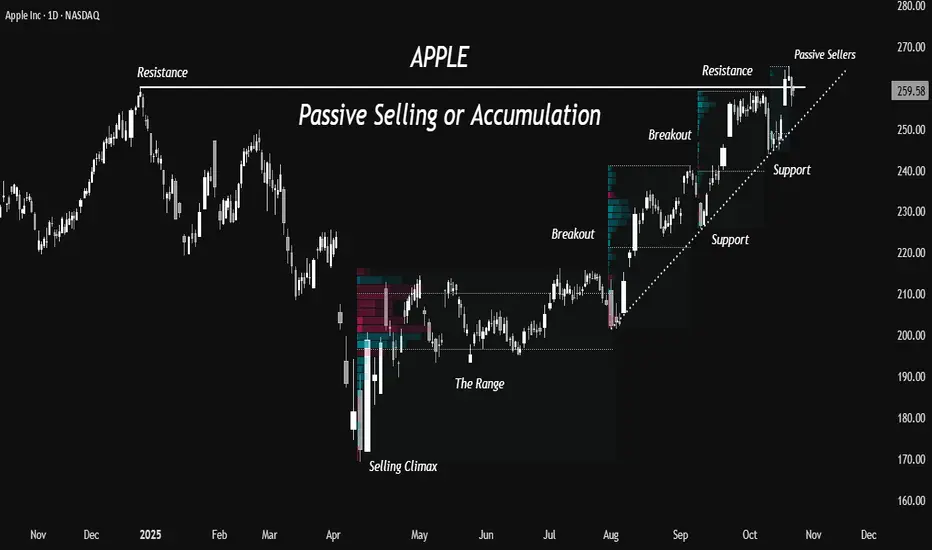
Apple- Passive Selling or More Accumulation?A Bottom and Accumulation
The stock formed a top near 260 in December 2024 and a bottom near 169 in April 2025.
After a sharp bounce of 25% from the lows in just 4 days, the stock consolidated for about 76 sessions in a range from 193 to 214- roughly a 10% range. This created a well-defined base structure, suggesting a period of accumulation.
Breakouts with Volume
The range broke out with strong volume expansion in the beginning of August, confirming a shift in market structure from accumulation to markup. Since then, the stock has maintained a steady uptrend, experiencing only brief pullbacks of about 5 to 6 percent- typical of a healthy trending phase.
Passive Selling at Highs
Currently the stock is trading near its previous highs of 260. It broke out of this resistance and then pulled back below this level. Passive selling is seen around 260 level which means sellers are stepping up, trying to absorb buyers. and the next few sessions will reveal whether this zone turns into a distribution area or simply a retest before continuation.
Trendline Buyers
Pullback buyers are watching the up trendline support which has held the previous shakeouts at two occasions (in Sep and Oct). As long as the stock sustains above this trendline, trend-following participants are likely to continue adding on dips, providing structural support to the uptrend.
Two Scenarios
A sustained move above 260, supported by strong volumes, would reaffirm bullish control and open the door for further upside momentum. Conversely, a break below the trendline could trigger long liquidation from those who bought above 260, leading to broader profit booking and a possible retracement toward 240 or even 225.
What do you think about the stock?
Will it fail the current breakout or sustain?
Do comment below 💬
#For educational purpose only, not a buy/sell recommendation.
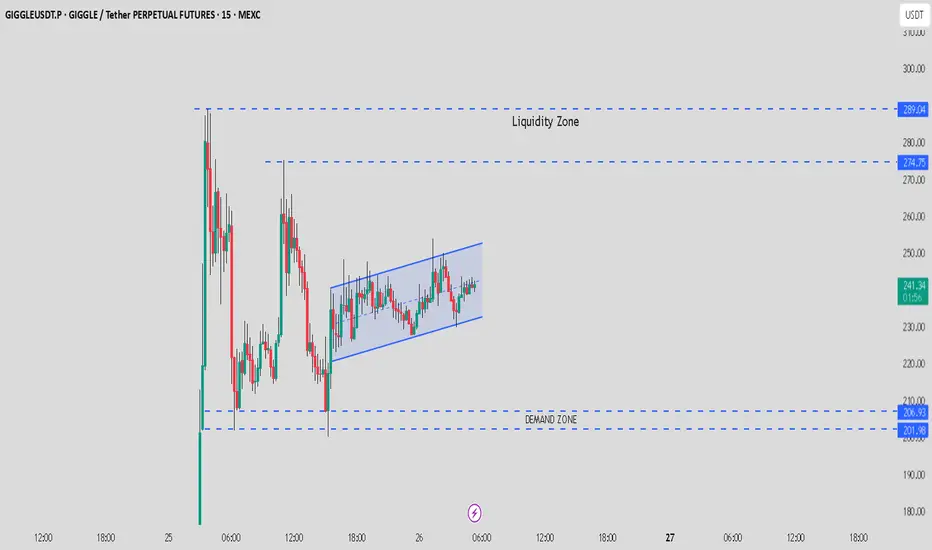
GIGGLE / USDT at decision point- Watch for breakout or breakdownGIGGLE is currently trading within a rising channel, and price action suggests a possible breakout or breakdown ahead.
Bullish Scenario: A strong breakout above the channel could lead to a rally towards $275 – $289.
Bearish Scenario: A breakdown below the channel may push price towards the demand zone at $205.
Always wait for confirmation before entering and manage risk wisely. DYOR before making any trade decisions.
ORDER / USDT gaining momentum-Watch for breakout towards $0.35ORDER is showing strong momentum and building up for a potential short-term bullish rally. A confirmed breakout above the current resistance zone could lead the price towards $0.33 – $0.35.
Momentum suggests a possible trend shift — keep a close watch and manage risk wisely.
