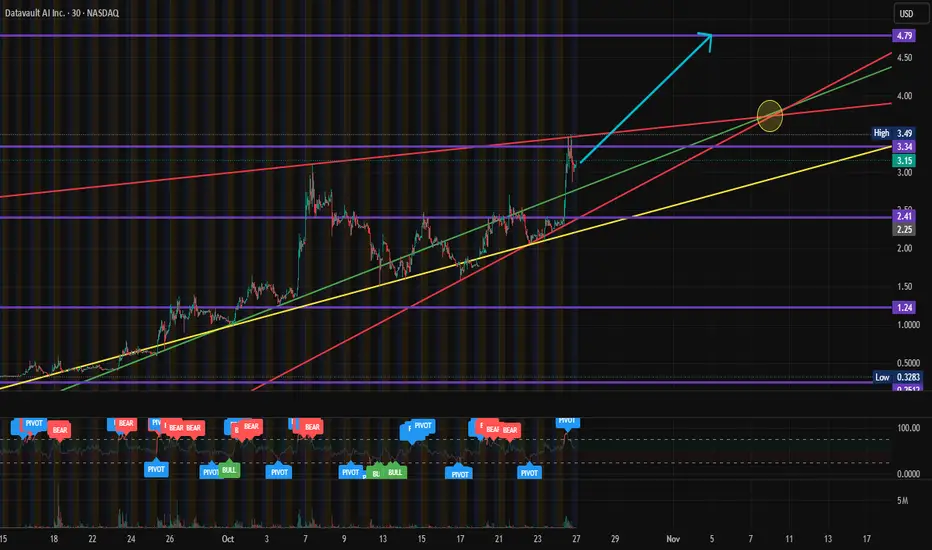
$DVLT - #DataValutAI - $3.34 Retest - $4.79 Price TargetNASDAQ:DVLT finally broke out of $2.41 and retested $3.34. We expect a continuation breakout to retest $3.34 once again, before marching to the $4.79 Levels next.
Datavault AI shares are trading higher after Wellgistics Health recently signed a non-binding letter of intent to integrate Datavault's blockchain-enabled PharmacyChain smart contract technology into its infrastructure.
Breakouttrading
GOLD on the RISE!XAUUSD moved as we analyzed. Now waiting for BreakOut from RESISTANCE to see if it will retesting and continue flying UP todsy or when markets reopen next week.

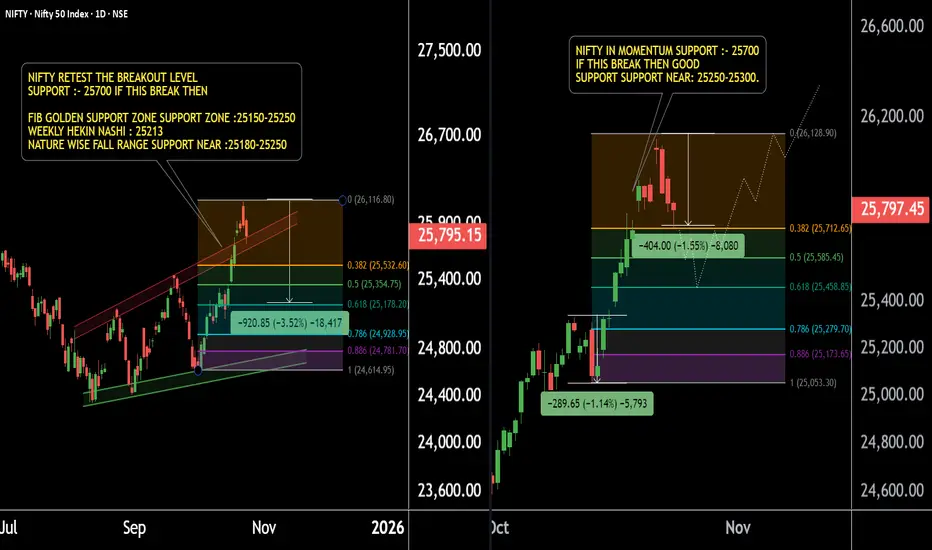
NIFTY SUPPORT LEVELS – Time to Focus for Potential ReversalNIFTY – Focus on Key Buying Levels (Daily & 4H Timeframe Analysis)
NIFTY is currently showing strong support zones for both momentum and safe buying opportunities.
Timeframe: Daily & 4H
Primary Momentum Buying Level: Around 25,700
Based on Fibonacci levels and short-term price action.
If NIFTY breaks below 25,700, we may see a further decline of 200–250 points.
Next Support Zone: 25,450–25,500 (Daily Timeframe)
Heikin Ashi Candle Support: 25,213, with a broader support range of 25,150–25,250 — confirmed by multiple price action setups.
Key Insight:
If NIFTY holds above these key supports, a reversal or bullish momentum is highly possible. Stay focused on the mentioned levels and trade with patience and discipline.
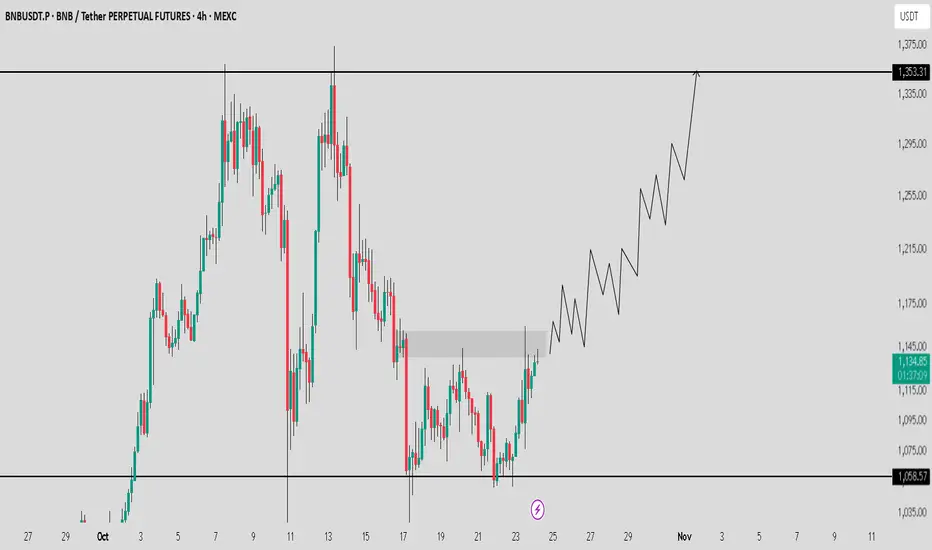
BNB / USDT Gearing up for a Bullish move towards $1350BNB is looking strong and showing solid momentum for a move towards $1300 - $1350. Once it clears the key resistance level, we can expect a bullish continuation in the coming days.
Always manage risk wisely and wait for confirmation before entering.
HYPE / USDT Breaking Out — Potential Rally Towards $50 AheadHYPE is breaking out with strong potential from its trendline resistance. Momentum is building, and if price holds above the breakout zone, we can expect a short-term rally towards $45 - $50.
Always manage risk wisely and wait for confirmation before entering.

HIMX 1D - eyes back on the screen?Himax Technologies is shaping a strong setup: after breaking above the downtrend line, the stock is now retesting the $8.70–$9.00 support zone, aligning perfectly with previous resistance and short-term EMAs. It’s a textbook breakout + retest situation.
All moving averages (MA/EMA/SMA) are below the price, confirming that buyers are in control. The bullish targets are set at $10.41 and $12.49. As long as the $8.70 level holds, the uptrend scenario stays valid.
On the fundamental side, Himax remains a key player in display driver ICs, particularly for AR/VR and automotive applications. With the growing adoption of smart displays and head-up tech, the stock could light up again.
Tactical plan: watch $8.7–9.0 carefully. If buyers hold the line - it’s showtime. If not - let the chip cool down before the next rally.

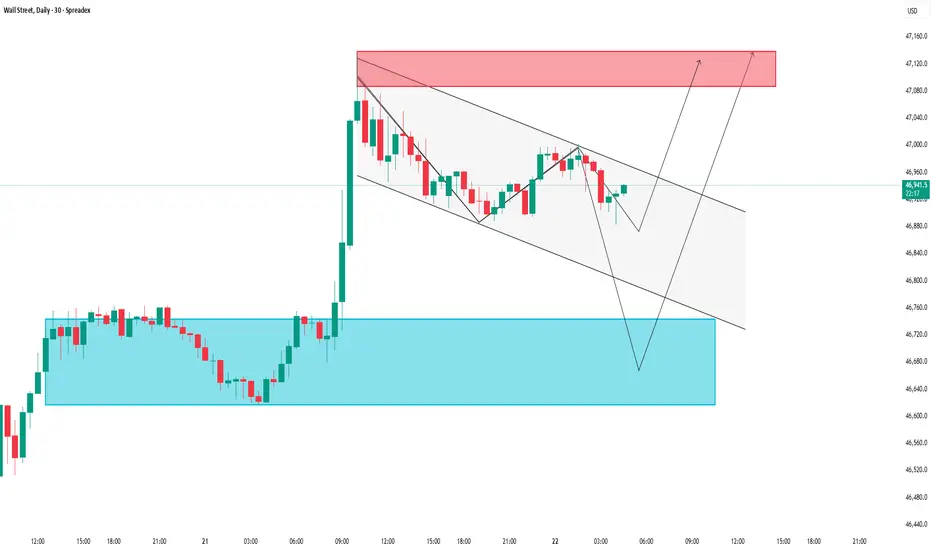
US30: Breakout or Pullback? Key zones in play
SPREADEX:DJI Technical Analysis – Price Action Scenarios Based on Supply & Demand Zones
Timeframe: 30-Minute
Chart: Wall Street Index (US30)
Source: TradingView
________________________________________
🔍 Overview
In this Wall Street index analysis, the US30 is currently consolidating within a descending price channel after a sharp bullish breakout from a key demand zone. The chart outlines potential price action scenarios based on key support and resistance levels derived from supply and demand dynamics.
________________________________________
Key Supply & Demand Zones
🔵 Demand Zone (Support Area): 46,660 – 46,720 USD
This is the deep support zone where price previously reversed sharply. It represents a high-probability buying area if retested.
🟢 Short-Term Support / Accumulation Zone: 46,880 – 46,950 USD
Price has shown multiple reactions here, indicating accumulation and temporary demand. A break below this area could lead to a move toward the lower demand zone.
🔴 Supply Zone (Resistance Area): 47,100 – 47,160 USD
This is a potential reversal zone where sellers may become active again. A breakout above this area could signal continuation of the bullish trend.
________________________________________
🧭 Technical Structure & Price Action Scenarios
The chart shows two main forecast scenarios for US30:
📉 Scenario 1: Bearish Pullback to the Lower Demand Zone
• Price gets rejected at the upper boundary of the descending channel.
• If bearish momentum continues, expect a decline toward the 46,660 – 46,720 USD zone.
• Look for bullish reversal signals such as a hammer or bullish engulfing candle before considering long positions.
📈 Scenario 2: Bullish Breakout Toward the Supply Zone
• If price sustains above 46,950 USD and breaks the descending trendline, a bullish move may be confirmed.
• Target zone: 47,100 – 47,160 USD.
• A successful breakout here could open up a continuation toward higher levels.
________________________________________
📌 Supporting Indicators
• Parabolic SAR: Dots are showing a potential shift during the retracement. Watch for dots flipping below price to support bullish continuation.
• Breakout Confirmation: The previous breakout above the 46,880 range adds weight to the current bullish outlook.
________________________________________
✅ Trading Setup Summary
Scenario Key Zone Action
📉 Pullback 46,660 – 46,720 Watch for long entry (support test)
📈 Breakout 46,950 Long toward 47,100 – 47,160
• Support Holding Above: 46,880 – 46,950 USD
• Resistance Zone to Watch: 47,100 – 47,160 USD
________________________________________
⚠️ Final Thoughts
The current structure indicates a pullback within a broader bullish context. Watch how price reacts at support zones and the descending channel. Traders should wait for clear confirmation before entering positions and maintain strict risk management.
📈 This setup is suitable for day traders and short-term swing traders looking to trade the US30 index based on clean price action and supply & demand logic.
Please like and comment below to support our traders. Your reactions will motivate us to do more analysis in the future 🙏✨
Harry Andrew @ ZuperView
EURNZD trend breakout and start of correctionEURNZD has broken below the ascending channel and confirmed the breakout under 2.0350. This indicates the start of a corrective phase. Downside targets are 2.0190, 2.0020, and 1.9860. As long as the price stays below the confirmation zone, sellers dominate the market. A return above 2.0370 would cancel the bearish outlook and restore the upward trend.
The New Zealand dollar remains supported by stable macroeconomic data and expectations that the RBNZ will maintain tight policy longer than the ECB. Meanwhile, the euro faces pressure from weak industrial performance and sluggish recovery across the eurozone. These factors favor further downside for EURNZD.
Following the breakout and confirmation, EURNZD is likely to continue its correction. As long as the price remains below 2.0350, the bias stays bearish with targets at 2.0190, 2.0020, and 1.9860.

BTCUSD Down Trend breakout bullish strong from support area🚀 #BTCUSD Technical Update 🚀
Bitcoin has broken out of the downtrend and reclaimed the key support zone around 111,100 💪
Momentum looks strong on the 1H timeframe, with buyers stepping in aggressively. 📈
🎯 Technical Targets:
1️⃣ 113,300 – Initial target
2️⃣ 116,000 – Extended target
As long as BTC holds above 111,100, the bullish bias remains intact ✅
#Bitcoin #BTC #Crypto #Trading #Breakout #TechnicalAnalysis

Amazing breakout on WEEKLY Timeframe - CIPLACheckout an amazing breakout happened in the stock in Weekly timeframe, macroscopically seen in Daily timeframe. Having a great favor that the stock might be bullish expecting a staggering returns of minimum 25% TGT. IMPORTANT BREAKOUT LEVELS ARE ALWAYS RESPECTED!
NOTE for learners: Place the breakout levels as per the chart shared and track it yourself to get amazed!!
#No complicated chart patterns
#No big big indicators
#No Excel sheet or number magics
TRADE IDEA: WAIT FOR THE STOCK TO BREAKOUT IN WEEKLY TIMEFRAME ABOVE THIS LEVEL.
Checkout an amazing breakout happened in the stock in Weekly timeframe.
Breakouts happening in longer timeframe is way more powerful than the breakouts seen in Daily timeframe. You can blindly invest once the weekly candle closes above the breakout line and stay invested forever. Also these stocks breakouts are lifelong predictions, it means technically these breakouts happen giving more returns in the longer runs. Hence, even when the scrip makes a loss of 10% / 20% / 30% / 50%, the stock will regain and turn around. Once they again enter the same breakout level, they will flyyyyyyyyyyyy like a ROCKET if held in the portfolio in the longer run.
Time makes money, GREEDY & EGO will not make money.
Also, magically these breakouts tend to prove that the companies turn around and fundamentally becoming strong. Also the magic happens when more diversification is done in various sectors under various scripts with equal money invested in each N500 scripts.
The real deal is when to purchase and where to purchase the stock. That is where Breakout study comes into play.
Check this stock which has made an all time low and high chances that it makes a "V" shaped recovery.
> Taking support at last years support or breakout level
> High chances that it reverses from this point.
> Volume dried up badly in last few months / days.
> Very high suspicion based analysis and not based on chart patterns / candle patterns deeply.
> VALUABLE STOCK AVAILABLE AT A DISCOUNTED PRICE
> OPPURTUNITY TO ACCUMULATE ADEQUATE QUANTITY
> MARKET AFTER A CORRECTION / PANIC FALL TO MAKE GOOD INVESTMENT
DISCLAIMER : This is just for educational purpose. This type of analysis is equivalent to catching a falling knife. If you are a warrior, you throw all the knives back else you will be sorrow if it hits SL. Make sure to do your analysis well. This type of analysis only suits high risks investor and whose is willing to throw all the knives above irrespective of any sectoral rotation. BE VERY CAUTIOUS AS IT IS EXTREME BOTTOM FISHING.
HOWEVER, THIS IS HOW MULTIBAGGERS ARE CAUGHT !
STOCK IS AT RIGHT PE / RIGHT EVALUATION / MORE ROAD TO GROW / CORRECTED IV / EXCELLENT BOOKS / USING MARKET CRASH AS AN OPPURTUNITY / EPS AT SKY.
LET'S PUMP IN SOME MONEY AND REVOLUTIONIZE THE NATION'S ECONOMY!

Amazing breakout on WEEKLY Timeframe - JKTYRECheckout an amazing breakout happened in the stock in Weekly timeframe, macroscopically seen in Daily timeframe. Having a great favor that the stock might be bullish expecting a staggering returns of minimum 25% TGT. IMPORTANT BREAKOUT LEVELS ARE ALWAYS RESPECTED!
NOTE for learners: Place the breakout levels as per the chart shared and track it yourself to get amazed!!
#No complicated chart patterns
#No big big indicators
#No Excel sheet or number magics
TRADE IDEA: WAIT FOR THE STOCK TO BREAKOUT IN WEEKLY TIMEFRAME ABOVE THIS LEVEL.
Checkout an amazing breakout happened in the stock in Weekly timeframe.
Breakouts happening in longer timeframe is way more powerful than the breakouts seen in Daily timeframe. You can blindly invest once the weekly candle closes above the breakout line and stay invested forever. Also these stocks breakouts are lifelong predictions, it means technically these breakouts happen giving more returns in the longer runs. Hence, even when the scrip makes a loss of 10% / 20% / 30% / 50%, the stock will regain and turn around. Once they again enter the same breakout level, they will flyyyyyyyyyyyy like a ROCKET if held in the portfolio in the longer run.
Time makes money, GREEDY & EGO will not make money.
Also, magically these breakouts tend to prove that the companies turn around and fundamentally becoming strong. Also the magic happens when more diversification is done in various sectors under various scripts with equal money invested in each N500 scripts.
The real deal is when to purchase and where to purchase the stock. That is where Breakout study comes into play.
Check this stock which has made an all time low and high chances that it makes a "V" shaped recovery.
> Taking support at last years support or breakout level
> High chances that it reverses from this point.
> Volume dried up badly in last few months / days.
> Very high suspicion based analysis and not based on chart patterns / candle patterns deeply.
> VALUABLE STOCK AVAILABLE AT A DISCOUNTED PRICE
> OPPURTUNITY TO ACCUMULATE ADEQUATE QUANTITY
> MARKET AFTER A CORRECTION / PANIC FALL TO MAKE GOOD INVESTMENT
DISCLAIMER : This is just for educational purpose. This type of analysis is equivalent to catching a falling knife. If you are a warrior, you throw all the knives back else you will be sorrow if it hits SL. Make sure to do your analysis well. This type of analysis only suits high risks investor and whose is willing to throw all the knives above irrespective of any sectoral rotation. BE VERY CAUTIOUS AS IT IS EXTREME BOTTOM FISHING.
HOWEVER, THIS IS HOW MULTIBAGGERS ARE CAUGHT !
STOCK IS AT RIGHT PE / RIGHT EVALUATION / MORE ROAD TO GROW / CORRECTED IV / EXCELLENT BOOKS / USING MARKET CRASH AS AN OPPURTUNITY / EPS AT SKY.
LET'S PUMP IN SOME MONEY AND REVOLUTIONIZE THE NATION'S ECONOMY!

Amazing breakout on WEEKLY Timeframe - PNGJLCheckout an amazing breakout happened in the stock in Weekly timeframe, macroscopically seen in Daily timeframe. Having a great favor that the stock might be bullish expecting a staggering returns of minimum 25% TGT. IMPORTANT BREAKOUT LEVELS ARE ALWAYS RESPECTED!
NOTE for learners: Place the breakout levels as per the chart shared and track it yourself to get amazed!!
#No complicated chart patterns
#No big big indicators
#No Excel sheet or number magics
TRADE IDEA: WAIT FOR THE STOCK TO BREAKOUT IN WEEKLY TIMEFRAME ABOVE THIS LEVEL.
Checkout an amazing breakout happened in the stock in Weekly timeframe.
Breakouts happening in longer timeframe is way more powerful than the breakouts seen in Daily timeframe. You can blindly invest once the weekly candle closes above the breakout line and stay invested forever. Also these stocks breakouts are lifelong predictions, it means technically these breakouts happen giving more returns in the longer runs. Hence, even when the scrip makes a loss of 10% / 20% / 30% / 50%, the stock will regain and turn around. Once they again enter the same breakout level, they will flyyyyyyyyyyyy like a ROCKET if held in the portfolio in the longer run.
Time makes money, GREEDY & EGO will not make money.
Also, magically these breakouts tend to prove that the companies turn around and fundamentally becoming strong. Also the magic happens when more diversification is done in various sectors under various scripts with equal money invested in each N500 scripts.
The real deal is when to purchase and where to purchase the stock. That is where Breakout study comes into play.
Check this stock which has made an all time low and high chances that it makes a "V" shaped recovery.
> Taking support at last years support or breakout level
> High chances that it reverses from this point.
> Volume dried up badly in last few months / days.
> Very high suspicion based analysis and not based on chart patterns / candle patterns deeply.
> VALUABLE STOCK AVAILABLE AT A DISCOUNTED PRICE
> OPPURTUNITY TO ACCUMULATE ADEQUATE QUANTITY
> MARKET AFTER A CORRECTION / PANIC FALL TO MAKE GOOD INVESTMENT
DISCLAIMER : This is just for educational purpose. This type of analysis is equivalent to catching a falling knife. If you are a warrior, you throw all the knives back else you will be sorrow if it hits SL. Make sure to do your analysis well. This type of analysis only suits high risks investor and whose is willing to throw all the knives above irrespective of any sectoral rotation. BE VERY CAUTIOUS AS IT IS EXTREME BOTTOM FISHING.
HOWEVER, THIS IS HOW MULTIBAGGERS ARE CAUGHT !
STOCK IS AT RIGHT PE / RIGHT EVALUATION / MORE ROAD TO GROW / CORRECTED IV / EXCELLENT BOOKS / USING MARKET CRASH AS AN OPPURTUNITY / EPS AT SKY.
LET'S PUMP IN SOME MONEY AND REVOLUTIONIZE THE NATION'S ECONOMY!

Amazing breakout on WEEKLY Timeframe - KARURVYSYACheckout an amazing breakout happened in the stock in Weekly timeframe, macroscopically seen in Daily timeframe. Having a great favor that the stock might be bullish expecting a staggering returns of minimum 25% TGT. IMPORTANT BREAKOUT LEVELS ARE ALWAYS RESPECTED!
NOTE for learners: Place the breakout levels as per the chart shared and track it yourself to get amazed!!
#No complicated chart patterns
#No big big indicators
#No Excel sheet or number magics
TRADE IDEA: WAIT FOR THE STOCK TO BREAKOUT IN WEEKLY TIMEFRAME ABOVE THIS LEVEL.
Checkout an amazing breakout happened in the stock in Weekly timeframe.
Breakouts happening in longer timeframe is way more powerful than the breakouts seen in Daily timeframe. You can blindly invest once the weekly candle closes above the breakout line and stay invested forever. Also these stocks breakouts are lifelong predictions, it means technically these breakouts happen giving more returns in the longer runs. Hence, even when the scrip makes a loss of 10% / 20% / 30% / 50%, the stock will regain and turn around. Once they again enter the same breakout level, they will flyyyyyyyyyyyy like a ROCKET if held in the portfolio in the longer run.
Time makes money, GREEDY & EGO will not make money.
Also, magically these breakouts tend to prove that the companies turn around and fundamentally becoming strong. Also the magic happens when more diversification is done in various sectors under various scripts with equal money invested in each N500 scripts.
The real deal is when to purchase and where to purchase the stock. That is where Breakout study comes into play.
Check this stock which has made an all time low and high chances that it makes a "V" shaped recovery.
> Taking support at last years support or breakout level
> High chances that it reverses from this point.
> Volume dried up badly in last few months / days.
> Very high suspicion based analysis and not based on chart patterns / candle patterns deeply.
> VALUABLE STOCK AVAILABLE AT A DISCOUNTED PRICE
> OPPURTUNITY TO ACCUMULATE ADEQUATE QUANTITY
> MARKET AFTER A CORRECTION / PANIC FALL TO MAKE GOOD INVESTMENT
DISCLAIMER : This is just for educational purpose. This type of analysis is equivalent to catching a falling knife. If you are a warrior, you throw all the knives back else you will be sorrow if it hits SL. Make sure to do your analysis well. This type of analysis only suits high risks investor and whose is willing to throw all the knives above irrespective of any sectoral rotation. BE VERY CAUTIOUS AS IT IS EXTREME BOTTOM FISHING.
HOWEVER, THIS IS HOW MULTIBAGGERS ARE CAUGHT !
STOCK IS AT RIGHT PE / RIGHT EVALUATION / MORE ROAD TO GROW / CORRECTED IV / EXCELLENT BOOKS / USING MARKET CRASH AS AN OPPURTUNITY / EPS AT SKY.
LET'S PUMP IN SOME MONEY AND REVOLUTIONIZE THE NATION'S ECONOMY!

$REPL - Replimune Group - $6.42 Consolidation Re-Entry? $12.50PTNASDAQ:REPL broke out of a long term Descending Wedge it's been trading in since the beginning of Feb 2025, breaking out to $8.36. It wasn't able to find support on the $8.13 and if it can't hold the $7.72, we will be looking for a re-entry into the trade around the $6.42 Levels of Support for a potential $8.13 RT/Break providing a $12.50 PT if we break through the $10.39s.

MUBARAK/ USDT attempting Breakout_Need confirmation for rallyMUBARAK is currently breaking out from its trendline resistance with strong potential. A successful breakout and hold above this level could trigger a short-term bullish move.
Always wait for confirmation before entering and manage risk wisely.

Bharti Airtel on Fire — Strong Momentum Ahead!Bharti Airtel – Momentum Trade Update
On the weekly timeframe, the stock is sustaining above its Law of Polarity (LOP) level, indicating underlying strength. It is likely to move toward the upper boundary of the channel, placed around the ₹2100–₹2120 zone.
On the daily timeframe, Bharti Airtel is trading within a well-defined parallel channel and has recently given a breakout above the middle boundary. The price action now suggests a potential move toward the upper boundary of the channel, positioned near ₹2100–₹2110.
If this momentum continues, we may see further upside in the coming sessions.
Thank you.

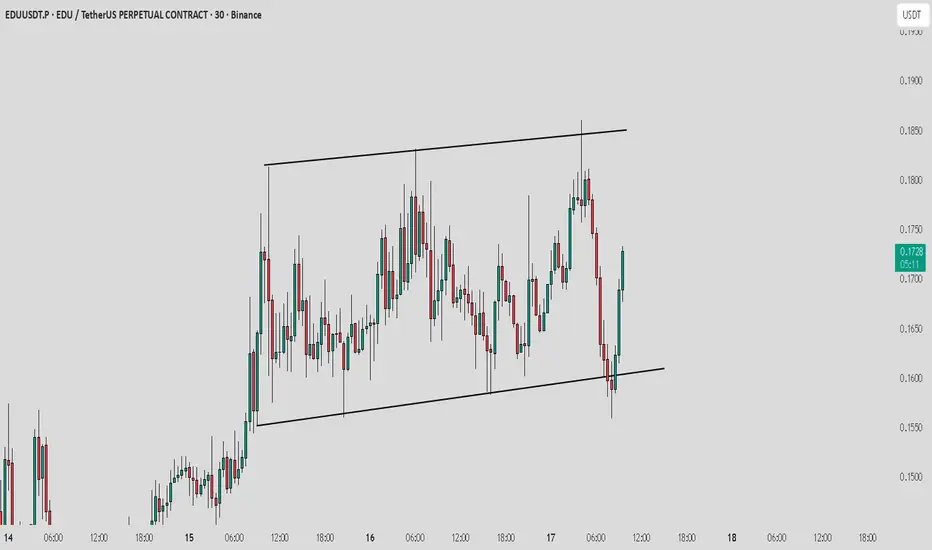
EDU /USDT consolidating in range_Watch for breakout or breakdownEDU is currently trading within a clear horizontal range. After rebounding strongly from the lower support zone, price is now moving upward toward the range resistance.
Bullish Scenario: If EDU breaks and holds above the upper boundary, it could trigger a breakout rally.
Bearish Scenario: A rejection from resistance may lead to another retest of the range support.
Always wait for confirmation before entering and manage risk wisely.
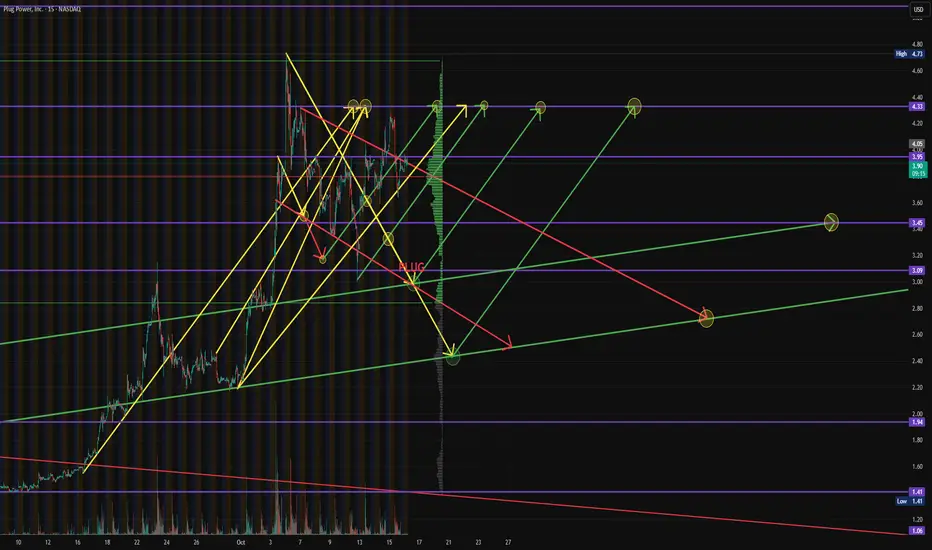
$PLUG - Plug Power - $4.33 RetestNASDAQ:PLUG is currently tracking along one of our potential breakouts to recheck the $4.33 Level of Resistance, but we need to break and hold above that $3.95 Level first. If not, consolidation.
KGEN / USDT : Looking strong for a nice bullish moveKGEN is showing strong bullish momentum and looks ready for a potential 40–50% rally in the short term.
Keep a close watch and manage risk wisely — wait for confirmation before entering.

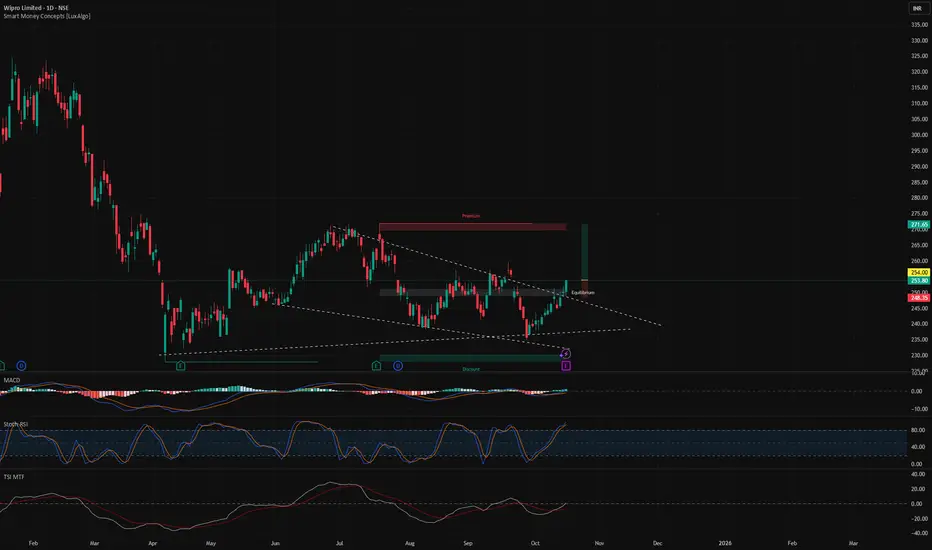
Breakout in WIPROBreakout in WIPRO.
Entry - 254
Targets - 270, 285 & 310
SL - 248
DISCLAIMER: I am not SEBI registered and the ideas posted are only for educational purpose. Do a proper analysis and always trade with STOP LOSS.
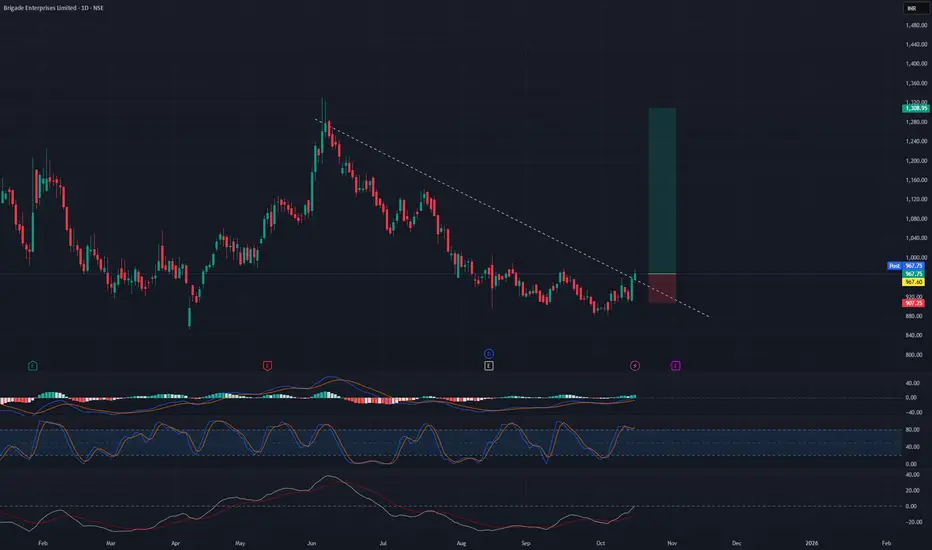
Breakout trading in BRIGADESwing trading opportunity in BRIGADE.
Entry - 970
Targets - 1130 & 1300
SL - 904
DISCLAIMER: I am not SEBI registered and the ideas posted are only for educational purpose. Do a proper analysis and always trade with STOP LOSS.
US100: Breakout signals a strong second bullish leg🧩 Market Context
On the 30-minute chart, SKILLING:US100 index shows renewed bullish momentum after a phase of sideways consolidation. Following a deep correction, price action has started forming higher highs and higher lows, suggesting that buyers are gradually regaining control.
🔍 Price Structure and Breakout
Price has recently broken out above a short-term consolidation zone and a rising trendline.
This breakout reinforces the short-term bullish bias and could mark the start of a second upward leg in the current recovery.
Statistically, when a breakout happens after tight accumulation, the next bullish leg often becomes equal to or larger than the previous one, as momentum builds and buyers gain confidence.
📈 Key Price Levels
• Resistance 1: 24,914 – prior rejection zone in the last upward move.
• Resistance 2: 25,074 – distribution area before the previous drop.
• Support: 24,700 – 24,750 (former resistance now acting as potential support).
⚙️ Trading Scenarios (for observation only)
• After the breakout, price may retest the previous resistance zone (around 24,700–24,750) before continuing higher.
• If buyers defend this level, the second bullish leg could extend toward 24,914 and possibly 25,074.
• Conversely, a close back below 24,700 may trigger a deeper pullback before any continuation attempt.
🧠 Summary
The technical structure on US100 favors a short-term bullish outlook. A successful retest of the breakout zone could pave the way for a second upward leg, potentially matching or exceeding the size of the previous rally.
______________________________________
📌 This analysis is for educational and technical purposes only. It does not constitute financial advice or a recommendation to buy or sell any asset.
Please like and comment below to support our traders. Your reactions will motivate us to do more analysis in the future 🙏✨
Harry Andrew @ ZuperView

Nzd/Usd - Breakout SetupMarked in red, located around the 0.57300 area. Price has tested this zone multiple times but failed to break above — indicating strong selling pressure.
Support Zone (S):
Marked in blue, around the 0.57100–0.57150 range. This zone has acted as a strong bounce area where buyers stepped in.
Scenarios:
Bullish Scenario:
If price holds above the Support (S) zone and breaks through the Resistance (R) zone with strong volume or bullish momentum...
Target: A move toward the next higher structure (likely around 0.57400+), as indicated by the top-right upward arrow.
Bearish Scenario:
If price fails to maintain above the Support (S) zone and breaks below it with strong bearish candles...
Target: A move downward to the next key demand area (likely around 0.56800), indicated by the bottom-right downward arrow and U.S. economic icon.
Trade Plan Considerations:
Wait for confirmation breakout of either the support or resistance zone.
Use volume or candlestick confirmation for entry.
Risk management: Place stop-loss just outside the zone boundaries (above R or below S).
Be cautious of news impact, as suggested by the U.S. economic icon — upcoming USD-related data could cause volatility.
