XAUUSD Bullish Flag Breakout – $4,300 Target in SightGold (XAU/USD) continues its strong bullish momentum in 2025, and the current price structure reveals a classic bullish flag pattern on the daily chart, suggesting further upside. This setup presents a potential continuation of the prevailing uptrend, possibly leading to new all-time highs in the coming months.
🟢 1. Clear Bullish Trend Foundation
Gold has been in a strong uptrend since late 2024, supported by:
Global inflationary pressures.
Geopolitical instability.
Central bank gold purchases and dollar weakness.
This uptrend is visually supported by a well-defined rising structure, with higher highs and higher lows.
📐 2. Bullish Flag Pattern Formation
The current price action has formed a bullish flag, a bullish continuation pattern that appears after a sharp rally. The flag represents a period of consolidation or pullback before the next impulsive move up.
The flagpole is the sharp rally that took place from mid-February to April 2025.
The flag itself is a downward-sloping channel or wedge, indicating temporary profit-taking or market indecision.
Volume typically decreases during the flag formation, then surges on breakout—confirming trend continuation.
This pattern is now showing signs of a breakout to the upside, suggesting the bulls are regaining control.
🔍 3. Key Technical Levels
🔹 Major Resistance Zone (~3,500–3,600):
This zone has acted as a supply region in the past.
Price is now testing this level and attempting a breakout.
A successful retest of this zone as new support will confirm the breakout.
🎯 Projected Target: $4,300+
Measured move target based on the flagpole’s height.
Clean projection points to the 4,300–4,350 area as the next major upside objective.
🛑 Support & Stop-Loss :
Strong support exists around $3,125, aligning with the flag base.
This area is a logical stop-loss zone for traders entering on the breakout.
🔁 4. Expected Price Behavior
Breakout: Price is expected to break above the flag resistance and the horizontal supply zone.
Retest Phase: A pullback toward the breakout zone (~3,600) could occur before the next impulsive move. This would offer a prime buy-on-dip opportunity.
Final Impulse: A sharp rally could follow, targeting the 4,300+ region.
💡 5. Trading Psychology Behind the Setup
During the flag formation, short-term traders take profit, and new buyers hesitate due to perceived overbought conditions.
However, the overall market sentiment remains bullish, with larger players accumulating during dips.
Once the resistance breaks, fear of missing out (FOMO) often drives prices sharply higher.
⚠️ 6. Risk Factors to Watch
Sudden USD strength or rising real yields.
Geopolitical de-escalation that reduces safe-haven demand.
FOMC rate surprises or unexpected hawkish policy shifts.
✅ Conclusion: Bullish Breakout Setup in Play
Gold is poised for another leg up after completing a textbook bullish flag pattern. With macroeconomic tailwinds and a solid technical base, this setup offers a high-probability long opportunity targeting the $4,300 zone. Watch for a confirmed breakout and possible retest to load long positions with solid risk-reward.
Breakouttrading

Higher High Higher Low intact!BFBIO Closed at 185.09 (25-05-2025)
Important to Cross & Sustain 188 - 189
o Monthly basis; only then it may move towards
215+
On the flip side, Important Support seems to be
around 164 - 169 and then 156 - 157

Momentum Trade in Dam Capital1. Resistance breakout
2. Positive Divergence on RSI
3. Volume pop up
4. MACD signal turning green
5. RSI near 70

HDFC BANK ANALYSIS – 1H TIMEFRAMENSE:HDFCBANK
Symmetrical Triangle Pattern Forming
A breakout or breakdown is likely soon. Price is consolidating within the triangle range.
HDFC BANK ANALYSIS ON 1 HOUR TIME FRAME
IMPORTANT LEVELS TO WATCH:
Resistance: 1941 – 1958 – 1970
Support: 1913 – 1898 – 1885
📌 Chart Pattern: Price is forming a symmetrical triangle which indicates a potential breakout or breakdown.
A breakout above 1941.75 (purple line) can trigger a bullish move.
A breakdown below 1913.25 (purple line) can attract sellers.
📌 Wait for a breakout confirmation before entering a trade.
👉🏻 @thetradeforecast

Gold - This is still clearly not over!Gold - TVC:GOLD - just needs a moment to breathe:
(click chart above to see the in depth analysis👆🏻)
It is just incredible how Gold has been rallying lately. Just over the past 1.5 years, Gold is up another +80% and is creating new all time highs every month. Since these strong rallies continue a lot longer than most people think, Gold still has significant upside potential.
Levels to watch: $3.500, $4.000
Keep your long term vision!
Philip (BasicTrading)

Is this a platinum breakout?Using a weekly chart of a platinum ETF.
Breaking out above it's triangle pattern. Needs confirmation though or retrace in the next coming months

Amara Raja Energy & Mobility Limited Trend Reversal On ChartAmara Raja Energy & Mobility Limited, a flagship company of the group, is India’s largest manufacturer of automotive and industrial batteries. The company also produces Li-ion cells and battery packs for electric vehicles and the telecom industry.
At current price it looks very attractive for short term gains .
Short term target may show Up move to 1100 levels and initial support at 996
long term target intact 1700-1860 levels.

Bitcoin - All time highs will come next!Bitcoin - CRYPTO:BTCUSD - prepares a significant move:
(click chart above to see the in depth analysis👆🏻)
Over the past couple of months, we basically only saw sideways price action on Bitcoin. However, this does not mean, that Bitcoin is now slowing down; actually the opposite is true and Bitcoin is setting up for a major move higher. New all time highs will come very soon.
Levels to watch: $100.000
Keep your long term vision!
Philip (BasicTrading)

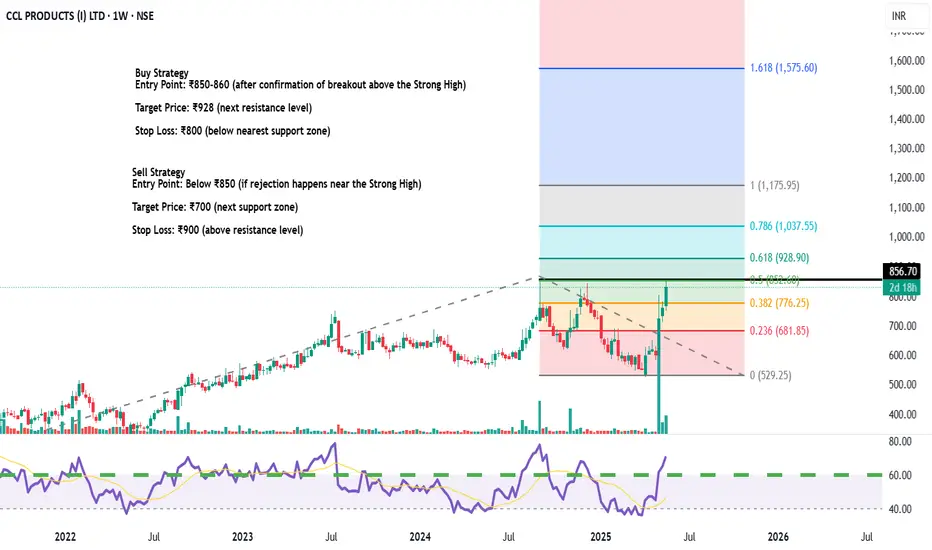
Massive Move Incoming? CCL PRODUCTS LTD Price Prediction!Trade Recommendation
Buy Strategy
Entry Point: ₹850-860 (after confirmation of breakout above the Strong High)
Target Price: ₹928 (next resistance level)
Stop Loss: ₹800 (below nearest support zone)
Sell Strategy
Entry Point: Below ₹850 (if rejection happens near the Strong High)
Target Price: ₹700 (next support zone)
Stop Loss: ₹900 (above resistance level)
Technical Observations
Resistance Zones: ₹900
Support Zones: ₹700
RSI: Check for overbought or oversold levels to confirm entry
HH HL expected
Closed at 181.77 (20-05-2025)
Bullish divergence on DTF.
Breakout Done.
Currently at Resistance level.
Important to Sustain this level for
further upside towards 187 - 190
Important Support for now is around
175 - 176 & then around 168.50

Breakout Done
Closed at 174 (20-05-2025)
Breakout done.
Weekly closing above 169 would
be a positive sign.
It may retrace up till 168 & then
may be around 158 / 150
Upside resistance is around 189 - 190
& then around 220.

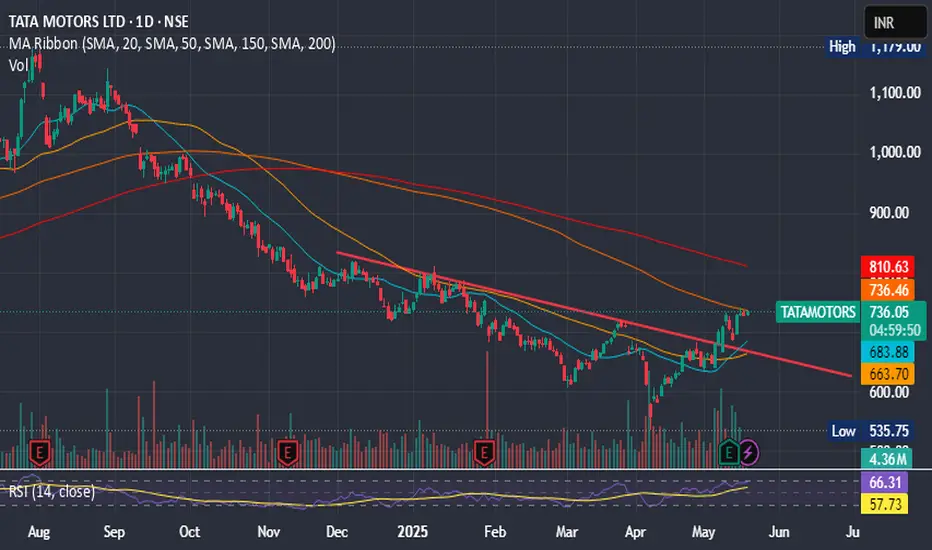
TATA MOTORS IGNITING MOMENTUM - Pivot Points: The classic pivot point is 731.45, with resistance levels at 733.4, 736.3, and 738.25, and support levels at 728.55, 726.6, and 723.7
Tata Motors' short-term trend appears bullish, with analysts predicting an upside target of ₹770–780 in the coming weeks. The stock has shown strong resilience near its support level of ₹715 and is trading above key short-term moving averages, signaling strength.
Key Levels:
- Support: 715–720
- Resistance: 735–740
- Target: 770–780 OR MORE TOWARDS 823
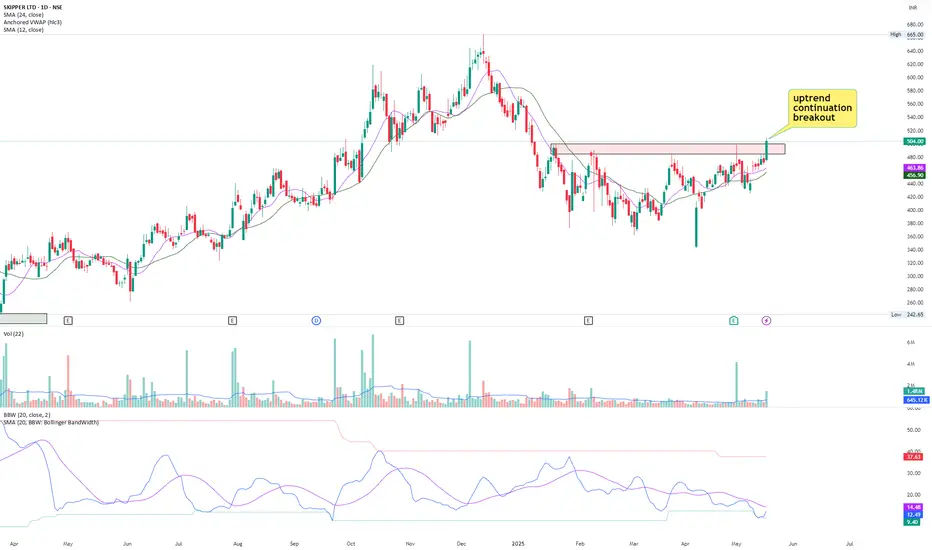
Breakout in SkipperStock has broken out of range of 4 months in long term uptrend with high relative volume.
Fundamentally, stock has delivered double digit earnings growth for straight 4 quarters.
Margins have also been increasing for last 3 quarters.
Overall, it's a good technofunda pick to watch out for.
DHANI SERVICES MAY GIVE BREAKOUT SOONDhani Services is an Indian consumer business that operates through its app, Dhani. It provides a range of services, including digital healthcare, financial services, e-commerce, UPI payments, stock trading, and bill payments. The company was originally founded as Indiabulls Ventures Limited in 1995 but was later renamed Dhani Services Limited in October 2020.
SHORT TERM MAY TOUCH 69 TO 72 MARK.

Cup and Handle Breakout | Strong Trend Reversal in PlayNSE:PREMEXPLN
Analysis:
This chart showcases a classic "Cup and Handle" breakout pattern — a powerful bullish reversal setup. After a prolonged downtrend, the stock formed a rounded base, retested the neckline zone near ₹500, and broke out with strong momentum and volume.
Trendline Breakout: A long-term descending trendline has been broken, signaling a trend reversal.
Cup Formation: A smooth, rounded bottom formed over several months indicates accumulation and base-building.
Breakout Confirmation: A sharp breakout above the neckline resistance (around ₹500–₹510) with volume confirms the breakout.
Target Levels: Price has already moved toward ₹606 and is now approaching ₹678 — the measured move target from the depth of the cup.
Trade Setup:
Entry: Ideal entry was near breakout of ₹510.
Targets: ₹606 (hit), ₹678 (approaching).
Stop-loss: Below ₹500 or trailing below recent swing lows for momentum trades.
Outlook:
The chart signals a strong reversal and momentum continuation. If ₹678 is broken, further upside potential opens up.
HAPPY TRADING !!

Bullish Divergence appeared on bigger tf.Bullish Divergence appeared on bigger tf.
Sustaining 33 on monthly basis would be
a positive sign.
36 is the Breakout level.
Immediate targes can be around 43 - 45
If 32 is not sustained on Monthly basis,
we may see further selling pressure towards
25 - 27

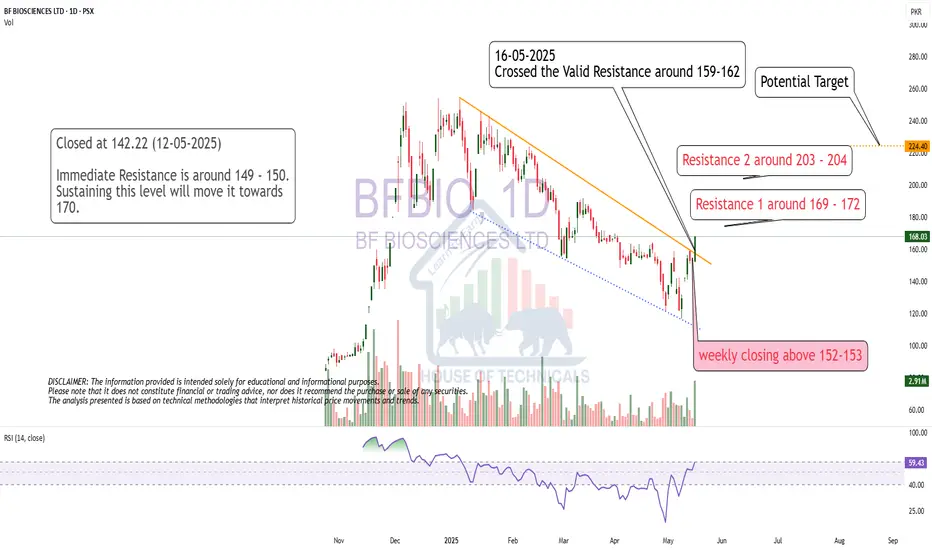
Breakout
Crossed the Valid Resistance around 159-162
Potential target is 220+
However mid resistances are there also.
Maruti Suzuki Chart Breakout Watch | Ascending Triangle PatternNSE:MARUTI
Maruti Suzuki is currently forming a bullish ascending triangle pattern on the 1-hour chart, indicating potential for an upside breakout.
1. Pattern Formation: The price is making higher lows while facing horizontal resistance near the 12,700 zone — forming a classic ascending triangle.
2. Support Zone: Trendline support is holding well, currently near 12,550.
3. Breakout Levels: A confirmed breakout above 12,700 could trigger a sharp move toward the next resistances at 12,888, 13,075, and possibly 13,454.
4. Bullish: Post-breakout, price action is expected to retest and then rally — as shown by the projection arrows on the chart.
5. Volume Confirmation : Watch for volume expansion on breakout to confirm strength.
Trading Plan:
Buy on Breakout : Enter long above 12,700 with targets of 12,888 - 13,075 - 13,454. Use SL below 12,550.
Wait-and-Watch : If price fails to break out, stock may stay range-bound or retest trendline support.
Conclusion:
Price action suggests strength building up. A breakout from this pattern could lead to a fresh rally — ideal setup for short-term swing trades

Tata Power is showing strengthTata Power's technical indicators suggest a strong buy signal based on moving averages and oscillators. Here’s a quick breakdown:
- Relative Strength Index (RSI): 65.04 (indicating bullish momentum)
- MACD: 3.38 (positive crossover, signaling upward trend)
- Moving Averages: All major SMAs and EMAs indicate a buy
- Pivot Points: Key support at ₹388.64, resistance at ₹398.69
Close Above 400 mark will be positive
- Short-Term Forecast: Technical analysis suggests support around ₹390 and resistance near ₹626, with a potential price target of ₹417.23 in the next two weeks.

ENDURANCE – Breakout from Supply Zone | Target ₹2136 ⚙️ ENDURANCE TECH LTD (NSE:ENDURANCE)
Time Frame: 15min / 1 Hour
📊 Trade Type: Positional / Intraday Momentum
📌 Buy Zone: ₹2042 (Above supply zone breakout)
🎯 Target 1: ₹2136
🎯 Target 2: ₹2287
🛑 Stop Loss: ₹1915
📈 CMP: ₹2022.60
📌 Chart Insights:
✅ Strong volume breakout from horizontal resistance
✅ Cleared EMA 9/13/26 crossover
✅ RSI > 60 indicates bullish momentum
✅ Bollinger Band breakout (BB %B > 1.00)
✅ Breaking above pivot R2 zone (₹2042) opens room to R3
⚠️ Strategy:
Enter on confirmation above ₹2042 with volume support on 15min or 1H timeframe.
Stop loss below breakout candle or EMA cluster around ₹1915.
Trailing stop as it approaches targets.
For Education Purposes Only

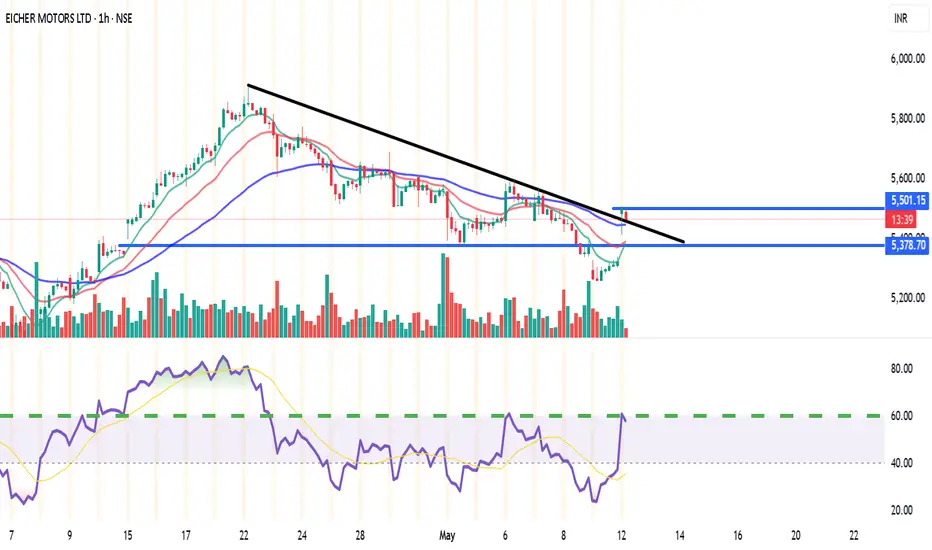
EICHERMOT (NSE) – Bullish Setup on 15min & 1H🔑 Trade Plan:
📥 Buy Above: ₹5485 (above current resistance & candle body highs)
🎯 Targets:
T1: ₹5527 (Pivot R1)
T2: ₹5555
🛡️ Stop Loss: ₹5380 (below 13 EMA & Supertrend support)
📊 Technical Signals:
RSI: 58.08 – Bullish momentum, still room to run
%B (BB): 0.77 – Close to breakout from upper band
EMA Crossover: 9 EMA > 13 EMA – Short-term bullish crossover confirmed
Supertrend: Support at ₹5322, aligning with bullish reversal
Volume: Spike during recent green candles signals strong buying interest
⚙️ Strategy Notes:
Use 15min chart for entry timing post breakout
Tighten SL to cost after T1 hits
Ideal for short-term intraday/swing traders
For Education Purposes Only
at the verge of Breakout!
at the verge of Breakout!
Sustaining 136 - 137 would lead it towards
141 - 144 & then 148-150.
Otherwise, 120-121 seems to be a Good
Support level.
and this time if 108 is broken,we will see
heavy Selling.

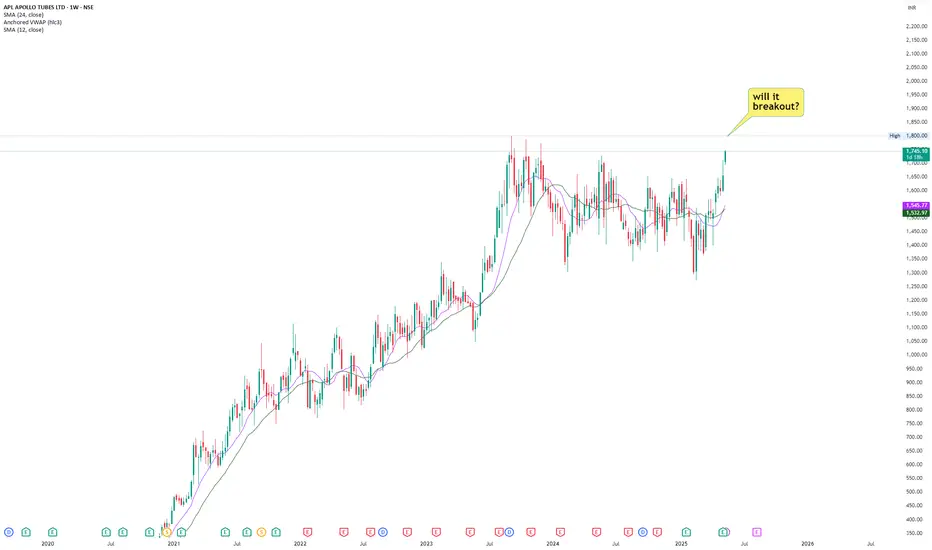
APLAPOLLO- All time high possible!!!APLAPOLLO is nearing its all time high level. Stock is nearing this level with relatively higher volume.
Stock has recorded double digit growth in last consecutive 2 quarters.
Margins have also expanded by roughly 40%.
Company has also expanded its CAPEX budget in coming years.
Overall it's a good technofunda stock to watch. Add to watchlist.