BSE Intraday Trade — 17 Dec 2025 | Trend Bullish Win (+50Market Bearish, System Bullish — Discipline Delivered Again
Today the overall market sentiment was bearish, yet the BTR Auto Buy/Sell Indicator generated a clear bullish signal in BSE Ltd.
By trusting the system instead of market bias, this trade delivered a clean intraday profit.
📊 Trade Execution
🟢 Entry: 2617
— Buy triggered when BTR generated a bullish signal near demand
🎯 Target-1 Hit: 2670
— +50 Points Booked
🔴 Alternative Exit (System-Based): 2635
— If target was not booked, BTR generated an exit signal, still locking profit
🔍 Trade Context
• Stock: BSE Ltd
• Timeframe: 15-Minute
• Market Bias: Bearish
• Trade Type: Counter-trend BUY
• Confirmation: Strong Demand Zone
BTR focuses on price behavior and structure, not emotions or opinions.
📈 Result:
✔ Best case: +50 points
✔ Worst case: +18 points
✔ Both outcomes profitable
🧠 Why This Trade Worked
✔ Entry aligned with demand zone
✔ Strong impulsive move after signal
✔ Partial or full profit booking possible
✔ System-defined exit removed greed
This is the power of having both targets and exit rules.
📌 Key Lesson for Intraday Traders
You don’t need to predict the market direction.
You need:
• A rule-based entry
• A defined profit plan
• A system exit to protect gains
BTR gives structure first, profit second.
📍 Final Note
Whether you booked:
• 50 points at target, or
• Exited at BTR signal,
👉 the trade stayed profitable and disciplined.
📌 Follow for daily intraday trade setups
💬 Private Message for BTR Indicator & usage rules
Trust the signal. Manage the trade. Stay consistent. 📊🔥
Bseindia

My BSE Intraday Trade Setup 05 Dec 2025For All Intraday Lovers – Follow for Live Trade Setups & DM for Strategy Details
Today I explored a clean intraday opportunity in BSE Ltd using my BTR Auto Buy/Sell Signal System.
Here’s the complete breakdown of why this setup worked beautifully:
📌 Why I Chose BSE Today
✔ Perfect Intraday Volatility – Smooth swings, no wild spikes
✔ High-quality structure around demand & supply zones
✔ Works amazingly with algorithmic signals
⏱ Timeframe Used
➡️ 15-Minute Chart – My preferred timeframe for intraday traders
Stable… Reliable… Noise-free…
📊 Indicator Used
🚀 BTR Auto Buy/Sell Trend System
✔ Proven 70% win rate
✔ Generates clean Buy/Sell signals
✔ Non-repaint logic for stable intraday entries
🎯 Entry Logic
🔹 Enter ONLY when BTR generates a fresh Buy/Sell signal
🔹 Align with demand/supply zones for best accuracy
🔹 Today’s Buy came perfectly from the Demand Zone
🔹 Captured a smooth +30 points intraday move
🏁 Exit Strategy
🎯 Targets: 25 / 50 / 75 / 100 points
🛡 Stop Loss: Day Swing Low/High
(Keeping SL outside noise ensures high reliability)
📈 Today’s Live Example: BSE Trade – 15 Min Chart (05/12/2025)
✔ Demand Zone created
✔ BTR gave a clean Bullish Signal
✔ Entry triggered
✔ Smooth intraday uptrend
✔ Exit achieved with 30 points profit
Chart attached for full transparency.
⚡ Want More Live Intraday Setups?
💬 DM Me for BTR System access
📌 Follow for real-time setups & intraday guidance
Trade smart. Trade disciplined. Trade BTR.

Nifty 4h Chart Analysis: Bullish ScenarioNifty 4h Chart Analysis: Bullish Scenario
*Last Friday's aggressive rejection from 71% fib level(red Fib levels) sent us below last week candle Low.
*Next Support level is Nov3rd down close candle, marked with Green rectangle on weekly chart on Right side +OB(W)
*Mid point of that green rectangle will be a good spot for longs, which is 71% fib level on yellow fib fib
***If market do not show any kind of reversal on that level expecting SellSide Liquidity as next downside target

Nifty50 4hr Chart Analysis-Nov 30, 2025Nifty50 4hr Chart Analysis-Nov 30, 2025
Case1:
*Expecting 4hr to drop to Daily Support Level (iFVG-D), which almost 50% of current range.
Case2:
*If nifty goes for a deeper retracement then expecting 0.79 which is also a 4hour Support level (+OB-4hr)

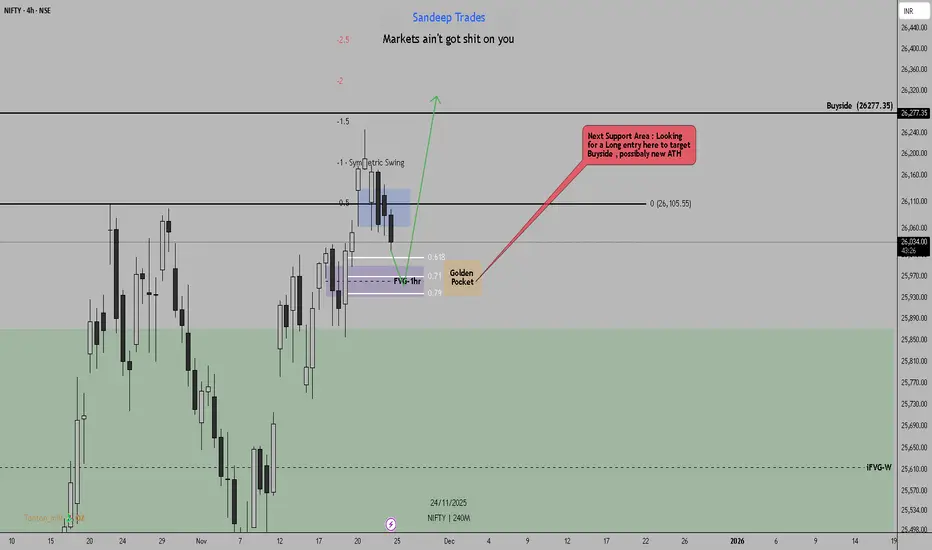
Nifty50 4Hour Chart Analysis: Setup Longs Nifty50 4Hour Chart Analysis: Setup Longs
*4hr iFVG(Purple rectangle) which is also Golden Pocket area on Fib retracements.
*Will be looking for a long setup there to target Buyside(previous ATH)
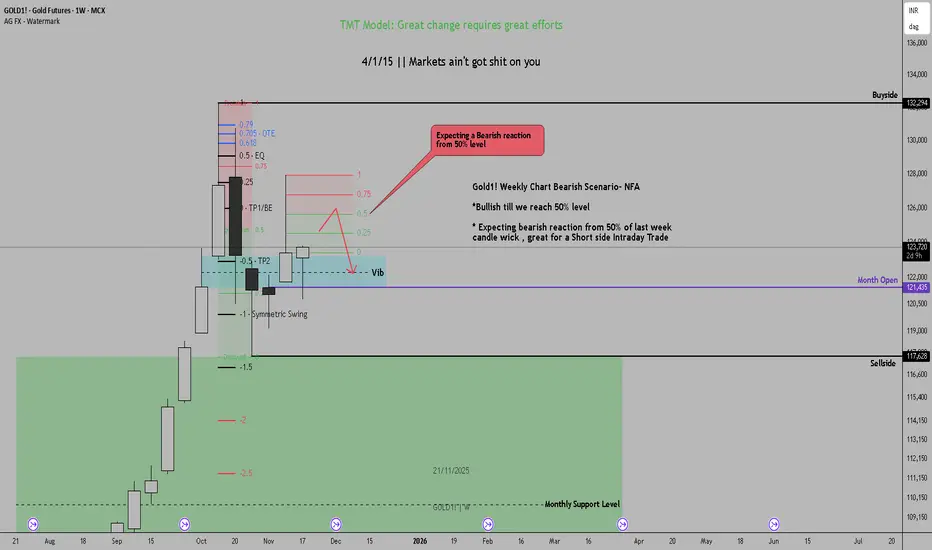
Gold1! Weekly Chart Bearish Scenario- NFAGold1! Weekly Chart Bearish Scenario- NFA
*Bullish till we reach 50% level
* Expecting bearish reaction from 50% of last week candle wick , great for a Short side Intraday Trade
NIFTY 50 Bullish Scenario: Weekly ChartNIFTY 50 Bullish Scenario: Weekly Chart
* Expected next couple of weeks Bullish and upside target is 26277.
* We might get a retracement day when we hit previous short term high (27107.10) which will be a good opportunity to add longs for
*Area market with green rectangle is SR flip/Support , price recently showed are strong upside reaction from this are.

TCS 60 MINS TIME FRAME MY VIEW The Structure looks good to us, waiting for this instrument to correct and then give us these opportunities as shown on this instrument (Price Chart).
Note: Its my view only and its for educational purpose only. Only who has got knowledge about this strategy, will understand what to be done on this setup. its purely based on my technical analysis only (strategies). we don't focus on the short term moves, we look for only for Bullish or Bearish Impulsive moves on the setups after a good price action is formed as per the strategy. we never get into corrective moves. because it will test our patience and also it will be a bullish or a bearish trap. and try trade the big moves.
We do not get into bullish or bearish traps. We anticipate and get into only big bullish or bearish moves (Impulsive Moves). Just ride the Bullish or Bearish Impulsive Move. Learn & Know the Complete Market Cycle.
Buy Low and Sell High Concept. Buy at Cheaper Price and Sell at Expensive Price.
Please keep your comments useful & respectful.
Keep it simple, keep it Unique.
Thanks for your support
Tradelikemee Academy
Saanjayy K G

Huge round of applause to those who are still bullish in BSEI have a bearish outlook on BSE as per the wave count highlighted.
I know a lot many are bullish because they got married to this stock.
Anyways do your own due diligence before taking any action.
Peace!!

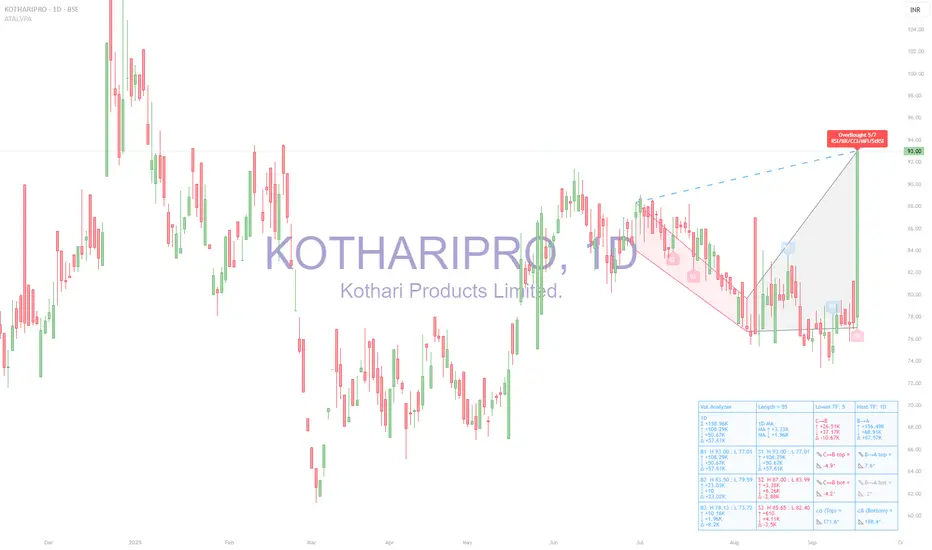
KOTHARIPRO (BSE: 1D) — Volume Pressure Analyzer | OB 5/7 Tool used
Analysis made with ATAI Volume Pressure Analyzer (VPA), which decomposes daily flows into buy/sell volume, prints half-window deltas (C→B vs B→A), ATR-normalized wing slopes, α/β geometry at vertex B, and OverBought/OverSold spike labels confirmed by a 7-oscillator vote
1) Snapshot from HUD
◉ OB 5/7 fired on today’s +20% candle (RSI/Stoch/CCI/MFI/StRSI cluster).
◉ C→B (earlier half): Δ −14.21 → seller-tilted.
◉ B→A (recent half): Δ +72.25K → buyers in control.
◉ Angles: C→B wing both <0° (down), B→A wing both >0° (up).
◉ α=171.6°, β=188.4° → no red flags (thresholds are α>180 or β<180).
◉ Ranked zones:
- B1 High 93.0 / Low 77.0 (resistance)
- S1 Low 83.9 (support)
2) Interpretation
◉ The OB 5/7 tag warns of short-term exhaustion after an impulsive surge.
◉ Yet the right wing (B→A) shows positive deltas and slopes, meaning structure still favors buyers.
◉ No α/β stress flags, so the geometry is not “over-stretched.”
◉ The zone map is clean: B1 = resistance (93.0) and S1 = first support (83.9).
3) Scenarios
A) Base case — Pullback / Digestion
◉ Likely reaction into the S1 zone (≈84–87) after OB tag.
◉ Watch Δ(B→A): if it fades to ≤0 and wings flatten, pullback deepens.
B) Bullish continuation
◉ Requires daily acceptance above 93 with a buy-spike (TF_buy / SMA ≥1.6 or Z≥1.8).
◉ Validation = B→A Δ stays >0 and right wing >0°.
C) Bearish rotation
◉ Triggers if B→A Δ flips negative and right wing turns gray/red.
◉ Breakdown below 83.9 on a sell-spike would confirm shift.
4) Conclusion
Bias: Constructive with pullback risk.
◉ Immediate OB tag suggests a pause; however, the buyer regime in the recent half (B→A) is still active.
◉ Key invalidation = loss of 83.9 (S1) with negative Δ.
◉ Key confirmation = acceptance above 93 with buy-spike absorption.
The points above are the technical and educational details from the ATAI Volume Pressure Analyzer (VPA). Put simply, the takeaway is this:
The stock made a sharp +20% move today up to 93, and the indicator flagged an “OverBought” condition. That means buying pressure was unusually strong and the market may need to cool off with a pause or short pullback. Still, the recent volume balance shows buyers remain in control, so the broader structure is still constructive.
If price can hold above 93 with renewed strong buy-side volume, continuation to the upside is favored. But if it slips below 84 and selling pressure grows, that would mark the start of a deeper correction. In simple terms: the main trend is still positive, but after today’s surge it makes sense to expect some digestion before the next leg.
BSE Takes Breather Before Its Next Move‽BSE Ltd, Asia's oldest stock exchange and a backbone of India's financial markets, has been a silent wealth creator over the past year.
From early 2024, the stock went on a dream run, driven by surging investor participation, record equity and derivatives turnover, and its diversified revenue streams - listing fees, transaction charges, and new technology-led offerings.
But like every strong trend, momentum eventually pauses. Since June, the rally cooled, and the price entered a downward-sloping channel, hinting at profit booking and cautious sentiment.
Technicals
• Primary Resistance: ₹2,500 - the top of the falling channel and a key breakout gate.
• Current Support: *2,365, where buyers have recently shown interest.
• Major Demand Zone: ₹2,270-₹2,300 - a historical springboard that fueled earlier surges.
• If Support Fails: A slide towards *1,946 and 1,775 could unfold.
The structure resembles a falling channel with a descending triangle base a classic setup where a decisive breakout can flip sentiment overnight.
The Bigger Picture
BSE's fundamentals remain robust
• India's booming equity culture is increasing trading volumes.
• Growing market share in derivatives is adding fresh revenue streams.
• Technology upgrades and new product introductions are future-proofing its business model.
Short-term price weakness appears more like a healthy pause in a long-term uptrend - provided the ₹2,270 zone holds.
Key Watch Levels
• Bullish Trigger: Sustained close above ₹2,500 could open the path to ₹2,800+
• Bearish Trigger: Close below ₹2,270 may extend the correction to ₹1,946 or 1,775.
Market Sentiment Cue
If the broader market remains strong and participation continues to rise, BSE could be setting up for its next breakout phase. But if the market turns risk-off, the stock may test its lower zones before attempting a rebound.

BSE - BSE Ltd. (45 mins. chart, NSE) - Long Position; short-termBSE - BSE Ltd. (45 mins. chart, NSE) - Long Position; short-term research idea.
Risk assessment: High {volatility risk}
Risk/Reward ratio ~ 3
Current Market Price (CMP) ~ 6480
Entry limit ~ 6370 to 6430 (Avg. - 6400) on April 23, 2025
1. Target limit ~ 6500 (+1.56%; +100 points)
2. Target limit ~ 6700 (+4.69%; +300 points)
Stop order limit ~ 6300 (-1.56%; -100 points)
Disclaimer: Investments in securities markets are subject to market risks. All information presented in this group is strictly for reference and personal study purposes only and is not a recommendation and/or a solicitation to act upon under any interpretation of the letter.
LEGEND:
{curly brackets} = observation notes
= important updates
(parentheses) = information details
~ tilde/approximation = variable value
-hyphen = fixed value

LEMONTREE HOTELS 240 MINS TIME FRAMEThe Structure looks good to us, waiting for this instrument to correct and then give us these opportunities as shown on this instrument (Price Chart).
Note: Its my view only and its for educational purpose only. Only who has got knowledge about this strategy, will understand what to be done on this setup. its purely based on my technical analysis only (strategies). we don't focus on the short term moves, we look for only for Bullish or Bearish Impulsive moves on the setups after a good price action is formed as per the strategy. we never get into corrective moves. because it will test our patience and also it will be a bullish or a bearish trap. and try trade the big moves.
We do not get into bullish or bearish traps. We anticipate and get into only big bullish or bearish moves (Impulsive Moves). Just ride the Bullish or Bearish Impulsive Move. Learn & Know the Complete Market Cycle.
Buy Low and Sell High Concept. Buy at Cheaper Price and Sell at Expensive Price.
Please keep your comments useful & respectful.
Keep it simple, keep it Unique.
Thanks for your support
Tradelikemee Academy
Saanjayy KG


NIFTY : Critical Support Retested – Bank Nifty Adds Pressure !Title: 📊 NSE:NIFTY (₹23,644.90): Critical Support Retested – Bank Nifty Weakness Adds Pressure!
🔍 Market Overview:
Current Price: ₹23,644.90
Key Observation: NSE:NIFTY is hovering near the crucial support of ₹23,540 (previously held on Dec 20).
Breakdown Risk: If ₹23,540 fails to hold, expect a slide toward ₹23,300 and possibly ₹23,150.
Market Sentiment: The market remains in an oversold zone, signaling a potential technical bounce, but weakness dominates.
🛑 Impact of Bank Nifty Weakness:
NSE:BANKNIFTY Trend: Also showing signs of weakness, which adds downward pressure on Nifty50.
Key Correlation: Financials have a significant weight in Nifty50; Bank Nifty's weakness could accelerate Nifty's downside move.
📊 Support & Resistance Levels:
Support: ₹23,540 → ₹23,300 → ₹23,150
Resistance: ₹23,750 → ₹23,880 → ₹24,000
📈 Fibonacci Insights:
The Fibonacci retracement highlights ₹23,540 as a make-or-break level.
A bounce from here could see Nifty testing ₹23,750 as the first resistance level.
⚖️ Strategy:
For Traders:
Below ₹23,540 → Short with a target of ₹23,300, keeping a strict stop-loss near ₹23,750.
Above ₹23,750 → Look for intraday longs targeting ₹23,880–₹24,000.
For Investors:
Use dips around ₹23,300–₹23,150 to accumulate quality stocks for long-term investment.
⚠️ Key Risks:
Continued selling pressure in Bank Nifty can trigger sharper declines in Nifty50.
Global cues and FII activity remain critical for near-term direction.
Disclaimer: I am not a SEBI-registered advisor. This analysis is purely for informational and educational purposes. Please consult a SEBI-registered financial advisor before making trading or investment decisions.

HERO MOTOR- SUPPORT TESTHero Motor broke out of a crucial level at 2900 where multi month resistance was seen. Post that its rise was halted at 6K+ and now its testing a crucial level of support- 0.618 FIB level , break of which can be bad for the stock -mid term. Correction is heavy on this stock, should watch this level carefully over the next 2-3 weeks.

Praveg- Descending ChannelPotential BULL Flag on the weekly- break down will target 610-620 and invalidate this, a break above will target 1200+.

BSE LimitedBSE Ltd. shows potential for breaking its all-time highs and beyond, especially if it maintains its leadership in India's capital markets and benefits from increasing trading volumes. Key support levels should be monitored closely to validate a bullish outlook.
looking further for more price data to form which will help me deliver with Perfect entry and Stoploss. currently i am staying neutral with no action in place just looking further how price moves in future.

BSE !! soon will give upside breakout BSE !! soon will give upside breakout.
- stuck in triangle pattern
- can give quick upside move post it breaks high of heavy red volume candle.

Nifty1! Daily Chart Analysis- NFANifty1! Daily Chart Analysis- NFA
-Price rejected from daily resistance (Mid point of red rectangle) aka daily sibi.
-Rejection from mid point of sibi shows its willingness to go further down to next imbalance(BISI-D)
-Expecting 23342 as next draw on liquidity (Green line labeled as top of daily bisi).

Silver1! Weekly Chart analysis-NFASilver1! Weekly Chart analysis-NFA
-Price came back inside weekly range after sweeping Buyside.
-Expecting price to bounce from next Weekly BISI (Support Level)
- i want the price(candle body) to stay above midpoint of green rectangle(BISI/Support)
-Weekly market structure also forming an inverted head and shoulder
-Any bearish weekly candle close below green support rectangle will invalidate the long setup and next target will be Sellside.

IDBI DAILY CHART TIME FRAME - MY VIEW ONLYThe Structure looks good to us, waiting for this instrument to correct and then give us these opportunities as shown on this instrument (Price Chart).
Note: Its my view only and its for educational purpose only. Only who has got knowledge about this strategy, will understand what to be done on this setup. its purely based on my technical analysis only (strategies). we don't focus on the short term moves, we look for only for Bullish or Bearish Impulsive moves on the setups after a good price action is formed as per the strategy. we never get into corrective moves. because it will test our patience and also it will be a bullish or a bearish trap. and try trade the big moves.
we do not get into bullish or bearish traps. We anticipate and get into only big bullish or bearish moves (Impulsive Moves). Just ride the Bullish or Bearish Impulsive Move. Learn & Know the Complete Market Cycle.
Buy Low and Sell High Concept. Buy at Cheaper Price and Sell at Expensive Price.
Please keep your comments useful & respectful.
Keep it simple, keep it Unique.
Thanks for your support
Tradelikemee Academy
Saanjayy KG

Bankex Analysis for Tomorrow 21/10/24Bankex Analysis for Tomorrow 21/10/24
Here is analysis for bankex, Pls use Broker's charts for Bankex
all the details on the chart are given using the price action and technical theory and fib levels.
