Bseindia

Bank of Baroda - BSE - India*****Please follow, like, and support this idea, if it helped you in anyway*****
***This is not a financial advise***
Bank of Baroda fell sharply from the support level turned resistance and now holding on to another support since 5 months and seems like that it might test the resistance level again - this might take one year to two years or could even take next three months before the earning starts.
Going in with the views -

Bank nifty Like yesterday , today also bulls are in ground...
Long with SL of 26470
Note :- Do not go with my advice , study a trade !
Hello i am Zeel Goswami,
Here on my profile you can get best positional & swing trade
Thank you

BANK NIFTY Buy call on bank nifty with this 2 support level.
Note :- Do not go with my advice , study a trade !
Hello i am Zeel Goswami,
Here on my profile you can get best positional & swing trade
Thank you

BHEL ! BUY ?Yes , here BHEL on his support level so study it!
Personal advice:-
Buy :- 28.20
SL :- 26
Limit :- 36
Note :- Do not go with my advice , study a trade !
Hello i am Zeel Goswami,
Here on my profile you can get best positional & swing trade
Thank you


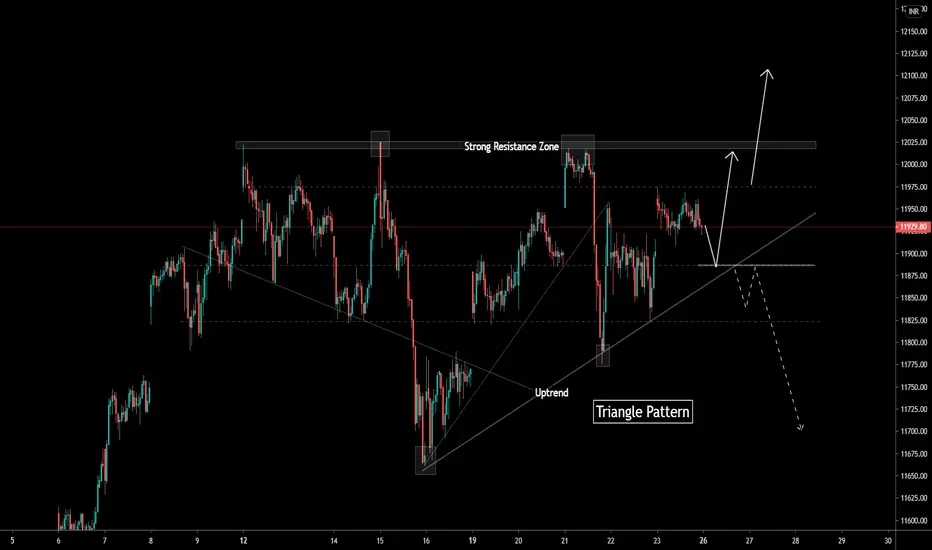
NIFTY50 - Triangle pattern let me know in the comment section below if you have any questions,
the entry will be taken only if all rules of the strategies will be satisfied.
Bajaj Finance - OutlookHi Traders,
Bajaj finance is still in a downtrend as per the higher timeframes. This stock has pulled back to a major resistance zone. The price can continue to go further down from these levels. If the price breaks the trendline marked in the chart which will indicate that the price will be heading down. The key levels to watch are marked with red lines in the chart, these levels can react with the price.
Now if price breaks the key resistance zone to the upside, a break above 3590.85 indicates a start of an uptrend.
For queries pls comment below.
Happy trading.....


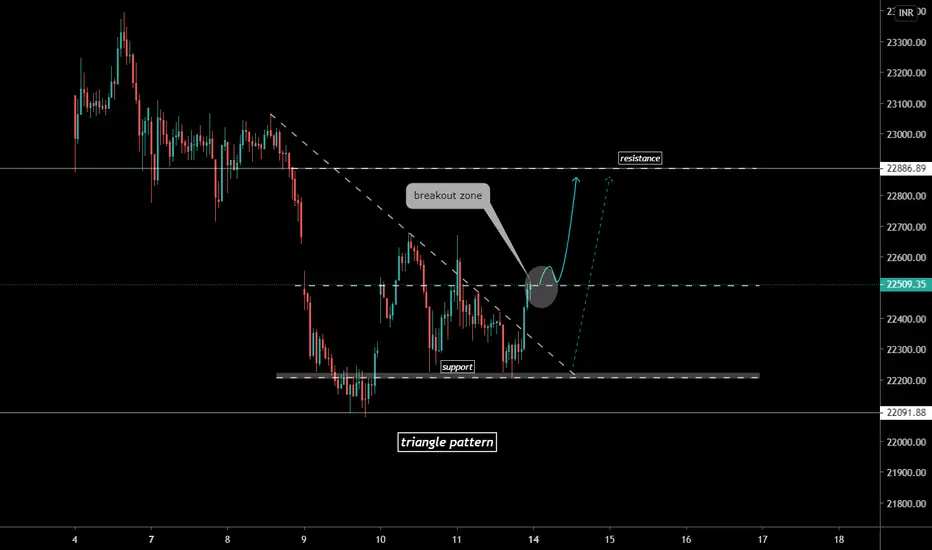
NIFTYBANK - Triangle pattern breakout let me know in the comment section below if you have any questions,
the entry will be taken only if all rules of the strategies will be satisfied.

niftyfiftylet me know in the comment section below if you have any questions,
the entry will be taken only if all rules of the strategies will be satisfied.

SENSEXlet me know in the comment section below if you have any questions,
the entry will be taken only if all rules of the strategies will be satisfied.

Bajaj Finance - Complete Breakdown Of ChartHi Traders,
As we analyse the daily chart, price is in an uptrend because it is trading above the 50SMA. The key levels are at 3518 (Green) , 3606.60 (Yellow) and the golden zone between 3446.35 - 3374.70 respectively. We can see that price has found support at the golden zone and has tested our resistance level at 3518. Since price found support at the golden zone, breaking of the recent high(3749.85) is unlikely. So we can conclude that this stock is in its exhaustion stage and the present uptrend will end soon. If the price close below 3272.75 (Red), this marks the end of current uptrend.
Now we will look into the hourly chart for short term opportunities. The hourly chart is below the 50 SMA indicating a downtrend but since the higher timeframe is showing uptrend, it is advisable to take buy positions. Short term buys can be done if it breaks the hourly trendline and must be cautious when price tests the above mentioned key levels. Intraday trades can be planned based on price action at the above mentioned levels.
Note:- This analysis can be used for short term and medium term analysis. We need to breakdown the weekly chart for long term investments.
If u have any suggestion on which counter u need an analysis, please comment below.
Pls like and follow for more.
Happy Trading............


reliance industries ltd. let me know in the comment section below if you have any questions,
the entry will be taken only if all rules of the strategies will be satisfied.

NIFTY50 let me know in the comment section below if you have any questions,
the entry will be taken only if all rules of the strategies will be satisfied.

POSSIBLE SHORT TERM TREND REVERSAL IN TATA MOTORSHi Traders,
Tata Motors has broken our golden zone with confidence, and is now testing a key level of trend reversal at 141.85. If the day close below 141.85 levels our short term bias on this stock will be bearish and we will be looking for shorting opportunities. If the close is below 141.85 we will have new resistance levels. New levels will be updated in post market hours if we have a trend reversal.
Pls like and follow for more analysis.
Happy Trading......

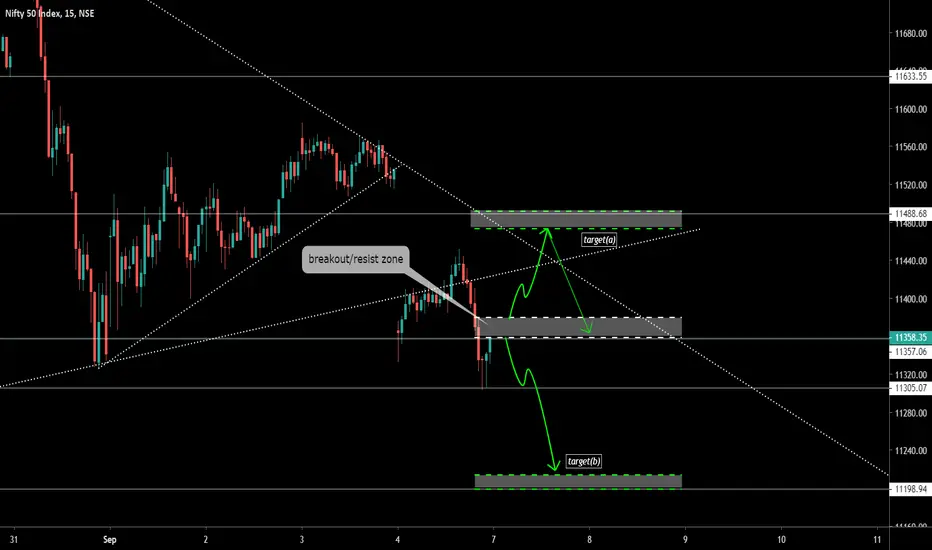
nifty50 - downtrend let me know in the comment section below if you have any questions,
the entry will be taken only if all rules of the strategies will be satisfied.
Buy Godrej Prop for target of 950 +We are not SEbi registered
not resposible for any kind of losses or profits made....


Trade Setup - JSW STEEL Hi Traders,
We saw a good sell off in the indian markets, the jsw steel chart seems very attractive for us. The price is still in an uptrend as per the 4h and daily timeframe. We have the goldenzone between 282.15 and 278.90. The price has tested the golden zone and closed above this level. We have immediate resistance at 285.40 and 289.40. A good and safe trade setup can be when the price breaks the trendline and the resistance at 285.40.
A buy entry can be placed when price retest the broken resistance, and the target can be placed at the next immediate resistance.
For queries pls comment below.
Pls like the idea to show support.
Happy trading........
