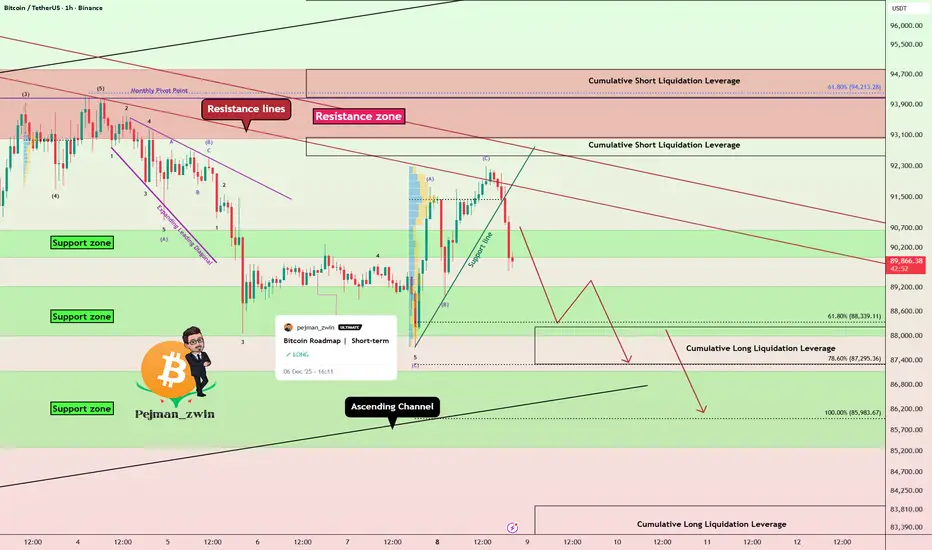
Bitcoin Breakdown After Perfect Bounce — Short Setup LoadingAs I expected , Bitcoin bounced from the support zone and reached its targets.
Right now, Bitcoin has rejected from resistance lines and successfully broke both the support line and the support zone($90,650-$90,000).
From an Elliott Wave perspective, it appears that Bitcoin has completed a ZigZag structure, and we should now anticipate the start of a bearish wave sequence.
The S&P 500 index( SP:SPX ) also shows a bearish outlook, and given Bitcoin’s correlation with SPX, further downside in BTC is not surprising.
At the same time, USDT.D%( CRYPTOCAP:USDT.D ) has turned bullish again—at least in the short term—which can add additional pressure on Bitcoin.
I expect Bitcoin to continue its downward movement, at least toward the next support zone($87,140-$85,290) and the lower line of the ascending channel.
Note: It’s better to wait for a bullish correction before entering, and then take a short position according to your own strategy.
Cumulative Short Liquidation Leverage: $98,260-$96,690
Cumulative Short Liquidation Leverage: $93,040-$92,560
Cumulative Long Liquidation Leverage: $94,840-$94,100
Cumulative Long Liquidation Leverage: $83,900-$82,400
Target: $87,733
Stop Loss(SL): $92,723(Worst)
Points may shift as the market evolves
💡 Please respect each other's opinions and express agreement or disagreement politely.
📌Bitcoin Analysis (BTCUSDT), 1-hour time frame.
🛑 Always set a Stop Loss(SL) for every position you open.
✅ This is just my idea; I’d love to see your thoughts too!
🔥 If you find it helpful, please BOOST this post and share it with your friends.
BTC-D
Bitcoin at Critical Resistance — Bull Trap!?Over the past couple of hours, Bitcoin ( BINANCE:BTCUSDT ) has surprised many traders—including myself—with its sharp movements. The potential reason behind this could be an anticipated interest rate cut tomorrow. However, the recent JOLTS Job Openings did not fully align with that expectation.
With our technical analysis tools, we can delve deeper into Bitcoin’s next moves. The key question is whether Bitcoin will maintain its recent bullish momentum or if a reversal is imminent.
It’s important to note that in the next 24 to 48 hours, we may see increased volatility in the financial markets, particularly in crypto. Therefore, it’s wise to practice good risk management—or even consider staying on the sidelines until the market settles.
At the moment, Bitcoin has managed to break through resistance lines, but the volume of this breakout hasn’t been particularly high. Bitcoin is also near a resistance zone($94,850-$93,000), monthly pivot points, and significant levels of Cumulative Short Liquidation Leverage($98,260-$94,600), all of which add to the complexity.
High sell orders: $96,000-$94,800
From a classical technical standpoint, there’s potential for a bearish flag pattern forming. As long as Bitcoin remains below $100,000, this scenario remains plausible.
From an Elliott Wave perspective, it seems that the main Wave B has completed, and we’re likely looking at a ZigZag correction(ABC/5-3-5). This correction might complete either at the resistance zone($94,850-$93,000) or near the daily 50_SMA(Daily).
Considering that the S&P 500 index ( SP:SPX ) is also showing a bearish trend, it’s more likely that Bitcoin’s main corrective Wave C will complete within these resistance levels.
Also, the USDT.D% ( CRYPTOCAP:USDT.D ) remains a crucial factor. Until it hits around 5.49%, the overall crypto market is likely to remain bearish.
In conclusion, I expect that Bitcoin will continue its downward movement, potentially testing $89,000 and even dropping below $85,000. This could represent a significant bearish phase for Bitcoin.
What are your thoughts? Do you think Bitcoin will maintain this bullish momentum, or are we headed for more downside?
Cumulative Long Liquidation Leverage: $89,430-$88,750
Cumulative Long Liquidation Leverage: $83,900-$82,400
First Target: $90,300
Second Target: $87,503
Stop Loss(SL): $100,020(Worst)
Points may shift as the market evolves
💡 Please respect each other's opinions and express agreement or disagreement politely.
📌Bitcoin Analysis (BTCUSDT), 4-hour time frame.
🛑 Always set a Stop Loss(SL) for every position you open.
✅ This is just my idea; I’d love to see your thoughts too!
🔥 If you find it helpful, please BOOST this post and share it with your friends.

BITCOIN Why nobody talks about this??That was the last indicator standing and now it is as clear as it can get. With last month's candle close, Bitcoin (BTCUSD) has confirmed that it has already started a new Bear Cycle.
The reason is simple and it is one of the most basic trading indicators out there. The 1M MACD was already on a Bearish Cross since October, and November's closing widened the gap to such extent that it is not recoverable anymore.
This has happened every time during a BTC Bear Cycle and in two of the past three cases, it took place while already on the Bear Cycle. History has shown that there is no coming back from this and BTC should start looking for the 1M MA50 (blue trend-line) - 1M MA100 (green trend-line) Zone. If all the Bear Cycle indicators we've shown on analyses since September were early signs, the MACD is conclusive and as mentioned, has confirmed it.
But what do you think? Has the MACD Bearish Cross confirmed the new Bear Cycle beyond any doubt? Feel free to let us know in the comments section below!
---
** Please LIKE 👍, FOLLOW ✅, SHARE 🙌 and COMMENT ✍ if you enjoy this idea! Also share your ideas and charts in the comments section below! This is best way to keep it relevant, support us, keep the content here free and allow the idea to reach as many people as possible. **
---
💸💸💸💸💸💸
👇 👇 👇 👇 👇 👇

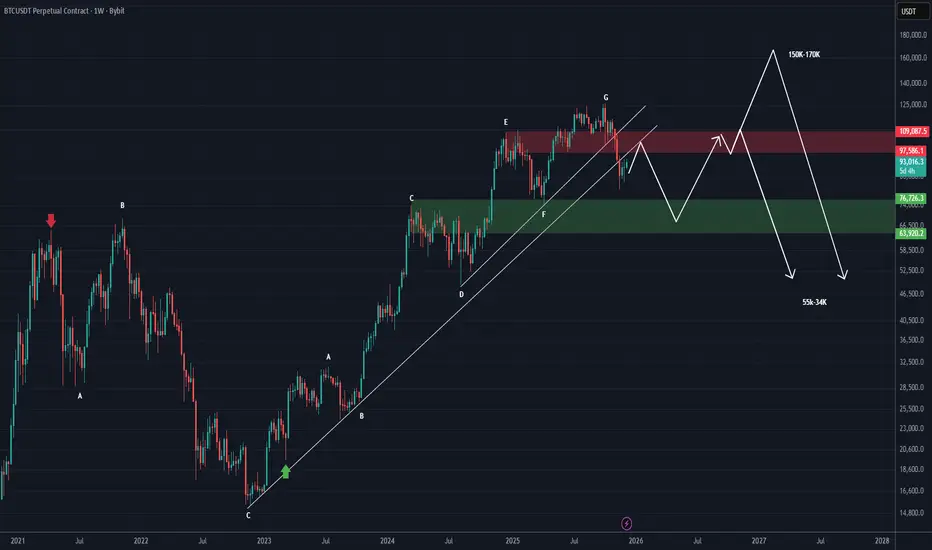
Bitcoin RoadMap (1W) | Important UpdateIt’s better to first have a complete roadmap for Bitcoin for the coming months.
We have cleaned up the chart as much as possible, making the pattern lines and range zones invisible so the chart remains uncluttered.
As you can see, Bitcoin is trading below the upward trendlines and also below the FLIP zone.
It is expected that the price will be rejected from the red zone down toward the 76K to 64K range, and then from that area it may attempt a move toward higher levels.
If the red zone is broken, the price could reach the 150K to 170K area. However, if it fails to hold above the red zone, it may drop to the 55K range and even 27K, potentially starting a bearish cycle.
This is the condition for Bitcoin | it should not be compared with altcoins, and many altcoins may even become bullish while Bitcoin is in a bearish cycle!
For risk management, please don't forget stop loss and capital management
When we reach the first target, save some profit and then change the stop to entry
Comment if you have any questions
Thank You
BTC: Liquidity Sweep SetupBTC: Liquidity Sweep Setup
Bitcoin continues to operate inside a broad equilibrium zone after completing a prolonged downward phase earlier in the month. The decline lost momentum as price entered a high-participation area, where trading activity became increasingly balanced and rotational. Since then, the market has developed a wide consolidation band, signaling a temporary standoff between directional conviction and liquidity accumulation.
Recent sessions show price repeatedly rotating through the center of this zone, forming alternating impulses that lack continuation. This pattern reflects a market focused on collecting orders rather than trending. Each short-lived push quickly transitions back into the range, indicating absorption on both sides and limited willingness from participants to sustain directional movement.
The lower portion of the range has begun attracting more activity, suggesting interest from larger players seeking efficient fill zones before any expansion. Price behaviour here is characterized by controlled sweeps, shallow recoveries, and frequent re-tests of the mid-band — signs of liquidity harvesting rather than aggressive distribution.
Forward behaviour on the chart implies that the market may first dip into the lower liquidity pocket to finalize order collection. Once this pocket is satisfied, conditions become favourable for a transition into an expansion phase targeting the upper boundary of the current equilibrium. This type of structure is common before major repricing, as it reflects the buildup of untriggered positions awaiting execution.
Overall, Bitcoin is in a preparation phase where energy is being stored, volatility is compressing, and liquidity is reorganizing. The next significant development is likely to emerge once the market completes its sweep of inefficient areas inside the range and finds a stable base for expansion.

BITCOIN → False breakout of resistance on a downtrend BINANCE:BTCUSDT is consolidating in the range of 86K - 92K, bears are holding resistance amid a global downtrend, traders lack drivers...
Fundamentally, sentiment in the crypto market is weak, and there is increasing talk of a crypto winter, especially among companies that previously actively bought cryptocurrencies for their balance sheets. There is no bullish driver at the moment.
Bitcoin is in a neutral state, with the market holding the price below 93K. The fundamental background is unstable, and technically, the market is in a downtrend. A reversal pattern is forming relative to 92K, and a retest and false breakout of the zone of interest could trigger a decline to the support range.
Locally, we are seeing an upward channel, but this is a correction against the backdrop of the global trend. If the bears keep the price below 92K, the decline may continue. However, a breakout of 94K and a close above that level could trigger an upward momentum...
Resistance levels: 91850, 92700, 93700
Support levels: 88000, 86300
A false breakout and price consolidation in the short zone could cause further sell-offs towards the areas of interest located at the bottom of the trading range.
Best regards, R. Linda!

Do you think I'm joking ???As you can see, the price is forming two bullish patterns on the 4h timeframe, If my view is correct, btc will rise to $100k
And if this pattern is correct and breaks, higher targets are possible.
previous analysis

XAUUSD: The Calm Before the Breakout1. Market Volatility
- Gold continues to move strictly inside the descending channel, creating a clear sequence of lower highs and lower lows.
- Each attempt to retest the upper boundary of the channel results in a rejection, confirming that sellers are still controlling short-term momentum.
- The volatility remains controlled and technical, with price respecting channel structure and moving methodically downward.
2. Trader Psychology
- This is the phase where many traders anticipate a reversal too early simply because price has declined for multiple sessions.
- However, professionals wait for structure-based confirmation, not hopeful speculation.
- Gold’s current movement punishes impatience and rewards traders who stay aligned with the dominant trend and wait for clean signals around key levels.
3. Key Drivers / Market Reasoning
Price is actively cycling liquidity between the descending channel and the major support zone at 4148–4160.
Current movement reflects:
- Institutional order-building near channel lows
- Rejection liquidity being created at the upper boundary of the channel
- Absence of strong catalysts during this session, allowing technical structure to dominate
- Market preparation for a larger move once liquidity is fully gathered
Gold is not ready to break out yet—it continues to accumulate orders inside the channel before choosing the next major direction.
4. Trading Strategy
🔸 Primary Plan: Expect a retest of the short-term resistance zone near 4195–4200 (upper channel boundary).
🔸 Sell Setup: Watch for bearish rejection at this zone
→ Target the support zone at 4148–4160 in alignment with the channel direction.
🔸 Buy Setup (Alternative Scenario): Only consider BUY positions if price breaks and closes decisively above 4200–4210
→ This would signal a potential reversal and retest, breaking the descending structure.
🔸 Risk Management: Gold is moving within a tightening channel, meaning a liquidity break can occur sharply.
Maintain controlled lot size and avoid early entries.
5. Trend & Price Outlook
- The overall structure continues to favor downside continuation as long as price remains inside the descending channel.
- The 4148–4160 support zone is the most critical area to monitor—this is where institutional demand previously stepped in.
- Until gold breaks above the descending trendline, the bearish roadmap remains intact and is unfolding exactly as expected.
Stay patient now — this is where smart money positions before the big move.

Bitcoin: Critical Levels Ahead, $106k or $65kHi guys!
The current BTC structure displays a textbook Three Drives Pattern, followed by visible momentum weakness. After the first, second, and third drives completed, price failed to create higher highs, confirming exhaustion. This aligns with the RSI divergence, which began forming during the second and third drives.
Price has now pulled back into a key decision zone. Two scenarios stand out:
Bullish Scenario
If BTC breaks and sustains above 94,393 USD, it would signal renewed strength. This could trigger a continuation toward the upper supply zone around 105,000–110,000 USD, where previous rejection occurred.
Bearish Scenario
Failure to break higher and instead falling below 82,000–83,000 USD opens the path toward deeper retracement. A breakdown confirms the distribution phase after the three drives, exposing the broader support area near 74,500 USD and potentially down to 65,445 USD, which aligns with historical demand.
Disclaimer: As part of ThinkMarkets’ Influencer Program, I am sponsored to share and publish their charts in my analysis.

BTC updates
Here’s the Bitcoin result as well: it has gained 4%, and as expected, the 90,500 level pushed the price upward with high precision.
If you’d like to see more of my analyses, make sure to follow.

Gold Is Preparing for a Reversal — Only Smart Money Will 📌 1. Market Structure
Gold is currently forming a bullish market structure on higher timeframes, with clear sequences of:
- HH (Higher Highs)
- HL (Higher Lows)
The recent drop created a series of LL & LH patterns, but this occurs inside a falling wedge, which typically appears as a bullish correction phase before a strong continuation upward.
The wedge + liquidity sweep + key HL zone indicates a potential trend continuation.
📌 2. Key Zones
Major Support Zone: 4163 – 4170
This is the large liquidity zone where price previously formed HL + BOS.
Price is now dipping back into this zone — ideal for liquidity collection.
Upper Resistance Target: 4230 – 4265
This is where previous HH formed and where price may extend after breaking the wedge.
📌 3. Price Action
- Price broke structure (ChoCh) during the drop, but this move is corrective, not reversal.
- The wedge is compressing with lower volatility and higher rejection wicks.
- Sellers are losing strength; buyers are absorbing entries near the HL liquidity zone.
- Current projection shows a possible V-shaped reversal or a slower corrective retest bounce, both converging to bullish continuation.
This matches your yellow & green projection lines.
📌 4. Technical Confirmation
-Falling Wedge: A classic bullish reversal pattern.
-Liquidity Sweep: Price wicked below the previous LL, grabbing liquidity for buyers.
-BOS signals: Multiple Break-of-Structure points confirm prior bullish intent.
-Rejection at Support: Strong wick rejections inside the wedge base show institutional buying.
-Fib Confluence (if applied): 0.618–0.705 zone aligns perfectly with the current rebound.
All technicals suggest a bullish reversal is highly probable.
📌 5. Trading Plan
🎯 BUY Setup
Entry Zone: 4165 – 4175 (at wedge bottom / liquidity zone)
Stop-Loss: 4148 (below liquidity sweep & wedge invalidation)
Take Profit 1: 4210 (first structure break)
Take Profit 2: 4235
Final Target: 4260 – 4265 (previous HH)
Why this setup works:
You’re entering at the end of a liquidity sweep, inside a falling wedge, at a major HL zone, with BOS support behind you.
This is exactly where institutions enter not retail traders.

TradeCityPro | Bitcoin Daily Analysis #245👋 Welcome to TradeCity Pro!
Let’s move on to the Bitcoin analysis. After the fake move we had yesterday, today Bitcoin has entered a ranging box.
⏳ 1-hour timeframe
Yesterday on Bitcoin we had a trigger at the 91447 zone that we could use as a long trigger.
🎯 Before that, we also had a trigger on Bitcoin at 89849 which had been activated, and with the break of 91447 the second trigger was also activated.
🎲 After this trigger was activated, given the trend weakness we had on Bitcoin, the price could not stabilize above 91447, and with that move being faked, it dropped again to 89849.
⛏ The 89849 zone is an important support area on Bitcoin, and the next support we have on Bitcoin is 88890.
✔️ Considering that Bitcoin has faked both the 89849 low and the 91447 high once, we can say currently there is no specific trend in the market, and we can open both short and long positions.
📊 For a long position, again we can enter with the break of 91447 and open our position.
✔️ In case the market drops, we have two short triggers:
the first is 89849 and the second is 88890, and by breaking either of them we can have a trigger for a short.
❌ Disclaimer ❌
Trading futures is highly risky and dangerous. If you're not an expert, these triggers may not be suitable for you. You should first learn risk and capital management. You can also use the educational content from this channel.
Finally, these triggers reflect my personal opinions on price action, and the market may move completely against this analysis. So, do your own research before opening any position.

GOLD vs BITCOIN FRACTAL ! Let’s deeply analyze this Gold (1973-1980) and Bitcoin (2021-2025) fractal (price action similarity) within its historical, cyclical, and technical contexts.
1. The Macroeconomic Stage: 1970s vs. 2020s
It is no coincidence that these two charts resemble each other so closely. Both assets matured during similar periods of "monetary expansion and crises of confidence."
Gold (1970s):
Event: Nixon removing the US Dollar from the Gold Standard in 1971 (The end of Bretton Woods).
Environment: High inflation (Stagflation), oil crises, and geopolitical tensions. Investors fled from depreciating fiat currency into "real money" (Gold).
Bitcoin (2020s):
Event: The largest monetary expansion in history following COVID-19 (M2 Money Supply surge).
Environment: Global inflation waves, banking crises, conflicts, and digitalization. Investors are turning to "Digital Gold" as a hedge against inflation.
Common Ground: Both eras are characterized by shaken trust in fiat currency (the Dollar) and a flight toward assets with limited supply.
2. Technical Structure and Fractal Analysis
The similarity in the charts aligns perfectly with Elliott Wave Theory and Wyckoff Cycle principles. Let's break it down step-by-step:
A. "Double Top" and Correction
Gold (1974): Formed a double top at the $200 level and entered a harsh bear market (nearly 50% drop).
Bitcoin (2021): Formed a double top at the $69,000 level (April and November) and dropped 77%.
Psychology: This phase is the "Distribution" stage where the initial FOMO (Fear Of Missing Out) wave dies down and "weak hands" are flushed out of the market.
B. Accumulation and the "Mid" Bottom
In both charts, following the crash, a long, exhausting sideways/slightly declining "Rounded Bottom" (Cup) structure is formed.
Point 1 (The Bottom): The darkest point of the bear market. (1976 for Gold; the 2022 FTX collapse for BTC).
C. ATH (All-Time High) Breakout and the "Trap"
This is the most critical point of the fractal.
Gold (1978-1979): Broke its previous peak of $200. Everyone said "we are taking off," but the price pulled back to test this level.
Bitcoin (2024-2025): Broke the 2021 peak of $69,000 (and the upper band of the channel shown). It is currently trying to hold above this region.
D. "Most Say Double Top"
The arrows and the region marked '3' on the chart are the litmus test for market psychology.
As price consolidates just above the old high, fearful investors believe this is a "Bull Trap" and that the price will crash.
Gold Example: When Gold hovered around $250, analysts said, "that's enough, it will fall." However, this was merely the final shakeout before the Parabolic Rise (Mania Phase).
Bitcoin Situation: The current movement in the $90,000 - $100,000 band looks technically like a carbon copy of Gold’s action at $250.
3. Time Scale & Pace
The most important difference to note here is the Speed of Time.
Gold: It took approximately 7 years to complete this formation (1973-1980).
Bitcoin: Crypto markets move much faster than traditional markets (24/7 trading, algorithmic bots, internet speed). Bitcoin is completing this cycle in about 4 years.
Conclusion: The process in Bitcoin is progressing approximately 2x faster than Gold. What Gold did in 1 year, Bitcoin can do in 6 months.
4. Scenario Projection: What If the Fractal Plays Out?
If Bitcoin follows the path Gold took post-1979 (the parabolic vertical ascent shown in the chart):
Confirmation Phase (Point 3): The process we are currently in (or about to enter). The moment old resistance (70k-90k) flips into solid support.
Mania Phase (Parabolic Rise): After breaking $250, Gold shot up to $850 in a very short time (approximately 3.4x).
Bitcoin Target: If we apply a similar 3x-4x "Mania" multiplier from the breakout point of ~$74,000, this mathematically takes us to the $220,000 - $280,000 band.
This chart tells us one thing: We haven't started the real party yet.
Observation: The current volatility and the fear of "will it drop?" is simply the final ticket check before the major rally (Re-accumulation).
Risk: Fractals do not work 100% of the time. Macro dynamics (US interest rate decisions, regulations) can disrupt the process. However, the technical structure looks hyper-bullish.
Strategy:
Region 3 on the chart (the support test) is a buying opportunity.
If Bitcoin follows the historical Gold chart, we could see a very sharp, vertical, and parabolic rise (a "God Candle") within the next 12-18 months.
Conclusion: Gold was the "Analog Safe Haven" of the 1970s. Bitcoin is the "Digital Safe Haven" of the 2020s. The historical scenario suggests Bitcoin is currently "performing final engine checks on the runway."
--------------------------------------------------
The "cyclical similarity" between these two assets is not merely about price lines looking alike. This similarity rests on the universal laws of human psychology and economic liquidity cycles.
As a data analyst and market expert, I break down the 4 most critical cyclical similarities ("Cyclical Drivers") between these two charts as follows:
1. The "Fiat Currency Devaluation" Cycle
Both charts are actually pricing in the loss of value of money rather than the appreciation of the asset itself. This is the fuel of the cycle.
Gold (1970s): In 1971, Nixon abandoned the Gold Standard. Once the physical backing behind the Dollar was removed, a fear of "unlimited dollar printing" emerged. This triggered a 10-year inflation cycle.
Bitcoin (2020s): In 2020-2021, central banks printed an unprecedented amount of money (M2 Money Supply explosion). Bitcoin’s cycle is built upon absorbing this excess liquidity and the shaking of trust in fiat currency (banking crises, etc.).
Common Ground: Both cycles represent a "Flight to Safety."
2. The "Institutional Adoption and Financialization" Cycle
This is the phase where an asset moves from a "niche" market to a global asset class.
Gold (1974): The lifting of the ban on gold ownership for individuals in the US and the opening of Futures markets allowed institutional money to enter gold. This laid the infrastructure for the massive rise (mania) of the late 1970s.
Bitcoin (2024): The approval of Spot Bitcoin ETFs (BlackRock, Fidelity, etc.). Just as it happened with Gold in the 70s, the path is now open for institutional capital (pension funds, corporate treasuries) to enter Bitcoin via legal and easy routes.
Significance: "Phase 3" on the chart (confirmation after the breakout) is exactly the period where "Smart Money" takes positions and locks up the supply.
3. The Market Psychology Cycle (Wall St. Cheat Sheet)
The "Double Top" followed by the "Cup" structure in the charts is a direct reflection of the classic market psychology cycle.
Denial and Depression: The "Mid" bottom levels on the chart. While investors say "Bitcoin is dead" or "Gold will never rise again," the "Weak Hands" are actually being eliminated.
Disbelief: The phase we are currently in (Point 3 on the chart). Price breaks the old high (ATH), but no one believes it. It is called a "trap" or "it will fall again."
Cyclical Similarity: In both charts, the "pullback/test" movement that comes after the ATH breakout is the moment the "Last Skeptics" are thrown off the train. The "Mania" phase begins immediately after this.
4. The Supply Shock Cycle
Price is pushed up not just by demand, but also by constraints in supply.
Gold: In the 70s, rising mining costs and geopolitical crises constrained supply.
Bitcoin: The "Halving" mechanism. Every 4 years, the supply of new Bitcoin is cut in half. The current cycle (2024-2025) is the period where a supply shock (Bitcoin Halving) collides with a demand shock (ETFs).
In Summary; Why Do They Look Alike?
Bitcoin is the digital gold of the modern era.
The Gold chart of the 1970s is the best historical data available to show how an asset is priced when it completes the process of becoming "money." Bitcoin is currently undergoing the "Price Discovery" cycle—mathematically and algorithmically—that Gold experienced in the 1970s.

EURUSD: This Move Wasn’t Accidental…EURUSD MARKET ANALYSIS – 1H
1. Current Price Structure
- EURUSD has completed a full parabolic rounded bottom formation, pushing price back into the upper boundary of the ascending channel.
- After touching the resistance zone (1.16800), price sharply rejected and transitioned into a descending channel, signaling a shift from bullish continuation to correction.
- The recent rally lost momentum, and price is now moving inside a bearish correction channel, confirming that buyers are weakening.
- The circled area shows a failed breakout attempt, followed by strong re-entry inside the bearish channel → classic distribution signal.
2. Liquidity Zones
Resistance Liquidity (1.16800):
Price tapped this level multiple times and got rejected aggressively → liquidity above remains intact, suggesting the market is not ready for a breakout.
Support Liquidity (1.15900):
The support zone below holds significant liquidity — multiple previous wicks show repeated absorption by buyers.
Current structure indicates
Smart money is distributing near resistance and collecting liquidity for a deeper move toward support.
3. Today’s Market Scenario
🔻 Main Scenario – Bearish Correction Toward Support
The price is expected to continue moving inside the descending channel:
Multiple lower highs forming at the top of the channel.
Price likely oscillates sideways with bearish bias, forming repeated LH–LL structures.
Final target of this correction: 1.15900 (support zone).
This aligns perfectly with the red path drawn on your chart:
- Zig-zag correction
- Progressive decline
- Reaching support zone for liquidity sweep.
Unless the resistance zone is broken convincingly, bearish continuation remains the highest-probability scenario.
4. Market Psychology
The chart reflects a classic sentiment shift:
- Before reaching resistance, traders were optimistic due to the strong bullish rally (rounded bottom).
But the sharp rejection at resistance created psychological distribution, where:
-Early buyers take profits
-Late buyers get trapped
- Smart money sells into retail optimism
The descending channel represents controlled selling pressure, not panic — this is strategic distribution.
Price will typically move slowly downward, trapping breakout traders until deeper liquidity at support is reached.
This is textbook smart-money behavior:
Euphoria → Distribution → Controlled Decline → Liquidity Sweep.
5. Intraday Strategy
🔻 Short Bias (High Probability)
Trade with the correction channel.
Entry: Short at the upper boundary of the descending channel (1.16500 – 1.16600).
SL: Above mini-swing high or above channel top (≈ 1.16750).
TP1: 1.16250
TP2: 1.16050
TP3: 1.15900 (major support zone)
🔹 Conservative Strategy
Wait for price to retest 1.16500 and show rejection before shorting.
🔸 Long Setup (Low Probability)
Only consider long if:
Price breaks the descending channel
AND Retests above 1.16650 with strong bullish confirmation.
Target if breakout occurs: 1.16800 – 1.17000.

Next Volatility Period: Around December 23rd
Hello, fellow traders!
Follow us to get the latest updates quickly.
Have a great day!
-------------------------------------
#BTCUSDT
To initiate a bullish trend, the price must rise above and sustain the OBV Low indicator level.
Considering the basic trading strategy of buying around DOM(-60) ~ HA-Low and selling around HA-High ~ DOM(60), the current price position represents a buying opportunity.
However, if the price falls between DOM(-60) and HA-Low, a stepwise downward trend is likely, so you should consider a response plan.
If the price falls below the DOM(-60) indicator, you should check for support around the 69000-73499.86 level.
This is because the 69000-73499.86 level represents an important support and resistance zone for sustaining an uptrend from a long-term perspective.
If the price declines from the 69,000-73,499.86 range, it is expected to form an uptrend around 42,000, a level never seen again.
-
If the price rises above the OBV Low indicator level and continues its upward trend, we should check for an upward breakout near the area circled on the chart.
If the price fails to break out, we should consider a response plan, as this could signal a full-blown bear market.
If the price continues to rise, the target levels are: - Right Fibonacci ratio 2.618 (133,889.92)
- Right Fibonacci ratio 3 (151,018.77) ~ 3.14 (157,296.36)
It is expected to re-establish the trend by rising near the above range.
The coin market is likely to experience a major bear market around the week of January 26, 2026.
-
Thank you for reading.
I wish you successful trading.
--------------------------------------------------
- Here's an explanation of the big picture.
(3-year bull market, 1-year bear market pattern)
I will explain more in detail when the bear market begins.
------------------------------------------------------

BTC Is Retesting the Breakout📊 (1) MARKET STRUCTURE
-BTC formed a strong bullish impulse from the Strong Support Zone, breaking above the descending trendline with a powerful breakout candle.
-This shifted the market structure from bearish → bullish on H1.
📉 (2) PRICE REACTION
After breaking out:
-Price tapped the Weak Support Zone (highlighted purple area)
-Buyers stepped in immediately — confirming support
-Price is now pulling back again into the same demand area
This shows bullish willingness to defend the zone.
📐 (3) HTF CONTEXT
This breakout aligns with broader bullish sentiment:
-BTC continues to create higher swing lows on H1.
-As long as price holds above the Weak Support Zone, the trend remains bullish.
🎯 (4) EXPECTATION
The most likely scenario:
📌 BTC dips into the Weak Support Zone → forms a higher low → rallies toward 94,000 – 95,200.
💥 (5) TRADING SIGNAL
BUY SETUP
Entry Zone:
92,200 – 92,600 (Weak Support Retest Zone)
Stop Loss:
Below 91,700
Take Profit Levels:
TP1: 93,171
TP2: 93,596
TP3: 94,091
Final Target: 95,200
Why this setup works
Strong breakout with volume
Clean retest into fresh demand
Higher-timeframe bullish structure
Buyers showing presence at every dip
This is a low-risk pullback entry inside a bullish continuation setup.

BTCUSD: Bullish OB Test Done Now Watch the Drop BTCUSD – Bullish OB Reaction & Potential Drop Setup
Price has tapped into a fresh Bullish Order Block, triggering a short-term push upward. But structure is showing signs of liquidity building above, meaning market may engineer one more liquidity sweep before a deeper move.
I’m expecting price to create a range, grab liquidity from the top, and then drop toward the strong support zone where multiple confluences align.
🧠 Key Points
🔸 Bullish OB tested – short-term reaction expected
🔸 Liquidity resting above current highs
🔸 Fake-out possible before a sharp bearish move
🔸 Strong support zone is my reversal area
🔸 Main target: 89,564 zone
📉 My Plan
I’m waiting for price to sweep liquidity above the OB → form bearish confirmation → then target the demand area below.
This setup combines liquidity, structure, OB, and support levels, giving high probability for a clean move.

Gold Just Flipped Structure.....The market just transitioned from a bearish sequence into early bullish structure. Most traders will miss this shift but if you understand BOS, ChoCH, and liquidity behaviour, this is where smart money prepares for the next leg up.
1. Market Structure Overview
Your chart shows a full bearish sequence (LH–LL) that has recently transitioned:
-Multiple Lower Highs (LH) and Lower Lows (LL) → clear bearish structure.
-A Change of Character (ChoCH) occurs at the key zone → first signal of reversal.
-A clean Break of Structure (BOS) to the upside confirms buyers stepping in.
-Price then creates a Higher Low (HL) followed by Higher Highs (HH) → early bullish trend established.
This is a textbook reversal from bearish → bullish.
2. Key Zones Identified
Support Zone (Demand)
Located around 4195 – 4174
→ This is where the ChoCH and HL formed, confirming buyer strength.
Resistance Zone (Supply)
Located around 4219 – 4229
→ Price is currently approaching this zone. If it breaks, bullish continuation is expected.
3. Price Behaviour & Expectation
Your yellow projection is correct:
- Price may pull back into the minor support (near current level).
- After that, a bullish leg toward 4219 zone is expected.
- If BOS occurs above 4229, price has room to expand toward new highs around 4238–4244.
This aligns perfectly with the HH → HL structure forming now.
4. Trading Logic
Why bullish?
- Clear BOS on bullish side
- Higher Low forming above support
- Liquidity taken from previous LL
- Price respecting the new bullish structure
Invalidation
If price breaks below 4174, bullish structure is invalidated.
5. Trade Signal
This follows your trading style — structure-based, clean, and logical.
📌 BUY ENTRY: 4203 – 4207
(Retesting minor support + inside new bullish structure)
📌 STOP LOSS: 4178
(Below HL and below ChoCH zone — strong invalidation)
📌 TAKE PROFIT 1: 4219
(Retest of resistance zone)
📌 TAKE PROFIT 2 (Main Target): 4229 – 4233
📌 TAKE PROFIT 3 (Extended Target): 4242 – 4244
Risk–Reward:
1 : 2.5 up to 1 : 4 depending on TP

EUR/USD Is Compressing — A Breakout Is Getting Close📊 (1) MARKET STRUCTURE
NZD/USD is moving inside a well-defined descending channel, creating:
Lower Highs
Lower Lows
However, the most recent bearish swings are shorter and losing momentum —
a signal that the downtrend is weakening.
📉 (2) PRICE REACTION
Every touch of the channel’s lower boundary triggers a visible reaction upward.
Recent candles show:
Smaller bearish bodies
Wicks rejecting the lows
Early signs of micro higher lows
These elements indicate absorption of sell pressure.
⏳ (3) HTF CONTEXT
On the H1 structure:
Price is sitting at the oversold edge of the channel
Momentum is compressing
The market is forming a tight consolidation zone
This compression phase often precedes a bullish breakout.
📐 (4) EXPECTATION
High-probability scenario:
Price may dip slightly to retest 0.5960 – 0.5965
A new higher low forms
Breakout of the upper channel line
Price extends toward 0.6025 – 0.6040
This is a textbook reversal from the channel floor.
🎯 (5) TRADING SIGNAL
BUY SETUP
Entry: 0.5960 – 0.5965
Stop Loss: Below 0.5940
Take Profit:
TP1: 0.5990
TP2: 0.6015
TP3: 0.6038 (breakout target)
Key Advantages
Weakening bearish momentum
Clean reactions from channel support
Tight compression before breakout
High R:R opportunity with controlled risk

BTC updates📌 Bitcoin Technical Analysis
🔻 Support Levels:
• 90,850 – First key support; holding above this level keeps short-term bullish structure intact.
• 88,650 – Major support; a breakdown could increase selling pressure.
• 85,907 – Strong support zone; losing this level would significantly weaken the bullish trend.
🔺 Short-Term Resistance:
• 93,539 – Immediate resistance; a breakout above this level may open the way for higher targets.

BTC at the upper boundary: mixed signalsThis analysis is based on the Initiative Analysis (IA) method.
Hello traders and investors!
On the 4-hour timeframe, an absorption pattern has formed at the upper boundary of the range. At the same time, a buyer zone begins immediately below, where a buyer reaction may appear.
On the daily timeframe, the structure remains within the same sideways range. The touch of the upper boundary came on a volume spike, and key volume was accumulated in the upper part of the range — which is a positive sign.
However, this daily candle has two details that raise questions:
First: the highest volume was accumulated around 90,400, not at the top of the candle.
Second: despite the volume spike, it was still lower than the volume during the previous touch of the upper boundary, when the buyer showed initiative.
Therefore, if considering a short here, I would do so only after a break below 89,500 and confirmation that the seller is defending this level.
For now, the stance is neutral: observing how the structure develops on the 1-hour and 4-hour timeframes.
Wishing you profitable trades!

BTC/USD (Bitcoin) LONG AND SHORT SET UPLong set up
Entry Price 1: $90,500
Entry Price 2: $86,500
Stop Loss: $83,500
Take Profit 1: $94,500 (Close 25%)
Take Profit 2: $97,500 (Close 50%)
Take Profit 3: $100,500 (Close 75%)
Take Profit 4: $110,500 (Close 100%)
Status: ACTIVE
Short set up
Entry Price 1: $92,500
Entry Price 2: $94,500
Stop Loss: $97,500
Take Profit 1: $90,500 (Close 25%)
Take Profit 2: $88,500 (Close 50%)
Take Profit 3: $86,500 (Close 75%)
Take Profit 4: $83,500 (Close 100%)
Status: ACTIVE

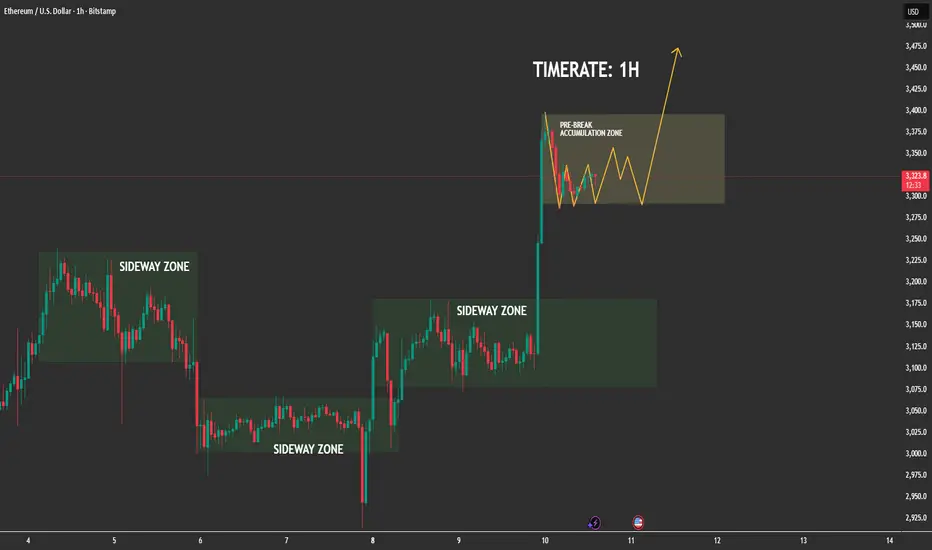
Ethereum Has Entered Its Pre-Expansion Accumulation📊 (1) MARKET STRUCTURE — CLEAN SIDEWAY → BREAKOUT → RE-ACCUMULATION
The chart shows a repeating pattern:
✔ Phase 1: Sideway Zone
ETH repeatedly compresses in sideways zones, forming liquidity pools and equal highs/lows.
✔ Phase 2: Breakout With Strong Momentum
Each sideways block ends with a powerful impulsive candle clear evidence of aggressive buy-side imbalance.
✔ Phase 3: Post-Break Re-Accumulation (CURRENT PHASE)
Price is now inside the highlighted pre-break accumulation zone,
moving in a tight, controlled structure a textbook bullish continuation setup.
This is the phase where institutional traders rebalance orders before the next run.
📍 (2) PRICE BEHAVIOR — BULLS IN FULL CONTROL
-No sharp rejections after the breakout
-Dips are shallow and quickly absorbed
-Market is forming higher low micro-structures
-Momentum clearly stays in the hands of buyers
This confirms the market is not distributing, but absorbing liquidity and building a base.
🌐 (3) MACRO FACTORS SUPPORTING ETH UPSIDE
✔ ETH ETF Approval Momentum (US + Asia)
Regulatory mood continues shifting positively, with multiple jurisdictions preparing Ethereum ETF products. Institutional demand keeps increasing quietly in the background.
✔ Falling US Inflation & Dovish Fed Expectations
Recent CPI and PPI reports show cooling inflation. The market widely expects 2025–2026 rate cuts, which historically push liquidity into risk assets ETH benefits directly.
✔ Ethereum Supply Shock
-Over 27% of ETH is staked
-Net supply remains deflationary under high network activity
-Reduced exchange reserves signal accumulation
This creates a tightening supply environment that amplifies price expansion.
✔ Altcoin Rotation Phase
BTC dominance stabilizing → capital increasingly flows into ETH and large-cap alts.
Macro + on-chain + liquidity flows all align with a bullish continuation.
⏳ (4) HTF CONTEXT — BULL CYCLE CONFIRMED
Higher timeframes show:
-ETH broke out of a weekly compression range
-Structure is fully bullish
-Market currently resetting before next leg
-No bearish reversal signals anywhere in sight
This supports the thesis that the current 1H accumulation is not random, it is part of a much larger bullish leg forming.
🚀 (5) EXPECTATION — HIGH PROBABILITY SCENARIO
ETH is expected to:
-Continue oscillating inside the pre-break accumulation zone
-Form a series of small higher lows as drawn
-Absorb liquidity from both sides
-Break out toward 3,400 → 3,450+
The path of least resistance remains upward.
🎯 (6) TRADING INSIGHT (Non-Signal)
Markets only explode after liquidity is collected.
ETH is doing exactly that holding strong after a breakout and compressing before expansion.
This is the signature behaviour of a healthy bullish trend.