How to build Discipline & Structured Trading HabitsDiscipline is not something you rely on in the moment; it is something you build through habits that remove emotional decision-making from your trading process.
1. Define Rules Before You Trade
Traders without predefined rules rely on emotion. Traders with rules rely on structure.
Clearly define your entry criteria, risk per trade, maximum daily loss, and exit strategy.
When these rules exist before the session starts, you eliminate most impulsive behaviors.
2. Limit Your Daily Decisions
Every decision drains mental energy. The more choices you make, the weaker your discipline becomes.
Reduce the number of markets you watch, the number of setups you take, and the amount of chart time you expose yourself to.
Fewer decisions lead to higher-quality decisions.
3. Use a Pre-Session Checklist
A checklist forces you into a disciplined routine. It can include:
• Reviewing your trading plan
• Checking upcoming news releases
• Confirming your bias or market conditions
• Ensuring your risk settings are correct
The act of going through the checklist prepares your mind to follow structure.
4. Implement a Hard Stop for the Day
One of the fastest ways to lose discipline is to trade while emotional.
Set a maximum daily drawdown. Once it is hit, the session ends. No exceptions.
This protects both your capital and your psychology.
5. Track Your Rule Breaks
Most traders only track wins and losses. Disciplined traders also track deviations.
Write down every time you break a rule, why it happened, and how you plan to prevent it next time.
Over time, this builds awareness and accountability.
6. Delay Impulsive Actions
If you feel the urge to jump into a trade that does not fit your plan, delay the action by 30 to 60 seconds.
Impulses lose power quickly. By introducing a pause, you give your rational mind time to regain control.
7. Keep Your Environment Clean
Distractions destroy discipline.
Silence notifications, close irrelevant tabs, and avoid multitasking.
A clean trading environment supports clean decisions.
8. End Each Session With a Routine
A consistent end-of-day routine reinforces discipline. Examples:
• Rating your discipline on a scale from 1 to 10
• Reviewing whether you followed your rules
• Logging emotional triggers
Ending the day with structure makes it easier to begin the next one with structure.
Conclusion
Discipline is not built through motivation but through habits that create consistent behavior. A structured trading routine removes uncertainty, minimizes emotional influence, and helps you operate like a professional rather than a reactive participant.
BTC-D
BTC long-term TAIt's been a while since the lasts posts, let's keep it up!
Bitcoin is entering an extreme bearish area on weekly time frame, the uptrend that lasted since March 2023 has been officially broken. The recovery may take anywhere between 6 to 12 months, no one can tell precisely but it's going to take some time.

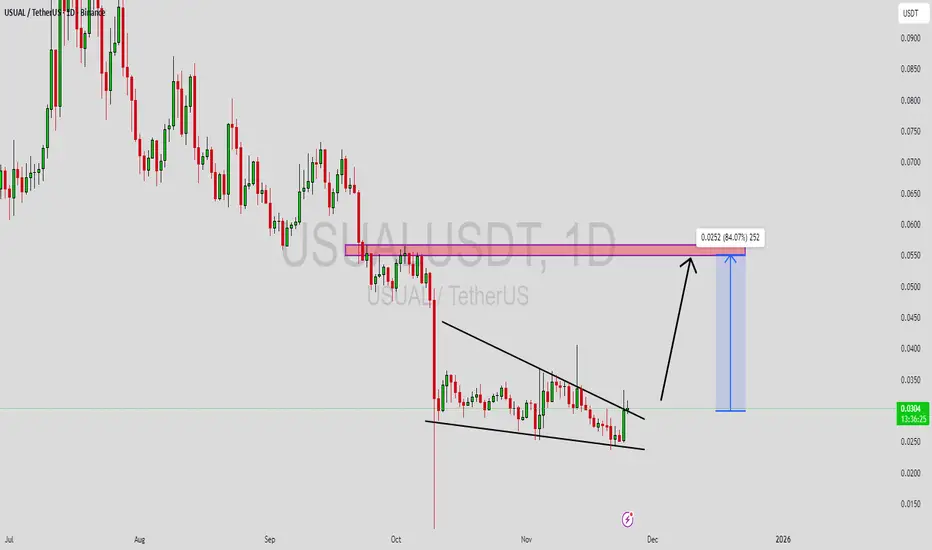
USUALUSDT ReadyUSUALUSDT is forming a clear falling wedge pattern, a classic bullish reversal signal that often indicates an upcoming breakout. The price has been consolidating within a narrowing range, suggesting that selling pressure is weakening while buyers are beginning to regain control. With consistent volume confirming accumulation at lower levels, the setup hints at a potential bullish breakout soon. The projected move could lead to an impressive gain of around 40% to 50% once the price breaks above the wedge resistance.
This falling wedge pattern is typically seen at the end of downtrends or corrective phases, and it represents a potential shift in market sentiment from bearish to bullish. Traders closely watching USUALUSDT are noting the strengthening momentum as it nears a breakout zone. The good trading volume adds confidence to this pattern, showing that market participants are positioning early in anticipation of a reversal.
Investors’ growing interest in USUALUSDT reflects rising confidence in the project’s long-term fundamentals and current technical strength. If the breakout confirms with sustained volume, this could mark the start of a fresh bullish leg. Traders might find this a valuable setup for medium-term gains, especially as the wedge pattern completes and buying momentum accelerates.
✅ Show your support by hitting the like button and
✅ Leaving a comment below! (What is your opinion about this Coin?)
Your feedback and engagement keep me inspired to share more insightful market analysis with you!
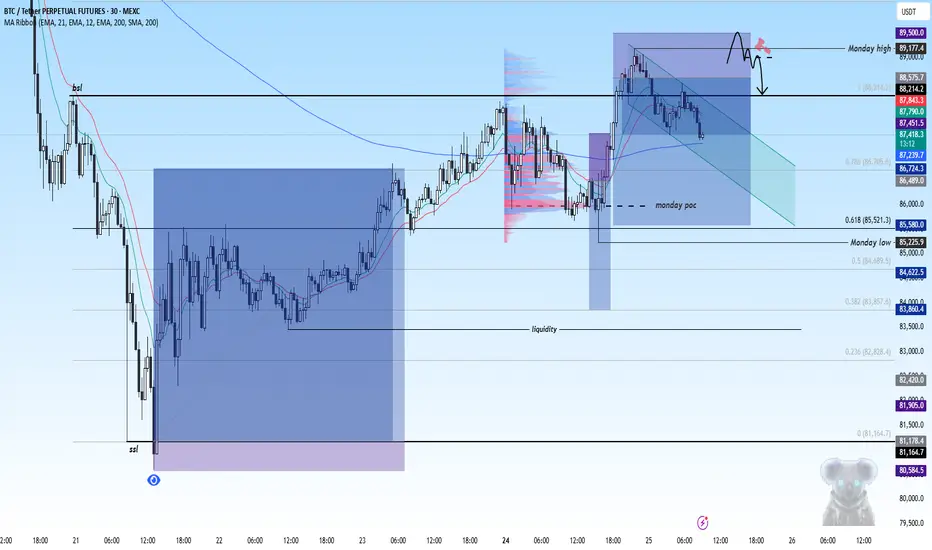
Bitcoin short scalpTaking partial profits here on $BTC...
Keep an eye on the monday range... Will add/re-enter if #Bitcoin sweeps monday high and get back in the range again...
#trading #CryptoMarket #BTC
BTC - NEW ATH in December or DROP?Hello BTC Watchers 📈
Bitcoin has, historically, been very bullish in Decembers. We see the most drastic increase in 2020, when BTC climbed over 140%.
During the times that BTC corrected over December, it's been 10% and 31%.
This makes it hard to predict seeing that it seems to be different every year with one year even trading in a tight range.
A few things we can do to clarify the possible direction of BTC This December:
1️⃣ Check the Macro
From a macro perspective, Bitcoin has increased and been increasing since April, with the hard drop only showing now in November.
This could mean two things - the correction before a final leg up or, the beginning of the bearish cycle.
2️⃣ Check Technical Indicators
a) The moving averages is pointing towards short-term BEARISH, since we are trading UNDER the 200d Moving averages(green line):
b) The Bollinger bands are showing an expansion (aka widening) but to the bottom, as the price is trading on the lower BBands, also indicating strong selling pressure for the short to near term:
3️⃣ Watch the News
Bitcoin has been coming up in many seemingly "bullish" articles. This is usually a bad sign before the liquidation - create hype, and then short the market.
Conclusion:
I'm leaning towards a soft pump in December to soften the blow of the current correction , but not a new ATH. The next increase will likely be a "fake-out" before the real bearish season starts in the new year.

Bitcoin Market Truth: Whales, Corrections, and the BraveHello my friends,
I have carefully analyzed Bitcoin for you.
Markets never move straight up; they progress with corrections. Whales often take profit along the way. Think of it like running a supermarket: you buy apples at the cheapest price so that when customers purchase from you, you make a profit. Whales use the same logic. They trick people into thinking prices are falling, but in reality, their goal is to balance supply and demand. They feed on the losses of others.
For me, the most suitable buying zone is between 85,000 and 74,000 dollars. From this range I will enter the trade, with my first target at 107,000 and my second target at 120,000 dollars.
This business belongs to the fearless and the brave. If you act out of fear of losing money, this is not for you. Those who cannot manage risk should look for other paths.
My dear friends, every single like you give is my greatest motivation to continue sharing these analyses. Thank you to all who support me—you are the reason I keep going.
Each of my followers is like family to me, never forget that.
⚠️ And remember this: In trading, don’t trust everyone who calls themselves a “trader.” Most of the people you follow don’t earn a cent in their real accounts. This is not an easy business. Around 90% of people lose consistently, while only about 10% make money regularly. Many YouTubers or influencers you see online don’t actually profit with their real money. In fact, some of the celebrities you follow come to me asking for analysis. I won’t expose names, but these are the facts.
Respect and love

Bearish momentum to continue?Bitcoin (BTC/USD) is reacting off the pivot which is a pullback resistance and could reverse to the 1st support.
Pivot: 89,178.40
1st Support: 81,214.21
1st Resistance: 93,070.41
Disclaimer:
The opinions given above constitute general market commentary and do not constitute the opinion or advice of IC Markets or any form of personal or investment advice.
Any opinions, news, research, analyses, prices, other information, or links to third-party sites contained on this website are provided on an "as-is" basis, are intended to be informative only, and are not advice, a recommendation, research, a record of our trading prices, an offer of, or solicitation for, a transaction in any financial instrument and thus should not be treated as such. The information provided does not involve any specific investment objectives, financial situation, or needs of any specific person who may receive it. Please be aware that past performance is not a reliable indicator of future performance and/or results. Past performance or forward-looking scenarios based upon the reasonable beliefs of the third-party provider are not a guarantee of future performance. Actual results may differ materially from those anticipated in forward-looking or past performance statements. IC Markets makes no representation or warranty and assumes no liability as to the accuracy or completeness of the information provided, nor any loss arising from any investment based on a recommendation, forecast, or any information supplied by any third party.

BTCUSDT.P - November 25, 2025Bitcoin is in a corrective phase within a longer-term downtrend, with price recently rejected from the 89,500 resistance area and now trending lower. The chart highlights a short trading range between a defined stop level near 89,500 and a profit level at 85,721, aligning closely to horizontal support and resistance. Current price action and momentum favor sellers, as the market presses toward lower support with weak upward retracement. A break below support could accelerate selling toward the next downside target, while reclaiming resistance might shift bias to a short-term reversal.

BITCOIN FREE SIGNAL|SHORT|
✅BTCUSD tapped supply and left a clean VFG inefficiency above the rejection wick. A return into that VFG for refinement offers optimal entry, aligning with bearish order-flow toward sell-side liquidity below.
—————————
Entry: 88,900$
Stop Loss: 90,154$
Take Profit: 87,164$
Time Frame: 2H
—————————
SHORT🔥
✅Like and subscribe to never miss a new idea!✅

Weekly and Monthly Forecast
Hello, fellow traders!
Follow us to get the latest information quickly.
Have a great day!
-------------------------------------
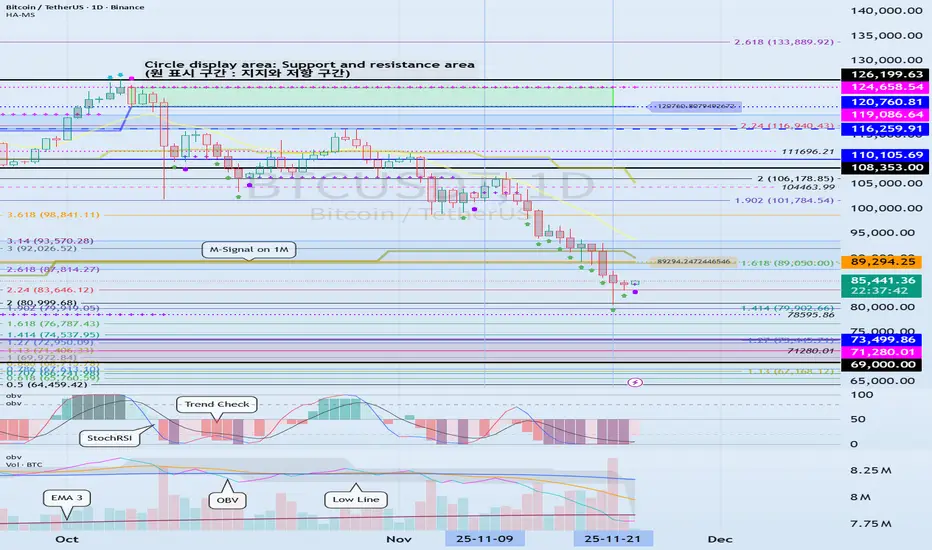
(BTCUSDT 1D chart)
The volatility period has ended.
The key is whether it can rise above 89294.25.
If not, we need to check for support near 69000-73499.86.
(1W chart)
The following are important areas as the price falls below the third range:
- 116259.91-119086.64
- 87814.27-93570.28
- 69000-73499.86
A decline below the 69000-73499.86 range can be considered a long-term downtrend, so this is a very important area for now.
Therefore, as the price approaches the 69000-73499.86 range, we need to check for increased trading volume or the emergence of a new HA-Low indicator on the 1W chart.
If the HA-Low indicator is formed, it's important to determine whether there's support near it.
The basic trading strategy is to buy in the DOM(-60) ~ HA-Low range and sell in the HA-High ~ DOM(60) range.
If the price rises near the HA-Low indicator and moves toward the HA-High indicator, the wave should be considered closed (reset).
Conversely, if the price falls near the HA-High indicator and moves toward the HA-Low indicator, the wave should also be considered closed (reset).
A closed (reset) wave means that the trend has been reestablished.
Therefore, as mentioned earlier, the basic trading strategy is created.
However, if the price rises in the HA-High ~ DOM(60) range, a stepwise uptrend is likely, while if the price falls in the DOM(-60) ~ HA-Low range, a stepwise downtrend is likely.
The end of a stepwise uptrend is a decline, and the end of a stepwise downtrend is a rise.
Therefore, a decline after encountering the HA-Low indicator is different from a decline after encountering the HA-High indicator.
Therefore, a stepwise downtrend indicates a period of truncation buying, while a stepwise uptrend indicates a period of truncation selling.
During a stepwise downtrend, even if the price declines, there's an expectation that a price increase will occur soon, so you can increase the number of coins (tokens) representing profit.
This method involves trading at each purchase price and selling the same amount of coins (tokens) when the price rises, thereby increasing the number of coins (tokens) representing profit.
The coins (tokens) representing profit are those with a purchase price of 0, which can lead to significant profits later.
-
A bullish trend can be considered when the price rises above the M-Signal indicator on the 1M chart and holds.
However, the point where you should actually buy is when the price rises above 108353.0.
Based on the current trend, the next volatility period is expected around December 23rd.
Therefore, you should check to see if the price holds above 89294.25 during the next volatility period.
Therefore, it appears likely that the price will move sideways to reverse the trend.
Based on the price movement, the start of a major bear market is expected to begin after the first quarter of next year.
However, if the price falls below 69000-73499.86, you should consider this a bear market and consider a response plan.
-
Thank you for reading to the end.
I wish you successful trading.
--------------------------------------------------
- Here's an explanation of the big picture.
(3-year bull market, 1-year bear market pattern)
I'll explain more in detail when the bear market begins.
------------------------------------------------------
BTC/USDT 4H Chart Review1. Local trend
The chart shows:
✔️ Clear upward trend - the price respects the rising trend line (black diagonal).
✔️ The last candle broke strongly upwards, which suggests bullish momentum.
⸻
🟢 Key resistance levels (green lines)
1. 90,352 USDT - the first stronger resistance (it looks like the price is just reaching it).
2. 93,271 USDT - another strong resistance; there may be a clearer sell-off here.
➡️ If it breaks 90,352 with high volume, the path to ~93k is open.
⸻
🔴 Key support levels (red lines)
1. 86,890 USDT - Local Support/Trendline Retest.
2. 84,989 USDT - Stronger support.
3. 82,545 USDT - key support for the growth structure.
➡️ Loss of 86,890 + breakout from the trendline may mean a correction to around 85,000.
⸻
📉 RSI / Stochastic (bottom of the chart)
Stochastic RSI is:
✔️ In the growth phase
✔️ Approaching overheating level (80-100)
➡️ This often means that the upside momentum continues, but a local correction may be imminent, especially at the 90,352 resistance.
⸻
📌 Summary
🔼 Bullish Signals:
• Uptrend intact
• Breakout with an upward impulse candle
• The price is rebounding from the trend line
🔽 Bearish Signals:
• Stochastic RSI is approaching the “high” zone
• The price is under important resistance at 90,352
• Local pullback possible if resistance is not broken
⸻
⭐ Short-term scenarios (4H)
👉 Bullish scenario
• Maintaining price above 88,800-89,000
• Breakout 90,352
➡️ Target: 93,000 – 93,300 USDT
👉 Bears scenario
• Rejection from 90,352
• Back below 88,900
➡️ Downside target: 86,900 → 85,000 USDT

Everyone Gave Up on ETH – Perfect, Disbelief Phase ActivatedThe sentiment in crypto right now is as bad as—if not worse than—during the COVID crash or the FTX collapse. Anyone who was around back then remembers the “this is the end of crypto” vibes. It always feels apocalyptic in these moments, and this time is no exception.
Yet the fear index is hitting lows we haven’t seen since COVID… while Bitcoin is sitting between 80k and 100k. That combination is almost comical. History shows that when despair peaks like this, what feels like the end is usually just the beginning.
The chart above is a bar-pattern fractal on ETH I’ve been tracking privately for nearly a year. The moment I finally published it, price deviated hard—classic lol
Zooming in, here’s my current road map assuming we’re headed into a proper bull market in 2026:
- We just finished Wave 2
- Wave 3 (the longest and strongest) is starting now
→ Top around May 2026 at ~$11,000
→ Wave 4 retraces ~50% of Wave 3, retesting the previous ATH zone
→ Wave 5 takes us to $18,000–$25,000 sometime in Q4 2026 or early 2027
Invalidation level?
In the last two cycles, the real bear market began when price repeatedly rejected and failed to reclaim the 0.5 Fibonacci level. A clean break and hold above that zone has always kept the bull alive.
I’ve also been watching the Russell 2000 as a macro confirmation .
No breakout yet, but notice the deep pullbacks it always has right before the eventual clean break higher. We’re following the exact same script.
Conclusion
Technicals are still noisy and not fully confirmatory, but sentiment is screaming. Capitulation is extreme—90%+ of people have thrown in the towel. My inbox and comment sections are filled with “you’re insane” and “what are you smoking” messages. That level of universal bearishness, combined with the price action we’re seeing, is one of the strongest contrarian buy signals you can get.
When everyone is this convinced it’s over, going against the herd is usually the right play.

Bitcoin 2 Week RSIBitcoinUSD 2 Week stock RSI (14 period close)
The current level has been associated with 50-60% corrections in all of the past cycles
Bitcoin doesn't repeat patterns forever, just until enough people have noticed them
If this pattern does continue, a rapid and large correction could be imminent
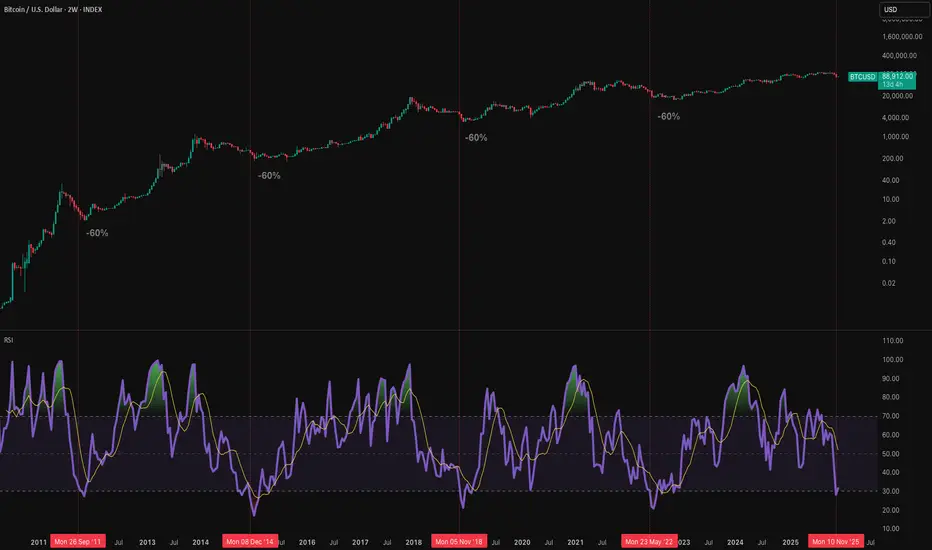
BITCOIN The Bear Cycle's High Volatility period has just begun..Bitcoin (BTCUSD) closed last week brutally below its 2W MA20 (red trend-line) and has started this week off with the first signs of a potential rebound. We explained on previous analyses the dynamics of the 1W MA50 bearish closing as well as the rebound potential on the 1W MA100 but today are looking at what this 2W MA20 bearish closing means.
First of all, observe for a moment the remarkable symmetry between the 2W MA20 bearish closings across all Bear Cycles. The date range between the March 31 2014 and March 26 2018 2W MA20 closings was 104 candles (1456 days), March 26 2018 and December 06 2021 was 97 candles (1351 days) and December 06 2021 and today's November 10 2025 was again 103 candles (1435 days).
As you can see on two of those three occasions, BTC initially rebounded above the 2W MA20 again but then got rejected back below and consolidated while turning the 2W MA20 into its main Resistance for the rest of the Bear Cycle. In 2022 it just fell below it and consolidated for 4 months before getting violently rejected to new Lows.
As a result, given also the amazing symmetry of the 2W RSI sequence among those fractals, we still expect the market to potentially deliver the first counter-trend rally (limited) of the Bear Cycle, namely 'Santa's Rally' but then get strongly rejected below the 2W MA20 again.
We call this the start of the 'Bear Cycle's High Volatility Period' and needless to say, it is the phase where due to the aggressive ups and downs in range, most traders/ investors can potentially get trapped. Following Bitcoin's 4-year Cycle Theory (and our 2020 Golden ratio) has historically never let us down and until invalidated will continue to be the way to go for us.
So do you think BTC is entering a brutal High Volatility period? Feel free to let us know in the comments section below!
P.S. For reference take a look at our legendary 2020 Golden 51%-49% Ratio, viewed 400k times on TradingView and its 2024 update to see how well macro Cycles work at timing (entries and exits on) the market:
---
** Please LIKE 👍, FOLLOW ✅, SHARE 🙌 and COMMENT ✍ if you enjoy this idea! Also share your ideas and charts in the comments section below! This is best way to keep it relevant, support us, keep the content here free and allow the idea to reach as many people as possible. **
---
💸💸💸💸💸💸
👇 👇 👇 👇 👇 👇

XAUUSD Daily – Five-Wave Impulse Toward 4,530On the XAUUSD daily chart I’m tracking a potential five-wave advance within the existing uptrend.
Wave (1)** marks the initial impulsive leg higher from trendline support
Wave (2)** is the corrective pullback that holds above the origin of wave (1) and respects the rising trendline
Wave (3)** extends beyond the wave
(1) high, confirming continuation of the bullish structure and establishing a new swing high.
* Price is now correcting as **wave (4)** back into the area of:
* the rising trendline drawn from prior lows, and
* the former consolidation / breakout zone around the previous highs.
While price holds above the wave (4) low and the trendline, I’m anticipating a continuation leg to the upside as **wave (5)**.
The projected wave (5) objective is around 4,527, where I have a confluence of measured extension and overhead resistance.
A decisive daily close below the wave (4) low and trendline support would invalidate this wave count and delay the bullish scenario.

There is a chance BTC can return the 80K zone - Data should confEven with the increase from 80K zone to up 86.7K, BTC is able to return from this zone into the breakdown trend, where this will go exactly the coming time frames, which should be confirmed with time. We need to confirm this, the data change, and the last data shows a bitcoin that can get a correction again.

BTCUSDT trade on a small 4-hour timeframeI've seen the latest news and funds may continue to reduce their positions in Bitcoin through spot ETFs, which will push old OG investors to another sell-off. Anyway, I think we are almost on the way to finish this huge correction and it's just a matter of the time when BTC will get back to growth, one thing I can say confidently is that we aren't in the bearish market yet, there will be at least another pump and huge growth until we dive into a bearish market. Seeing what Trump is doing right now and how much he is going to giveaway, we just have to be patient.

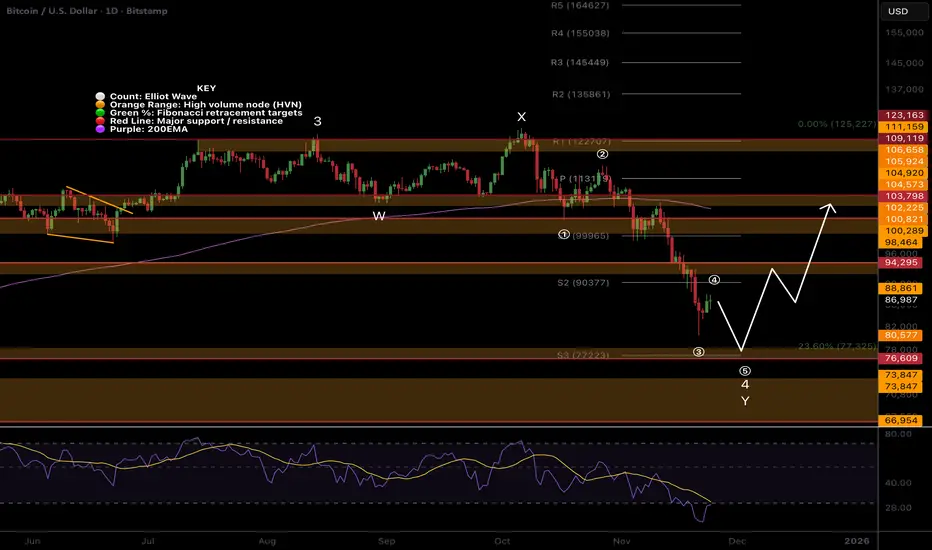
Bitcoin, one more push lower then all time highPrice dropped hard in wave Y of a flat correction, which is expected. Sentiment is at an all-time low for the longest time on record.
This complex correction looks almost complete at the S3 daily pivot, where I bought, but I am giving it room for one more push lower to complete 5 waves down for Y.
Price is well below the daily 200EMA, which will offer some resistance on the way back up. For now, the trend is down, so further downside is the higher probability.
📈 Daily RSI has reached oversold with no divergences. This is where all other ranges bottomed, and the price went on to make new highs.
👉 Continued downside brings up the next High Volume Node at $76000
Safe trading
BTC — Weekend Recovery? (Because Why Not)Alright, here’s the situation:
I still think BTC has room to slide lower…
BUT a little weekend recovery bounce is totally on the menu too. 🍽️
And honestly — if we’re gonna try something slightly questionable,
the weekend is the perfect time.
Low liquidity, no ETF outflows, no institutional adults in the room…
Just pure, unfiltered crypto chaos. 😌
So yeah, let’s poke the market and see if BTC wants to behave.
Could we catch a nice weekend bounce?
Could it dump straight through the floor instead?
Absolutely on both counts. 😅
Let’s see. Stay safe degens. 🧡📉🔥
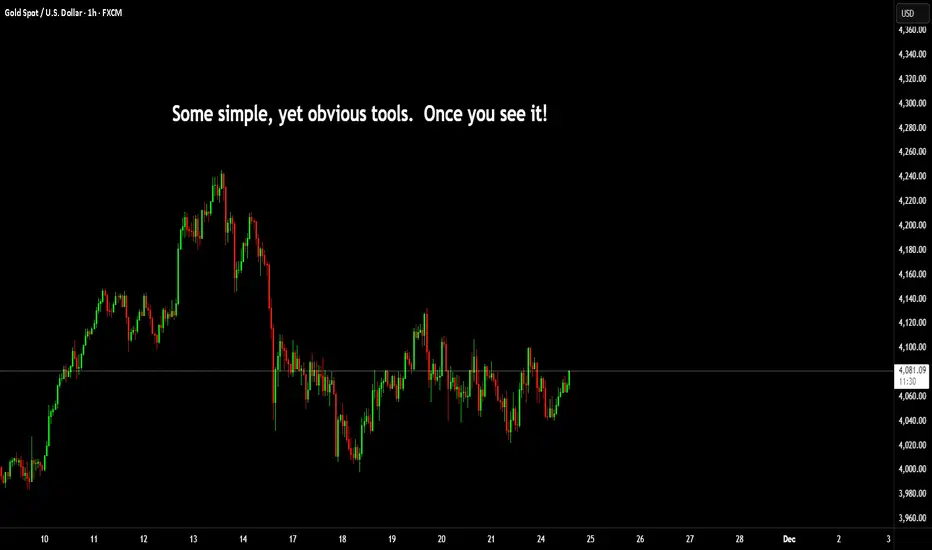
Very useful techniques to learnI have recently posted several posts around mechanical and simple charts. This is another insight into some professional techniques that are not often shown.
Gann talked about High and low candles and opposing ticks.
Lowest Tick of the Highest Bar: This refers to the lowest price point (or low tick) of the highest price bar (or highest price period) on the chart. It indicates a crucial support level. If the price falls below this point, it may signal a downward trend or a breakdown.
Highest Tick of the Lowest Bar: Conversely, this refers to the highest price point (or high tick) of the lowest price bar (or lowest price period). This represents a key resistance level. If the price rises above this level, it may indicate an upward trend or a breakout.
Here's an image showing this in an uptrend.
And another for a downtrend.
Then what you would expect from this, would be a move similar to this and of course you can't expect it every time. But to appreciate it, you need to understand the logic as to why this is important in the first instance.
The simple explanation of that is in an uptrend that lowest tick of the highest bar was in fact the exact area buyers failed and sellers took control. Obviously, the inverse is true of a downtrend. The highest point of the lowest candle, means buyers are back pushing prices higher.
Into the future you MIGHT but not always see these levels as support or resistance.
When you overlap this with the mechanical techniques, you can use this for range entries. Here's a post on mechanical techniques.
==========================================
Second tip is to do with volume.
Many people seem to have volume on their chart, but don't really know how to utilise it.
Now, imagine the areas I mentioned in the first tip. As price nears these zones (other other zones) order blocks, supply or demand, fib levels.
If you could quickly identify what story volume is trying to tell you. Then there is a huge benefit to know how you need to react to the price action.
In this image; Look at the spikes in volume until the orange arrow point.
What you can see from this next image, is the orange arrow is the turning point.
For it's next stop after breaking through the PoC of the range from the prior low to its high. You can draw a line, extended from the highest tick of the lowest candle.
Price comes back, and as explained in the example above. Buyers step back in and drive the price directly away from this level.
Now; let's go one step further.
In this image I have the volume profile on the left representing the swing low to high and then the profile on the right from that high to the fresh swing low.
You can see from the sell side pressure where price has interest to both parties.
Next you have both lines drawn on the chart of the opposing candles, like this.
Here. we can look at if the market is seeking outside or inside liquidity.
However, if you look back at the volume on the bottom of the chart. Are we seeing green candles and volume increasing? or red candles with volume increasing? This is where the second tip becomes very, very useful.
If you can identify the phase of internal or external, areas of interest. You can confirm this with volume clues on the chart and you will find yourself on the right side of the trade more often than not.
Have a great week all!
Disclaimer
This idea does not constitute as financial advice. It is for educational purposes only, our principal trader has over 25 years' experience in stocks, ETF's, and Forex. Hence each trade setup might have different hold times, entry or exit conditions, and will vary from the post/idea shared here. You can use the information from this post to make your own trading plan for the instrument discussed. Trading carries a risk; a high percentage of retail traders lose money. Please keep this in mind when entering any trade. Stay safe.
TradeCityPro | Bitcoin Daily Analysis #230👋 Welcome to TradeCity Pro!
Let’s move on to today’s Bitcoin analysis. A new week has finally begun, and Bitcoin may once again start a strong momentum-driven trend.
⏳ 1-Hour Timeframe
Yesterday, Bitcoin continued its corrective upward move and retraced up to the 0.5 Fibonacci level.
✨ This level is extremely important — both in Fibonacci analysis and across many technical styles — and it can determine how the next major price wave forms.
✔️ For now, the price has been rejected from this level and has made a small downward move.
If the bearish movement continues, we can consider opening a short position on Bitcoin.
💥 Breaking 85,209 will be the first confirmation of a bearish trend.
Breaking 82,214 will be the main confirmation that a new downward trend has begun.
📊 If the market continues deeper corrections to the upside, the main resistance zone remains 89,000.
🔔 A stabilization above 89,000 will be the first confirmation of a new bullish trend beginning.
The full confirmation of a bullish reversal will come only after the 93,555 level is broken.
❌ Disclaimer ❌
Trading futures is highly risky and dangerous. If you're not an expert, these triggers may not be suitable for you. You should first learn risk and capital management. You can also use the educational content from this channel.
Finally, these triggers reflect my personal opinions on price action, and the market may move completely against this analysis. So, do your own research before opening any position.

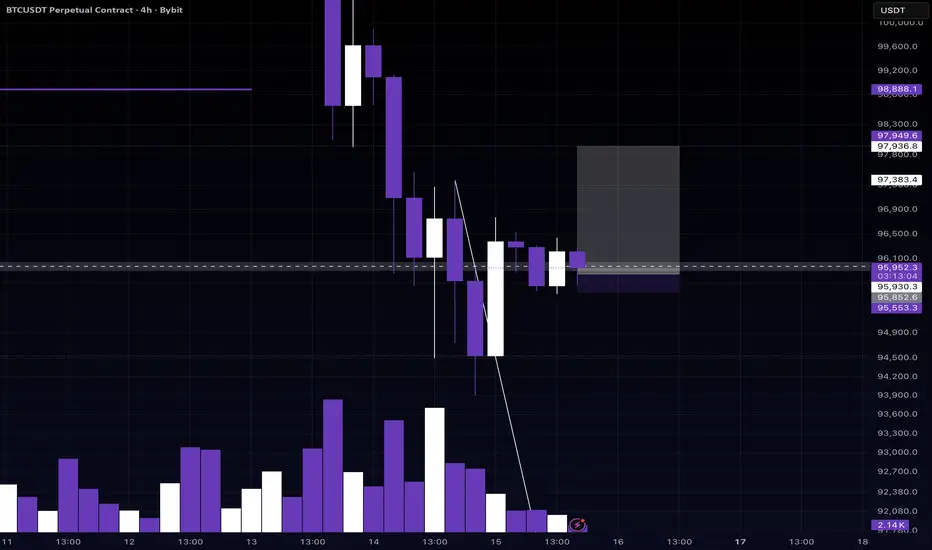
$BTC Dead-Cat Bounce?Bitcoin tapped 88k after a sharp drop from 80.6k, showing a short-term recovery off the recent low. Relief rallies like this are common and don’t instantly confirm a bullish reversal.
On the 8-hour chart, price is starting to form a mini-range at this zone, similar to what we saw after the November 5 drop. The key area to watch now is the 84–82k region, we have a CME gap that might get filled around 84k as well. Any bounce from here has room to retest 90k or even push toward the yearly open at 94–96k.
However, the broader downtrend structure stays intact until CRYPTOCAP:BTC can reclaim the 94–96k zone.

BTC/USDTFollowing the OTE pullback, price has corrected into the discount zone.
If the market provides proper confirmation signals, this area may offer valid long opportunities.
