Today’s Market Rhythm Is All About Precision Entries1. Market Volatility
Gold continues to move in a clean “adjustment rhythm,” reflecting an intraday environment where price is fluctuating inside a bearish structure but still producing technical pullbacks.
Volatility isn’t explosive but it’s precisely enough to create high-accuracy entry zones for intraday traders.
2. Trader Psychology
This is the phase where traders often get trapped by small pullbacks or emotional entries.
But those who understand the money flow can clearly see that price is simply cycling liquidity and adjusting before the next move.
Discipline beats emotion especially in timing-based trading.
3. Key Drivers / Market Reasoning
Market structure maintains:
-A slightly bearish overall trend
-Pullbacks acting as liquidity grabs, not true reversals
-Strong liquidity concentration around 4150–4160
-A clear institutional reaction zone at 4237–4240
Based on current flow, both intraday setups perfectly align with the market’s liquidity map.
4. Trading Strategy
📌 SETUP 1: Timing SELL Zone
XAUUSD SELL ZONE: 4237 – 4240
TP: 4234 – 4229
SL: 4244
➡️ This is a trend-following setup.
4237–4240 acts as a liquidity pocket where price tends to sweep before continuing downward.
The previous A–B–C wave structure supports this downward continuation.
📌 SETUP 2: Timing BUY Zone
XAUUSD BUY ZONE: 4147 – 4150
TP: 4153 – 4158
SL: 4143
➡️ This is a counter-trend setup but perfectly aligned with liquidity behavior.
4147–4150 is a key reaction zone a short-term liquidity base where buyers actively step in.
⚠️ Capital management is essential for both setups to maximize efficiency and protect your account.
5. Trend & Price Outlook
Gold is moving within an intraday correction structure, but the broader bias still leans bearish.
Today’s two timing zones highlight the highest-probability opportunities:
SELL 4237–4240: the ideal rejection area
BUY 4147–4150: short-term corrective demand zone
The previous A–B–C model remains valid, showing that price is completing its adjustment phase before seeking liquidity.
If you follow the rhythm you’ll always be a step ahead of the market.
When timing aligns with structure, intraday trading becomes effortless
BTC-D

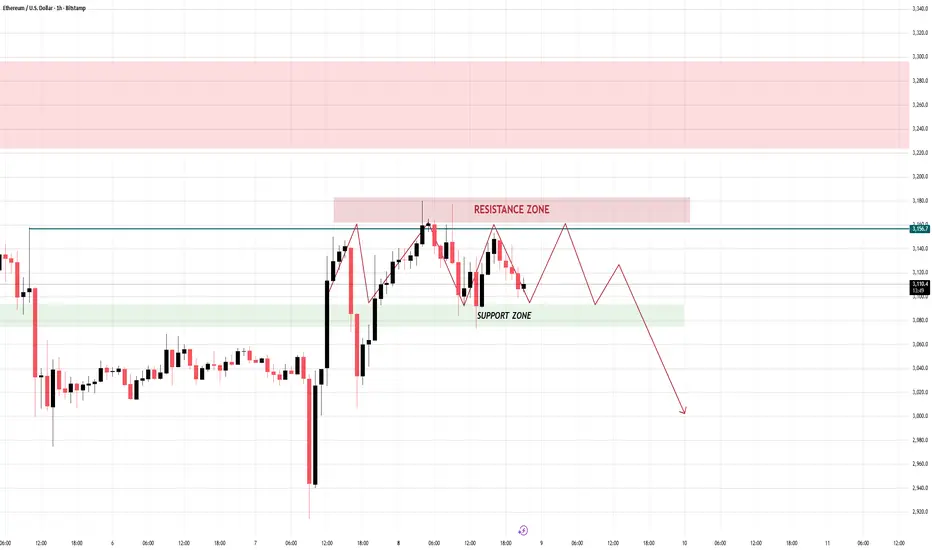
ETH Is Setting Up Something Big…1. Market Structure Overview
ETH is currently trading between two important HTF zones:
- Resistance Zone: 3150 – 3180
- Support Zone: 3050 – 3080
Price recently created a lower high rejection inside the resistance zone and is now pulling back toward support, signaling early weakness.
The overall structure shows:
- Short-term bullish push, but failing to break resistance
- Formation of LH → LL → LH, indicating bearish momentum emerging
- Market is compressing, preparing for a larger directional move
This aligns with the transition phase where liquidity is being collected before a breakout — typically to the downside.
2. Technical Analysis
Here’s what the chart reveals:
A. Resistance Rejection
Price tapped directly into the 3150–3180 resistance zone, leaving a long wick followed by impulsive selling.
→ This confirms strong sell-side presence.
B. Weak Bullish Recovery
The bounce from support lacks strength:
- Candles are smaller
- Momentum slowing
- Lower highs forming
This reflects a market losing bullish pressure.
C. Bearish Structure Development
The zig-zag projection shown matches current behavior:
- Price likely retests 3150
- Forms another Lower High
- Then breaks down sharply toward deeper support
D. Liquidity Map
- Liquidity sits below 3050
- Market is likely to sweep this level before strong buyers step in
→ Expect a liquidity grab before any major reversal.
3. Trading Plan (Entry – SL – TP)
🎯 SELL Setup (High-Probability)
Entry: 3145 – 3160
Stop Loss: 3188
Take Profit 1: 3080
Take Profit 2: 3020
Final Target: 2980
Reason:
Price is forming clean LH structure at resistance + bearish rejection → ideal position for swing short.
⚠️ Alternate Scenario (If invalidation occurs)
If price closes above 3190 on H1 → bearish idea invalid.
→ Stay out and wait for a bullish retest to re-enter long.
4. Summary
ETH is showing strong signs of distribution at resistance. The market is forming Lower Highs and preparing for a deeper decline toward the 2980 zone. The most optimal play is a sell entry at the resistance rejection, with tight SL and clear profit targets.
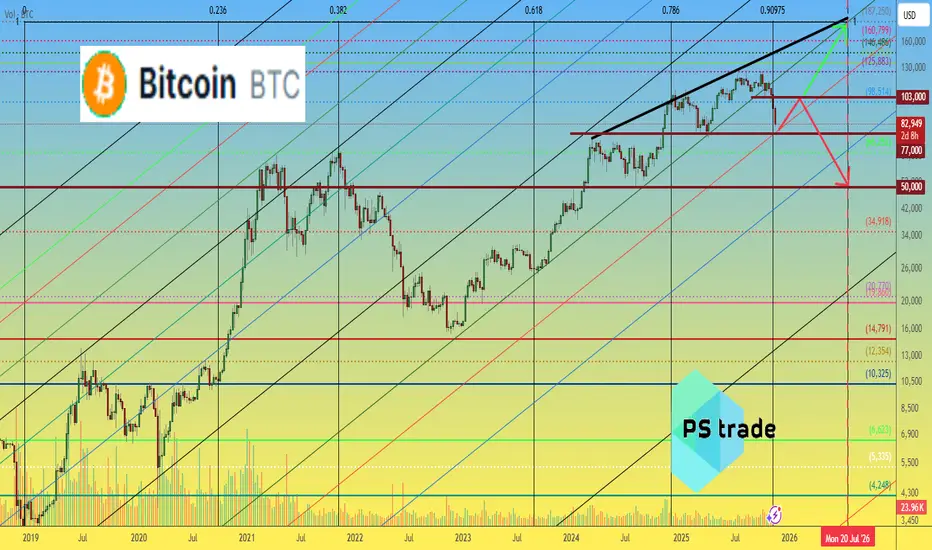
Bitcoin - The classic bullrun top creation!🗿Bitcoin ( CRYPTO:BTCUSD ) created the bullrun top:
🔎Analysis summary:
A couple of weeks ago, Bitcoin retested a major decade long resistance curve. Since Bitcoin then already created bearish confirmation, we are currently seeing an expected crackdown. Considering all the underlying trends, this bearish cycle is still not over yet.
📝Levels to watch:
$70,000 and $50,000
SwingTraderPhil
SwingTrading.Simplified. | Investing.Simplified. | #LONGTERMVISION

Bitcoin: Critical Levels Ahead, $106k or $65kHi guys!
The current BTC structure displays a textbook Three Drives Pattern, followed by visible momentum weakness. After the first, second, and third drives completed, price failed to create higher highs, confirming exhaustion. This aligns with the RSI divergence, which began forming during the second and third drives.
Price has now pulled back into a key decision zone. Two scenarios stand out:
Bullish Scenario
If BTC breaks and sustains above 94,393 USD, it would signal renewed strength. This could trigger a continuation toward the upper supply zone around 105,000–110,000 USD, where previous rejection occurred.
Bearish Scenario
Failure to break higher and instead falling below 82,000–83,000 USD opens the path toward deeper retracement. A breakdown confirms the distribution phase after the three drives, exposing the broader support area near 74,500 USD and potentially down to 65,445 USD, which aligns with historical demand.
Disclaimer: As part of ThinkMarkets’ Influencer Program, I am sponsored to share and publish their charts in my analysis.

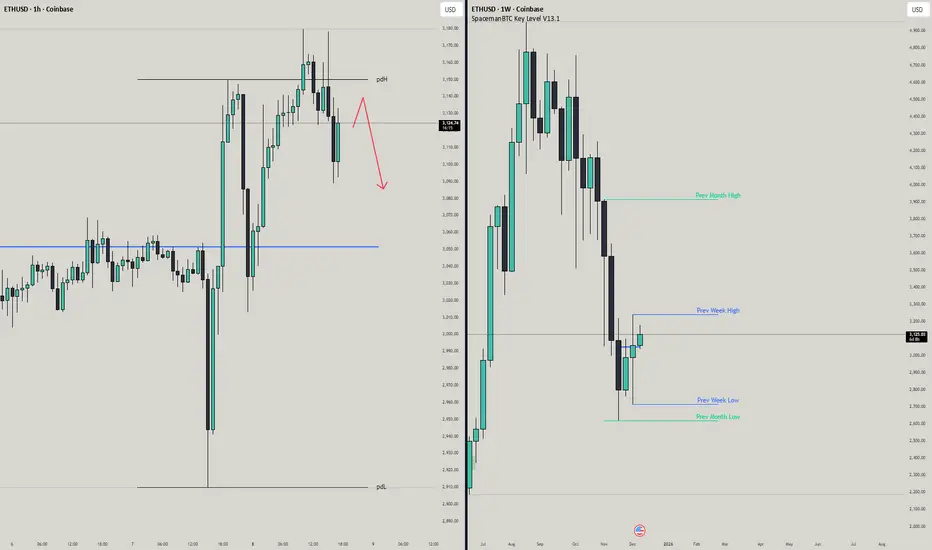
ETHUSD | RejectedEthereum showed a big rejection from the previous day high, same with bitcoin.
Will be looking for a retest of this level before going into any short positions.
When this retest happens I will be looking for a 15-30 minute candle close under the PDH.
Will be very careful entering though, daily chart is starting to look funky, with the weekly showing 2 green candles as well.
There certainly has been some bullish momentum that came in the last few days.
Let me know what your analysis is!
Stay safe out there and do your own due diligence, this is not investment advise!
BTC/USD – Retest of Supply Zone With Potential Bearish ContinuatBTC/USD has moved back into the 94,022 supply zone, an area where strong rejection previously occurred. Price is still trading inside a broader downward channel, showing that sellers remain active in this region.
After tapping the supply zone, the market is forming a short-term pullback. If price fails to break and hold above the zone, a continuation toward the 83,866 support level becomes likely. The channel structure supports the idea of a lower move if momentum shifts back to the downside.
At the same time, price needs to stay below the channel midpoint to maintain bearish pressure; otherwise, the structure may turn neutral.
Key Levels to Watch:
Supply / Resistance: 94,022
Support: 83,866
Structure: Downward channel
Bias: Bearish while below resistance zone

BTC : REVERSAL or FAKEOUT ?? Hello Bitcoin Watchers 📈
BTC is looking promising with a price recovery towards the upside, currently trading just over $90k.
📢But let's not forget, a higher high was observed here as well.
A further -30% drop followed after this pullback to the upside:
If we have to follow a similar trend, over the next two months we could end up at around $65K:
Conclusion - I'm leaning towards more drop to follow after a period of sideways trading here. We could see this zone hold for two or three weeks up until after Xmas, at which point longs could be liquidated again if the optimism goes too high.
If you've been following my previous BTC updates, you would have seen that it's not uncommon for the price to recover to the basis of the Bollinger bands, or mid-level moving average. And the only way that can be considered a reversal, is if the WEEKLY starts closing above the 50day moving average, which we are no where near close to seeing.
BINANCE:BTCUSDT

BTC.D 4H – Market Structure OutlookHi fellow traders,
On the 4H BTC Dominance chart, I am applying Elliott Wave principles to outline a directional scenario for the broader crypto market. After completing the recent downward leg, I expect dominance to move higher in three waves, forming a corrective structure before the larger continuation to the downside can resume.
This is not a trade setup, but a structural roadmap to understand how capital may rotate across the crypto market. As long as BTC.D remains below the invalidation level at 61.32%, my expectation is that dominance will eventually turn lower with TP1, TP2, and TP3 as the downside objectives - signalling increasing strength for ALTcoins.
If dominance breaks above the invalidation level, this scenario is no longer valid.
Good luck and trade safe!

Silent Waves Before the Surge The current BTCUSD structure shows the market completing a major impulsive wave, followed by a corrective phase that is still unfolding. The correction has taken the form of overlapping subwaves, suggesting consolidation rather than a sharp reversal.
Within this corrective movement, smaller waves are building a base that could serve as the foundation for the next impulsive leg. The pattern indicates that the market is preparing for renewed momentum once the corrective sequence is fully exhausted.
The overall wave count continues to favor a bullish continuation scenario, provided the corrective structure resolves in alignment with classical Elliott principles. Traders should watch for the transition from consolidation to impulse as the next defining move.

Ethereum (ETHUSD) – Momentum Shift in Progress?thereum just staged a strong rebound, signaling a potential momentum shift after months of bearish pressure.
🔄 Trend Development
After a sharp drop early last week, ETH quickly reversed and printed a higher low — a key early sign of bullish intent.
Shortly after, ETH broke above the previous week's high, marking the first higher-high and higher-low structure in months. While this happened in a tight time frame, it's a meaningful development from a price action perspective.
📉 Support & 📈 Resistance Levels
Support held strong in the $2,600 – $2,800 range
Immediate resistance now sits at $3,300
A breakout above $3,300 could trigger a move toward the upper boundary of the descending channel
However, we can't give the "all clear" just yet. A weekly close above $4,000 – $4,200 would be needed to confirm a full trend reversal and bullish continuation.

BTC TO 61K Keep Eyes on Bitcoin 👀👀🤑
BINANCE:BTCUSDT BTC Making a bearish flag on 1D frame
Just keep your Eyes on it
====================================
we will entry (short) After breakout the flag
Entry Level : 88k
Target 1 : 80K
Target 2 : 74k
Target 3 : 61K
SL: 98.25K
===================================
I think Bitcoin will be very bearish in 2026, and we will see prices below 60k! It looked like sci-fi a few weeks ago, but this idea of 60k Bitcoin seems to be real.
Make sure you Follow me to see the market from another angle ❤️🕊️👌

TradeCityPro | Bitcoin Daily Analysis #244👋 Welcome to TradeCity Pro!
Let’s move on to Bitcoin analysis; with the start of the new week, the market has taken a fresh trend.
⏳ 1-hour timeframe
Yesterday on Bitcoin, we had two very important levels that the price was fluctuating between.
⭐ The resistance zone 90022 and the support 88890 were the areas where breaking either of them could give us a position.
💥 The first position we could open yesterday was a short, which after breaking 88890 made a sharp move that would reach our target as well, but afterward the price started a bullish move, and after the previous bearish move turned into a fakeout, a lot of bullish momentum entered it.
💧 After this move, the 90022 trigger also activated, and Bitcoin moved upward to the 91447 area.
🧩 Overall, yesterday was a very volatile day, because after reaching 91447, Bitcoin corrected to near 88890, and then again moved upward.
🎲 But today Bitcoin was struggling with the 91447 zone, which it has so far managed to break, and with a bit of momentum and a slight slope, it is moving upward.
⚡️ We can see this trend weakness inside the RSI; the shape of the candles also shows a lot of trend weakness, but volume still doesn’t have a strong divergence with the bullish trend.
✔️ If this weakness continues, the probability of a fake break of 91447 and the start of a new bearish move increases a lot.
🔔 But if Bitcoin keeps its momentum and the move continues, the next zone the price can react to will be 93609.
❌ Disclaimer ❌
Trading futures is highly risky and dangerous. If you're not an expert, these triggers may not be suitable for you. You should first learn risk and capital management. You can also use the educational content from this channel.
Finally, these triggers reflect my personal opinions on price action, and the market may move completely against this analysis. So, do your own research before opening any position.

Altcoins are loading. BTC Dominance is in a downward retest following the recent breakout.
ETH/BTC confirmed its upward breakout.
The apparent silence is actually the sound of an impending power shift.
CRYPTOCAP:BTC.D vs. BINANCE:ETHBTC

08/12/25 Weekly OutlookLast weeks high: $94,171.14
Last weeks low: $83,809.87
Midpoint: $88,990.51
Bitcoin performs a double Swing Fail Pattern (SFP) as price sweeps both extremities of the range before closing out near the midpoint. After such a dramatic drawdown during Q4 so far, the possibility of a V-shape reversal as the year comes to a close was never going to be a high probability. With that we have seen a steady base being built and a higher low printed, certainly a more bullish structure than last weeks opening.
This week we have FOMC on Wednesday:
Previous: 4.0%
Forecast: 3.75% (-25bps)
Actual: ?%
A 25bps cut is forecast with an 87% chance. Could this finally reignite some buyside volume? The timing of year end doesn't help, I think volume stays relatively subdued until 2026 where the Fed ending QT & lowering rates help risk-on assets. For now I will maintain that a $80,000-$100,000 range is where Bitcoin stays for some time, thin orderbooks creating short term volatility but not necessarily strong moves in either direction.

BTC — Range Deviation Play & Bear Flag TargetBitcoin continues to trade inside a clearly defined sideways range. Recently, the price made a deviation above the range high — a classic false breakout — and quickly returned back inside the channel, confirming the upper boundary as strong resistance.
Now, on the daily timeframe , the market is forming a bear flag , which typically acts as a continuation pattern to the downside. If this structure breaks lower, it opens the way toward the $68–67K zone , which aligns perfectly with the lower boundary of the range.
A move into this area would likely create a deviation below the range low, mirroring the earlier deviation at the top. Such symmetrical deviations often signal liquidity grabs before a potential mid-term reversal.
Key Points:
Range structure remains intact
Upper deviation confirmed — failed breakout
Daily bear flag suggests continuation lower
Target: $68–67K (potential lower deviation zone)
This scenario remains valid as long as BTC stays below the mid-range and the bear flag structure holds.

Quick Bitcoin Update (4H)The corrective phase of Bitcoin is an expanding triangle/diametric/symmetrical , with wave C completed and now we are inside wave D. This is a bullish D wave.
There is still time remaining for wave D to complete.
We have marked a green box below the price; if the price reaches this area, we can look for long/buy positions.
Look for long/buy positions in the red box, as there are many sell orders placed there.
For risk management, please don't forget stop loss and capital management
When we reach the first target, save some profit and then change the stop to entry
Comment if you have any questions
Thank You

Bitcoin Roadmap | Short-termBitcoin( BINANCE:BTCUSDT ) began to decline from the resistance zone($95,020-$94,840) exactly as expected in my previous idea , successfully reaching all targets.
At the moment, Bitcoin was able to break the support zone($90,650-$90,000). It seems that the pullback to the broken support zone($90,650-$90,000) could be completed with a symmetrical triangle pattern, although given the low trading volume on Saturday and Sunday, this triangle may not function properly.
In terms of Elliott Wave theory, Bitcoin appears to be completing the microwave C of the main wave B, and I expect at least one more impulsive 5-wave move to the upside.
I expect Bitcoin to start rising from the support zone($89,230-$88,000) or the Potential Reversal Zone(PRZ) maximum. A break of the resistance lines could be a good sign for Bitcoin to rise again.
What do you think? Do you believe Bitcoin will dip below $75,000, or will it bounce back?
Cumulative Short Liquidation Leverage: $98,260-$96,690
Cumulative Short Liquidation Leverage: $90,560-$89,990
Cumulative Long Liquidation Leverage: $87,820-$87,290
Cumulative Long Liquidation Leverage: $83,900-$82,400
First Target: $89,911
Second Target: $92,119
Stop Loss(SL): $86,120(Worst)
Points may shift as the market evolves
💡 Please respect each other's opinions and express agreement or disagreement politely.
📌Bitcoin Analysis (BTCUSDT), 1-hour time frame.
🛑 Always set a Stop Loss(SL) for every position you open.
✅ This is just my idea; I’d love to see your thoughts too!
🔥 If you find it helpful, please BOOST this post and share it with your friends.

Bitcoin BTC price analysis until mid-2026The long-term CRYPTOCAP:BTC trend (2023 → Nov 2025) has either broken its structure or expanded into a wider channel.
The next few weeks will be critical for determining the macro direction for OKX:BTCUSDT price
Key zones:
• 🔻 Support: $75,000–$77,000
• 🔺 Resistance: $103,000–$105,000
A breakout of one of these ranges is likely to define Bitcoin’s trajectory into mid-2026 — either toward $190K or a deeper pullback toward $50K.
🤔 What’s the more probable scenario on your chart — bullish expansion or a structural breakdown?
______________
◆ Follow us ❤️ for daily crypto insights & updates!
🚀 Don’t miss out on important market moves
🧠 DYOR | This is not financial advice, just thinking out loud
BTC 87K LOWS ARE VITAL FOR THE BULLS NOWMorning folks,
So, the pullback that we discussed has happened, although it was a bit deeper - right to ~87.75-88K area, while we were talking about 89-90... anyway, the bounce up happened and currently this 87-87.5K is becoming critical for the bulls.
Downside breakout significantly will increase chances to return back to 80K. But at the same time, it means that it is easy to consider a long position. If you think about it - you can buy at some pullback against 87.5 lows.
If you already bought, think about moving stops to breakeven levels.
As our big upside AB=CD pattern is still valid, we keep intact our 96-97K target.

Bearish momentum to extend?Bitcoin (BTC/USD) is rising towards the pivot which acts as a pullback resistance and could reverse to the 1st support.
Pivot: 94,255.27
1st Support: 80,712.26
1st Resistance: 106,846.29
Disclaimer:
The opinions given above constitute general market commentary and do not constitute the opinion or advice of IC Markets or any form of personal or investment advice.
Any opinions, news, research, analyses, prices, other information, or links to third-party sites contained on this website are provided on an "as-is" basis, are intended to be informative only, and are not advice, a recommendation, research, a record of our trading prices, an offer of, or solicitation for, a transaction in any financial instrument and thus should not be treated as such. The information provided does not involve any specific investment objectives, financial situation, or needs of any specific person who may receive it. Please be aware that past performance is not a reliable indicator of future performance and/or results. Past performance or forward-looking scenarios based upon the reasonable beliefs of the third-party provider are not a guarantee of future performance. Actual results may differ materially from those anticipated in forward-looking or past performance statements. IC Markets makes no representation or warranty and assumes no liability as to the accuracy or completeness of the information provided, nor any loss arising from any investment based on a recommendation, forecast, or any information supplied by any third party.

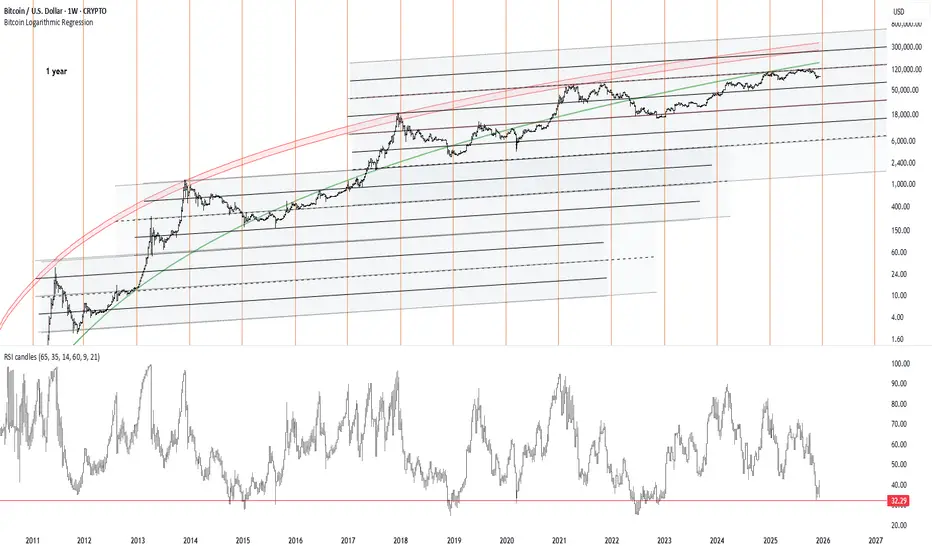
Bitcoin: The Cycle Is Approaching Its Breakout PhaseBitcoin: The Cycle Is Approaching Its Breakout Phase – “Time Is Tightening, the Band Is Compressing”
LETS START =)
This chart ultimately tells one story:
Bitcoin has never abandoned its 4-year rhythm; it simply reduces volatility each cycle while grinding toward the upper logarithmic band.
Let’s decode the structure step by step.
1) Logarithmic Regression Bands: “Not a trendline, a structural corridor”
The grey–black bands represent a logarithmic channel that Bitcoin has never broken below since 2011.
There are three key layers:
A) Lower-Mid Band (Cycle Floor Support)
→ The bottoms of 2012, 2015, and 2019 all touched this region.
→ Today this zone sits around ~43k–55k.
The fact that the 2022 bottom formed here already confirms that the structural low of this cycle is behind us.
B) Upper-Mid Band (Pre-Top Compression Zone)
→ In every major cycle—2013, 2017, 2021—price consolidated beneath this band right before the final blow-off phase.
→ In 2025, BTC is again compressing inside the same zone.
This implies:
Bitcoin always “stalls” once before the true cycle top.
This stall is happening now.
C) Upper Red Band (Macro Top Territory)
→ All mega tops in 2013, 2017, and 2021 hit this exact red logarithmic curve.
→ The projection for the 2025–2026 cycle peaks lands here again:
185k – 260k.
The red curve marks the end of the road.
2) Cyclical Time Markers (Orange Vertical Lines): “The 1-Year rhythm repeats”
The orange verticals represent Bitcoin’s 1-year hybrid time geometry.
Every yearly block follows the same pattern:
Momentum compresses
Volatility dries up
RSI drifts toward the floor
Final trend expansion happens in the last 3–4 months
Right now, as we enter late 2025:
The time marker again aligns with a cyclical weakness window
Which historically precedes major upside expansions
This mirrors 2012, 2015, 2019, and 2023 perfectly.
The chart is saying:
“Your time window is closing. This is the reset before expansion.”
3) RSI at 32: “Cycle-bottom signal”
The horizontal red line tracks historical cycle-bottom RSI values.
An RSI in the 32–35 range marked:
2011 bottom
2015 bottom
2019 bottom
2023 bottom
In late 2025, RSI is back in the same zone.
This tells us:
The trend is not breaking; momentum is resetting.
This is the last cooldown before the expansion leg.
Bitcoin has never topped a macro cycle with weekly RSI this low.
Every blow-off top occurred with RSI between 70–90.
RSI is saying clearly:
“The cycle top is not in. This bull market is not finished.”
4) Price Behavior: “Compression beneath upper band = calm before ignition”
Bitcoin is currently:
Squeezed between the upper-mid grey band
And the upper red logarithmic curve
Forming the tightest consolidation since 2021
This structure resembles:
→ Mid-2016 (right before the 2017 parabolic run)
→ Summer 2020 (right before the 2021 surge)
Once again, BTC is behaving like a coiled spring—fully compressed, waiting for release.
5) Cyclical Projection (Cryptollica style):
Assuming historical structure repeats:
Short Term (1–3 months):
RSI bottom → sideways grind → momentum reversal
Medium Term (3–9 months):
Break above upper-mid band
→ explosive flow into 85k–110k range
→ sentiment flips fully bullish
Macro Top Window (first half of 2026):
Touch of the upper red band
→ 185k–260k macro top potential
This band has never failed across 3 full cycles.
----------------------------------------------------------------
This chart is not showing weakness.
It is showing a textbook cyclical reset.
**“The 2026 blow-off top hasn’t even started.
This is the final compression…
the final breath…
------------------------------
2013-2018
2021-2026
BTCUSD - Head and Shoulders IdeaSuggesting that the top has been in and the right shoulder is currently forming for BTCUSD
The head and shoulders have a curved form
Daily timeframe
Still believe that an alt season will be seen regardless of this bearish pattern on BTC

Bitcoin 1more dipThere is a possibility that after Bitcoin reaches the 99k area, it falls again due to many resistances in that area, and then goes to 110k.
