BTCUDST.P - November 5, 2025BTCUSDT is currently consolidating within a tight range; a scalp setup is identified with a long entry above 101,859 targeting 104,420, and a short entry below 98,888 targeting 97,056, depending on which breakout confirms first.
BTC-D

BTC 1W😎Probabilities of a correction to the 55-period moving average, a technical rebound for bullish continuation, without breaking the weekly uptrend.
♥ Keep in mind that a correction to the 55-period moving average on the weekly chart constitutes a bearish trend on the daily chart.

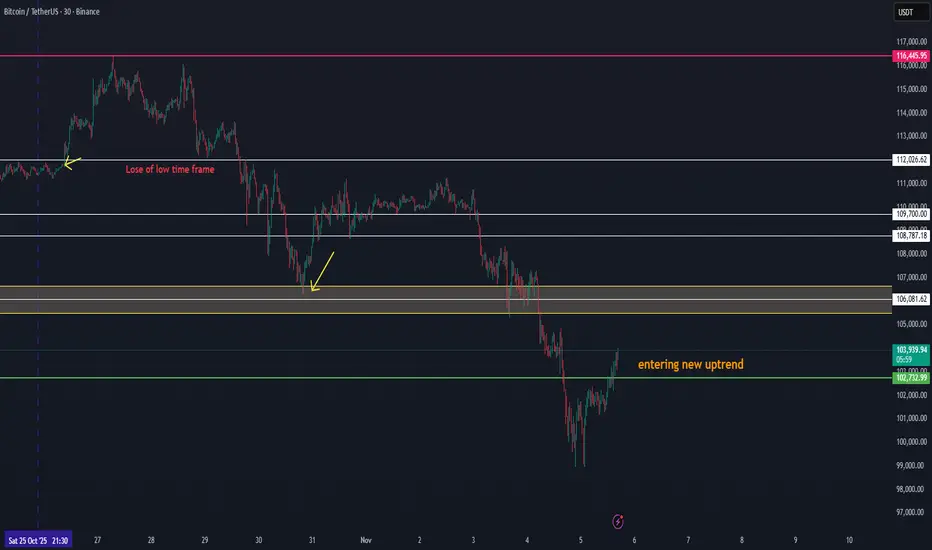
BTC Showing Early Signs of a New Uptrend Volume FormationBTC Showing Early Signs of a New Uptrend Volume Formation
Bitcoin is beginning to show new uptrend volume structure after a long corrective phase. This current movement around the 103K zone could be the first confirmation of renewed bullish momentum forming after the 110K area breakdown.
Here’s the technical context:
🔹 Structure: BTC has established a short-term higher low and is now attempting to build a new rising channel.
🔹 Volume Confirmation: The growing buy volume around 103K suggests early accumulation — this could mark the start of a new volume phase.
🔹 Targets: A sustained move above 103.8K–104.2K may confirm continuation toward 105K+, which would act as the first key resistance and validation of renewed market strength.
💡 Outlook:
If BTC maintains its current momentum and volume continues to rise, this could be the first stage of a new uptrend, with 105K+ as the initial upside target and potential re-entry toward the broader 110K recovery structure later.
BTCUSDT.P - November 6, 2025BTCUSDT.P is currently in a tight range; an intramonth setup is identified with a long entry above 105,352 targeting 121,579, and a short entry below 94226 targeting 85100, depending on which breakout confirms first.

BITCOIN SIGNAL: NEXT WAVE IS INCOMING!!! (soon)Yello Paradisers, enjoy the video!
And Paradisers! Keep in mind to trade only with a proper professional trading strategy. Wait for confirmations. Play with tactics. This is the only way you can be long-term profitable.
Remember, don’t trade without confirmations. Wait for them before creating a trade. Be disciplined, patient, and emotionally controlled. Only trade the highest probability setups with the greatest risk to reward ratio. This will ensure that you become a long-term profitable professional trader.
Don't be a gambler. Don't try to get rich quick. Make sure that your trading is professionally based on proper strategies and trade tactics.

Bitcoin – Technical Outlook
🔹 Key Zone: 101,500 – 104,500
At the moment, price is trading within this key zone where strong buying and selling activity is taking place — a critical area that will likely determine the next major move.
🟢 Bullish Scenario (Uptrend)
If price breaks above and holds above 104,500, this would confirm a continuation of bullish momentum.
In that case, price is expected to move higher toward 120,040, with further potential extension toward 125,567.
📈 This zone is an important confirmation area that could signal the beginning of a new bullish leg.
🔴 Bearish Scenario (Downtrend)
However, if price drops below and stabilizes under 101,500, this would indicate a potential bearish reversal.
In that case, the price may move downward toward the support zone at 97,700 – 93,400.
Breaking below this area would confirm further bearish extension toward 88,080.
📊 Summary:
Currently, Bitcoin is trading inside the key zone (101,500–104,500).
A breakout above or below this range will likely define the next strong market direction — whether a bullish continuation or a deeper bearish correction.

$BTC — Bounce or Bluff?Bitcoin tapped the 98k zone, but 104k continues to act as firm resistance. If this level keeps rejecting into New York close, a deviation toward 97k–96k looks likely before any meaningful retest of the 105k–107k range.
After sweeping liquidity, Bitcoin is showing a modest bullish pullback. Following a sharp move, sideways consolidation tends to be the next phase — forming a new range where both buy-side and sell-side liquidity start to build.
Any rejection around 104k could offer a solid short setup, targeting the 97–96k zone for a potential triple-drive setup.
Conversely, if price stabilizes at 100k and buyers defend it with strength, that’s when long opportunities begin to look more compelling.

Up to 150% on TURTLEToday, against the background of the general market pullback, new options are being formed for medium-term investments and scalping on coins recently added to binance. I would like to draw attention to TURTLE, which has reached probable medium-term support in the range of 0.085-100. With the current issue from this range, the probability of a price reversal prevails for at least a retest of large purchase volumes around 0.21. Today, the first investments have already been made to reverse the trend, more stable purchases can be expected in the second half of this week with the consolidation of ETH above 3,100. Also, as you pass through the middle of the quarter, there is a high probability of an attempt to reverse the quarterly candle both for the tops and for individual coins. A test of the lower support of 0.060-75 for TURTLE is possible only with an additional drawdown of ETH to the test of 2500-2600, which is less likely so far. From this range, a rapid price recovery above 0.1 is likely, which will serve as a good opportunity for additional scalping in addition to the main position. In case of a successful reversal of ETH from 3100-3250 to the 4100 retest on TURTLE, there is a fairly high probability of testing the range of 0.21-25.
The MITO VIC BMT HOOK has also reached levels for a new trend reversal attempt, which I am also considering working on. They can be used to top up in addition to the main position to take a reversal attempt up to 30-60%.
ADX and PIVX, which I recommended earlier, have performed well, but I am not considering them for further work, since the target levels for them have been worked out and it is possible to add the monitoring tag further.

BANANA TIME FOR ETHEREUM? or BIG SHORT? #ETHInstitutional holdings: Public companies accumulated over 1.2M ETH, with strategies leaning into staking and liquid staking for reserve yield.
Supply and fees: Circulating supply rose 0.1% QoQ to 120.7M ETH; network fees fell to multi‑year lows as activity migrated to L2s and alternative L1s.
Staking: Total staked ETH climbed to 35.7M (29.6% of supply), with USD stake value up 43% to $89.2B
Bullish momentum narrative: Multiple outlets point to consolidation below major resistance with upside targets between $4,500 and ~$6,900 contingent on breakouts and institutional flows resuming.
On-chain/structural context: Continued high staked share (~30–35% of supply) and ETF rotation narratives underpin reduced liquid supply and potential resilience, though breakouts hinge on clearing $4,500–$4,975 resistance and defending ~$3,800 support
Main news that captured my Attention is:
Animoca Brands plans to go public on Nasdaq via a reverse merger with Currenc Group, expected to close in 2026.
The Hong Kong-based firm, valued at $6 billion in 2022, has invested in over 600 projects across gaming, DeFi, NFTs, and metaverse sectors.
The merger will make Animoca the world’s first publicly-listed, diversified digital assets conglomerate, with Animoca owning 95% of the new entity.
Currenc will divest from its current operations, including a digital remittance platform, as part of the deal.
Animoca’s digital asset treasury includes Bitcoin, Ethereum, Solana, and MOCA, with a market cap of $208 million for MOCA.
The merger is subject to Australian regulatory approval; Animoca previously traded on the Australian Securities Exchange before delisting in 2020.
Ethereum Layer 2 project MegaETH announced its third community-led raise, starting at a $1 million valuation with a cap of $999 million via an English auction.
The raise is conducted through Sonar, Coinbase-acquired ICO platform founded by Jordan “Cobie” Fish.
Coinciding with the raise, Hyperliquid launched MEGA pre-market perpetuals, quickly valuing MegaETH at $6 billion pre-market, with a current FDV of $5.2 billion.
If the raise hits the maximum valuation, ICO participants could see a 5x return; early Echo round investors are up 23x, and Fluffles NFT holders nearly 10x.
The event marks MegaETH’s third community-focused funding effort, emphasizing long-term social and onchain engagement.
The rapid valuation surge signals strong investor interest ahead of the official launch.

TradeCityPro | Bitcoin Daily Analysis #211👋 Welcome to TradeCity Pro!
Let’s dive into the Bitcoin analysis. The market is still in a downtrend and has reached its next support!
⏳ 4-Hour Timeframe
Bitcoin finally broke the important support at 106,396 yesterday, and with a very high selling volume, it managed to start its new downward wave.
💥 The RSI oscillator also entered the oversold zone at the same time as the 106,396 break, which was another reason for the market's drop.
⚡️ This downward move has reached the 100,308 support, and the price has calmed down a bit now.
✅ The psychological level of 100,000 is extremely important. Despite the massive selling volume and bearish momentum in the market, buyers haven’t allowed the price to stabilize below this level, and now the market is in a corrective phase.
🧩 After the price reacted to this zone, the volume has significantly decreased, which favors the sellers. If the buying volume remains low, the price will likely start falling again with the entrance of new selling volume.
🔔 However, since the RSI has faked the 30 level and the market momentum could turn bullish, we could see a reversal. If the volume starts to increase and considering the bullish trend on higher timeframes like the weekly chart, we could open a position.
🔍 For now, the first long trigger we have in this timeframe is 111,789. If the price can sharply recover to this level, a very strong bullish trend could begin.
💡 The main resistance zone we have is 115,771, and breaking this level will confirm the start of Bitcoin's new upward wave. We can look to enter the trend after breaking 111,789. If the price builds further structure, we can enter earlier with smaller triggers.
❌ Disclaimer ❌
Trading futures is highly risky and dangerous. If you're not an expert, these triggers may not be suitable for you. You should first learn risk and capital management. You can also use the educational content from this channel.
Finally, these triggers reflect my personal opinions on price action, and the market may move completely against this analysis. So, do your own research before opening any position.

BTC 1D Bitcoin is showing signs of a reversal on the 1-day timeframe, as confirmed by the subtrend support and subsequent momentum.


Bitcoin: Sellers Pushed the Price Below the RangeThe price tested the 50% level of the monthly range (100,353)
Hello, traders and investors!
This analysis is based on the Initiative Analysis (IA) method.
On the daily timeframe, the market remains in a sideways range, and the seller initiative managed to push the price below its lower boundary.
The price also interacted with the 50% level of the monthly trading range — 100,353.
These two factors may trigger buying activity and a potential return of the price back into the range.
Within the seller initiative, we can see four seller candles with increasing volume, with the highest volume at the bottom — the IC candle.
To look for buying opportunities, the price needs to return into the range.
Absorption of the seller’s IC candle would be a good sign to start looking for long setups.
Nearest key levels on the daily timeframe:
— Lower boundary of the range — 102,000
— High of the seller candle that broke the lower boundary — 107,299
If we look at the 1-hour timeframe, there’s also a nearby level at 107,672, which corresponds to the 50% level of the hourly trading range.
If buyers start to move, it will be important to watch how they handle the 107,299–107,672 zone.
Wishing you profitable trades!

Bitcoin Losses Hit 9-Month High Of $24 Billion Amid 8% Price DroBitcoin is trading at $101,729 at the time of writing, sitting just above the critical $100,000 support. Earlier, BTC slipped below this level, forming an intra-day low of $98,966 before rebounding slightly.
The recent 8% drop has validated a head-and-shoulders pattern, which projects a potential 13.6% decline targeting $89,948. However, if investors begin buying at lower levels, Bitcoin could bounce from $100,000 and retest $105,000 or higher.
Conversely, continued selling pressure and weak market conditions could send BTC below $100,000 again. A breach under $98,000 may lead to further losses toward $95,000 or lower, undermining any short-term recovery hopes.

Bitcoin update + new setupsETH was leading the move to sweep the lows, and it did.
Now that both BTC and ETH have cleared liquidity below the previous lows, we have new setups, depending on the confirmations at key S/R levels.
⚠️ These setups are based on a bounce scenario toward the SSL. Setups become invalid if the market drops further toward the lower Pivot areas. When that happens, a new update will follow.
BTC: (When support confirmed above SSL)
- Entry around SSL ~103540
- tp1 ~104900
- tp2 ~106200
- close ~108200
- stop depends on previous low when support confirmed above SSL
BTC: (When SSL is rejected and confirmed)
- DCA around SSL ~103500-102500
- tp1 ~100600
- tp2 ~98900
- close ~104800
Note: Don't forget to take partial profits on the way to secure your trade.

Need to see if it can rise above 104463.99
Hello, fellow traders!
Please "Follow" to always get the latest information quickly.
Have a great day.
-------------------------------------
(BTCUSDT 1D chart)
The price declined from the DOM(-60) indicator level of 106431.68, but the DOM(-60) indicator is still forming at 106431.68.
Therefore, the 106431.68 level can be considered a low point.
Therefore, we need to observe how the price moves during this volatile period, around November 4th-9th (maximum November 3rd-10th).
Since it fell below the critical 104463.99-108353.0 level, if it fails to rise above this level, we should check for support near the next critical level of 89294.25.
At this point, the M-Siganl indicator on the 1M chart is passing through a critical zone, so it's expected to re-establish the trend once it meets the M-Siganl indicator on the 1M chart.
If the OBV indicator falls below the Low Line and fails to rise again, it's likely to touch EMA 3.
For the price to break above a critical point or zone and continue the uptrend,
1. The StochRSI indicator must be rising. Ideally, it should not be in an overbought zone.
2. The TC (Trend Check) indicator must be rising. Ideally, it should remain above the zero level.
3. The OBV indicator must be rising. Ideally, it should remain above the High Line.
If the above conditions are met, the upward trend is likely to continue after breaking above a critical point or zone.
Currently, the price is moving against the above conditions, so there's a possibility of further decline. However, given the volatility, it's better to wait and see rather than assume a decline.
-------------------------------------
I'm curious about what will happen next, but there's no way to know for sure.
However, as I've repeatedly mentioned, if you're trading according to a basic trading strategy that suits your investment style, I believe you'll be able to trade according to your strategy, whether the current decline continues or rebounds and rises.
As I mentioned in a previous idea,
- If a daily decline exceeds -10%, a rebound is highly likely,
- If a daily increase exceeds +10%, a reversal is highly likely.
Therefore, if you're familiar with scalping or day trading, you can profit from trading.
However, you must sell at that profit to lock in your profits.
The basic trading strategy I mentioned is to buy in the DOM(-60) ~ HA-Low range and sell in the HA-High ~ DOM(60) range.
Furthermore, we can respond based on the support and resistance levels identified on the 1M, 1W, and 1D charts, which are important areas.
Therefore, the current available support levels are the 104463.99-108.353.0 and 87814.27-93570.28 levels.
The remaining support and resistance levels can be used as trading opportunities.
In other words, these are points for securing profits.
-
Due to this decline, the HA-High indicator on the 1M chart is showing signs of forming at the 110105.69 level.
Therefore, if there is a rebound, the 110105.69 level could potentially serve as resistance.
However, as the price rises, the HA-High indicator on the 1M chart could return to its previous HA-High level.
Therefore, we need to determine if support is found in the 104463.99-108353.0 range and consider a response plan accordingly.
-
If the price falls below the M-Signal indicator on the 1M chart and remains there, there's a possibility of a downtrend, so we should also consider a response plan.
The coin market operates in decimals, allowing for more flexible trading than the stock market.
This means that by trading at a buy price, you can profit even if you're losing money and increase your coin (token) holdings.
For example, if you bought $100 at $101,000, you could sell $100 (including transaction fees) when the price rises, increasing your profit.
By increasing your profit, you can quickly turn a loss into a profit.
If you bought $100 at 101,000 and only had 0.1 coins (tokens), you could sell those 0.1 coins and generate a cash profit if the price rises and you're making a profit.
However, this method is only applicable if you won't be trading that coin (token) again.
In other words, if you sell 100% of your holdings, you'll need to wait until the next price fluctuation, or you could end up making a worse trade.
Therefore, if possible, it's best to trade with the same amount you bought, increasing the number of coins (tokens) that represent your profit.
Don't think you should just leave the coin (token) you're losing and trade another coin (token) to make a profit.
This could actually lead to further losses.
-
Thank you for reading to the end.
I wish you successful trading.
--------------------------------------------------
- This explains the big picture.
(3-year bull market, 1-year bear market pattern)
I will explain in more detail when the bear market begins.
------------------------------------------------------

$BTC still above Tenkansen.Since March 2023, Bitcoin has remained above the monthly Tenkansen, showing strong trend momentum.
Currently, Tenkansen continues to act as dynamic support, just like in previous continuation phases.

BTCUSDT – Bulls Reload at Support, Eyeing the 200-Day SMA• Structure & SMA200
BTCUSDT is holding just above the 100,000 USDT zone after briefly dipping below support earlier this week. The 200-day SMA, now positioned near 110,000–111,000 USDT, remains the first major resistance and potential target if a rebound extends. Market structure still shows a sequence from HH to LL, but a short-term recovery phase could emerge if buyers manage to close back above 104,000–105,000 USDT.
• Open Interest (OI)
Open Interest sits around 84K, slightly lower than recent highs but still elevated compared to October levels. The ongoing rise since early November indicates a steady return of activity — possibly short-covering or early long positioning after the latest dip. Sustained OI growth during a rebound would support the idea of buyers re-entering the market.
• Funding Rate
The Funding Rate remains modestly positive, now around +0.0025%. This reflects a mild bullish bias with no sign of speculative overheating. A continuation of positive funding during upward movement would strengthen the short-term recovery scenario.
• Cumulative Delta Volume (CDV)
CDV has slipped further to around 8.18M, extending its downtrend from early October. No divergence has appeared yet, showing that real buy-side pressure remains weak. However, stabilization of CDV near current lows would be an early sign that selling momentum is fading.
• Most probable scenario
As long as the 100,000 USDT support area holds on a daily close, a technical rebound toward 106,000–110,000 USDT appears the most probable path. A move above 105,000–106,000 USDT would mark the start of this potential recovery phase.
If CDV stops declining and funding remains positive, BTC could retest the SMA200 in the coming sessions.
Conversely, a close below 100,000 USDT with a new CDV low would negate the rebound thesis and reopen risk toward 97,000 USDT.
→ Bullish trigger: daily close above 105,000–106,000 USDT with CDV flattening.
→ Invalidation: daily close below 100,000 USDT with continued CDV weakness.
Disclaimer: This analysis is for informational purposes only and does not constitute financial advice.

Bitcoin!!! BIg OI rise! big move is soon!Bitcoin!!! BIg OI rise! big move is soon!
in a video i mentioned previus analysis
which plaeyd out well
what about now?
Big open interest rise with price squeezing down
i think local we are berish
only clear structure break would make me bullish again

BTCUSD Rebounds from Support — Bulls Eye $106K Recovery MoveHello traders, I want to share with you my opinion about Bitcoin (BTCUSD). Bitcoin has been experiencing a prolonged corrective phase following a previous bullish rally. The market recently retested the Buyer Zone near $103,800–$104,200, where strong demand has once again emerged. This area has historically acted as a reliable support level, preventing deeper declines and triggering multiple rebounds. Currently, the structure is forming a descending wedge pattern, characterized by converging resistance and support lines. This technical formation often signals potential bullish reversals, especially when it appears near a key demand zone. The latest test of the lower wedge boundary coincided with the Support Level, resulting in a sharp reaction from buyers. From my perspective, as long as the price holds above the Buyer Zone, the probability of a bullish breakout increases. A confirmed breakout above the resistance line would likely validate a move toward the $106,000 TP1 level, which aligns with previous local highs and the upper boundary of the pattern. However, if BTC fails to break the resistance and falls back below $103,800, sellers could temporarily regain control, pushing the price lower before another accumulation phase develops. Overall, the current setup favors the bulls, with clear structural support and a tightening pattern suggesting that Bitcoin may soon attempt a rebound toward $106,000 and potentially higher levels. Please share this idea with your friends and click Boost 🚀

BTC formed a head and shoulders in consolidation!Hi!
Bitcoin recently completed a Head and Shoulders pattern, leading to a rejection from the “first hunt” area near the previous high. After that rejection, price has been moving lower and is now approaching a key S&D (Supply & Demand) zone highlighted on the chart.
This lower zone represents the “second possible hunt”, an area where liquidity may be collected before a potential strong bullish reversal. The structure shows consolidation forming above this zone, suggesting that sellers may soon exhaust as buyers prepare to step in.
If price sweeps the lows into the S&D zone and finds strong support, we could see a sharp reversal move toward the $118K–$120K region, aligning with the previous highs and major liquidity level.
However, if Bitcoin fails to hold the S&D zone, the bullish recovery scenario would be invalidated, and deeper correction could follow.
the target of this head and shoulders pattern is near $100250

Bitcoin TA and ALT coin TAHi guys,
I hope you enjoyed the video! Its going to be a very existing next 3 months!

Bitcoin at Make-or-Break Zone. History Says Bounce Incoming!IG:BITCOIN is currently trading above the 50 EMA on the 1W chart, a level that has historically acted as a strong dynamic support during previous bullish cycles.
Each time CRYPTOCAP:BTC has touched the 50 EMA in the past (as highlighted on the chart), it has triggered a strong rebound leading to significant upside moves. Currently, the price is consolidating near both the support zone and the 50 EMA, suggesting that the market is once again at a critical juncture.
If IG:BITCOIN manages to hold this zone and bounce, we could see the next bullish leg pushing towards $150K. However, a clean break below the 50 EMA and support area could indicate a short-term downtrend or deeper correction before resuming the uptrend.
Traders should stay patient and prepared for all possible scenarios. Risk management remains key at these levels.Plan your entries and stops accordingly.
