BITCOIN SIGNAL: SELL EVERYTHING NOW!!!!!!!? (big)Yello Paradisers! Enjoy the video!
And Paradisers! Keep in mind to trade only with a proper professional trading strategy. Wait for confirmations. Play with tactics. This is the only way you can be long-term profitable.
Remember, don’t trade without confirmations. Wait for them before creating a trade. Be disciplined, patient, and emotionally controlled. Only trade the highest probability setups with the greatest risk to reward ratio. This will ensure that you become a long-term profitable professional trader.
Don't be a gambler. Don't try to get rich quick. Make sure that your trading is professionally based on proper strategies and trade tactics.
BTC-D

I've lost my patience with BCHMoB point... (682) I don't have much hope for pump... If the whales decide to buy... all of the above targets are possible and easy.
1. Picture before my patience runs out
2. Picture what I would like before my patience runs out.
P.S.
BCH at $5.500 || market cap $111,00B
BCH at $16.500 || market cap $333,00B

BTCUSDT.P - December 4, 2025Bitcoin is in a short‑term uptrend on the 15‑minute chart, respecting a rising trendline from the recent swing low and currently pausing in a shallow pullback after an impulsive advance. Price is trading just above a key support band around 90,500–91,000, with a higher consolidation zone projected near 96,000–97,000 and major resistance and upside target identified in the 113,000 area. A clean bounce from the trendline and a sustained move above 92,000–93,000 would confirm continuation momentum toward the 96,000–97,000 range, while a decisive break below the trendline and 90,500 would invalidate the immediate bullish structure and open room for a deeper retracement toward 88,500–86,500 before any new long setups are considered.

The 100K Magnet: Bitcoin Can’t Resist This Zone!!!🧲🧲Bitcoin is aggressively climbing, and the chart makes one thing very clear, the red zone above is acting like a powerful magnet pulling price toward it.
Here’s why:
1️⃣ 100k Round Number
Major round numbers always attract liquidity. Traders, algorithms, and even long-term investors pay attention to them, making 100,000 a natural magnet for price.
2️⃣ Supply Zone
This area hosted heavy selling in the past, meaning there’s unfilled liquidity sitting there. Markets tend to revisit such zones to rebalance orders.
3️⃣ Major Resistance Zone
Historically, this level acted as a ceiling multiple times. What was once previous resistance often turns into the next major test.
With all three factors stacked together, the entire zone becomes a high-gravity area, and BTC tends to get "pulled" toward such confluences.
🏹As long as BTC maintains its short-term momentum, a retest of this magnet zone becomes the most likely scenario. After that? The reaction will reveal whether the bulls can finally break through, or get rejected again.
Will Bitcoin reclaim the magnet zone this time? 🤔
⚠️ Disclaimer: This is not financial advice. Always do your own research and manage risk properly.
📚 Stick to your trading plan regarding entries, risk, and management.
Good luck! 🍀
All Strategies Are Good; If Managed Properly!
~Richard Nasr

AVAX Trade Setup – Watching the Pullback Opportunity!AVAX has rallied hard overnight, showing strong bullish continuation. After such a sharp move, we’re now expecting a short-term pullback, which could provide a great opportunity for a long spot entry.
🔹 Entry Zone: $12.50 – $13.50
🔹 Take Profit Targets:
• TP1: $18.50 – $21.00
• TP2: $24.00 – $27.00
🔹 Stop Loss: $12.00
If price retraces into the highlighted zone, this could mark a strong risk-reward setup for trend continuation. Keep an eye on momentum and volume confirmation before entry.

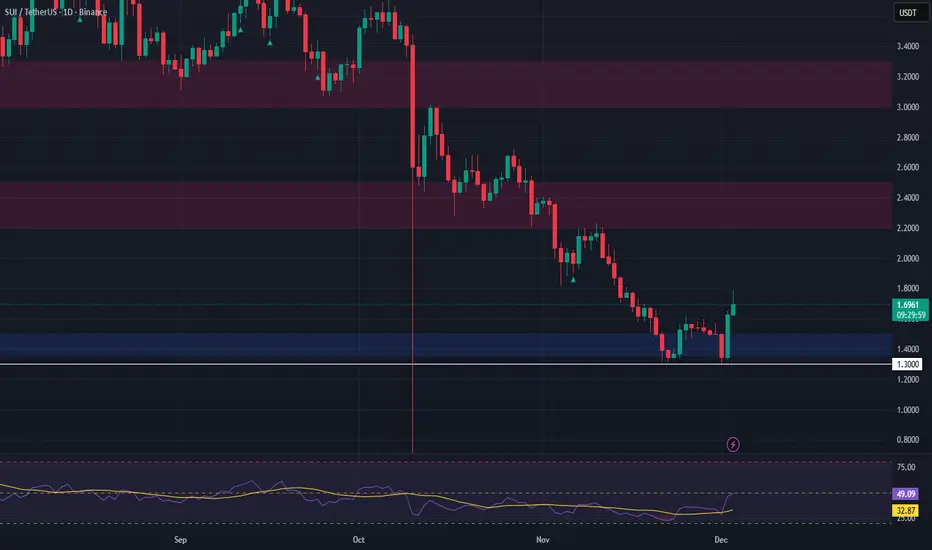
SUI Rally Cooling Off – Long Opportunity on Pullback!SUI has seen a massive rally over the past 24 hours, breaking out with strong bullish momentum. As price begins to cool off, we’re watching for a healthy pullback that could present a great long spot entry opportunity.
📉 Entry Zone: $1.36 – $1.50
🎯 Take Profit Targets:
• TP1: $2.20 – $2.50
• TP2: $3.00 – $3.30
🛑 Stop Loss: $1.30
The recent surge indicates strength, but after such explosive movement, a retest of support is likely before continuation. Patience is key—wait for the dip into the zone and monitor how price reacts. If support holds, this could be a strong mid-term trade setup.
BITCOIN SIGNAL: ONE MORE DUMP BEFORE PUMP??? (warning)Yello Paradisers! Enjoy the video!
And Paradisers! Keep in mind to trade only with a proper professional trading strategy. Wait for confirmations. Play with tactics. This is the only way you can be long-term profitable.
Remember, don’t trade without confirmations. Wait for them before creating a trade. Be disciplined, patient, and emotionally controlled. Only trade the highest probability setups with the greatest risk to reward ratio. This will ensure that you become a long-term profitable professional trader.
Don't be a gambler. Don't try to get rich quick. Make sure that your trading is professionally based on proper strategies and trade tactics.

BTC Follow-Up: Bullish Structure Playing Out Exactly as ExpectedThe reaction we highlighted earlier has now followed through beautifully. BTC held the higher low, respected the demand zone, and has pushed upward with clear momentum. This is exactly the kind of constructive price action that confirms the initial bullish read.
Sellers attempted continuation, but the market absorbed the pressure and reversed decisively. That higher low was the structural shift we needed to see, and BTC is now building out a cleaner series of rising lows and controlled retracements. This is how early trend reversals form: not with one explosive candle, but with consistent defense of higher levels and steady reclaiming of lost ground.
Price is now trading back above short term resistance and showing signs of strength on each dip. As long as BTC continues to print higher lows, this developing structure leans bullish and supports the idea that the market has transitioned from liquidation-driven selling into accumulation.
Overall, this is a constructive follow through and reinforces the idea that the recent dump was a reset rather than a breakdown. The chart is behaving well. Bulls have momentum building.

BTC/USD – Targeting the Next Accumulation ZoneBYBIT:BTCUSDT.P BTC has broken below its long-term rising structure and is now forming lower highs and lower lows on the daily chart. Losing the major trendline and trading under both the 50MA and 200MA suggests the correction isn’t finished yet.
Price is now retesting previous support as resistance, which often leads to continuation lower.
Key Levels
Support: $75K → $70K
Main Accumulation Zone: $65K → $58K (high confluence support)
Resistance: $100K (trend reversal only above here)
Outlook
As long as BTC remains below $100K, the chart favors a deeper move into the $70K–$60K zone before forming a stronger base. This area aligns with long-term channel support and is where I expect the next major accumulation phase.

BTCUSDTWe have a big downtrend.
By breakout from support and resistance we will have continued trend to next target.
Breakout 82k ready to 70k.
Breakout 93k ready to 100k and 115k.
CRYPTOCAP:BTC BITSTAMP:BTCUSD BINANCE:BTCUSDT

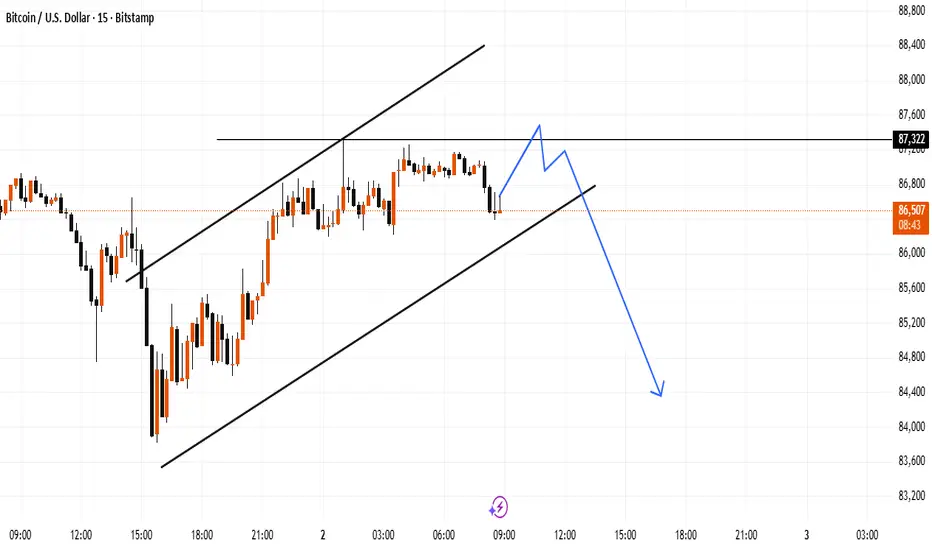
BTC Intraday Structure Near Channel SupportBitcoin is moving inside an ascending channel, with price recently touching the lower boundary of the structure. The chart also highlights a reaction zone above, showing where price has interacted multiple times. The projected path illustrates a possible scenario for how price could behave within this range, focusing only on chart structure and levels.
BTC (bitcoin) Double-Bottom Reversal Testing Key ResistanceHi!
The chart shows Bitcoin forming a clear double-bottom pattern, supported by bullish RSI divergence on the lower panel. This combination often signals exhaustion of downward momentum and a potential trend reversal. The price has rallied strongly from the second bottom and is now pressing directly into the neckline zone, which aligns with a broader descending trendline drawn from previous swing highs.
This overlap creates a high-confluence resistance area. The current reaction here is critical: if price decisively breaks above the neckline and closes above the descending trendline, it would confirm the reversal structure and open the path toward the next major liquidity pocket around the 100k–104k region, marked on your chart as the target. This region matches previous consolidation and supply, making it a realistic upside magnet if breakout momentum is strong.
However, without a confirmed breakout, the neckline remains a potential rejection level, and price could retest the mid-range or even revisit trendline support. Bulls need continuation volume above resistance to flip the zone into support.
Overall, market structure has shifted from aggressive selling to a constructive bottoming phase. The key now is whether bulls can convert this pattern into a sustained trend reversal.

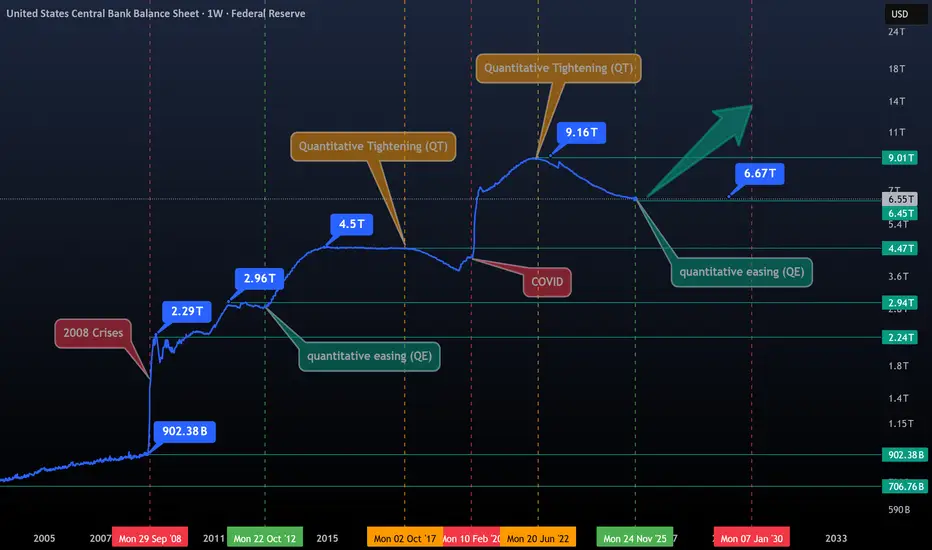
The Era of Gentle Money (QE)- This chart features labels for all key dates, offering a clear and comprehensive overview, including trillions in money creation, QT and QE phases, crises, and flash printing events.
- To truly understand stocks, cryptocurrencies, or precious metals, you first need to understand the monetary system and how it drives inflation.
- The market has been heavily suppressed since June 2022, when the Fed began its Quantitative Tightening (QT), the Fed kicked off a new QE phase on December 1, 2025.
- This is the primary driver behind yesterday’s BTC market surge.
- To complement this, we will soon have a new Fed President, Most likely, they will continue cutting rates, printing more money, and Banks will increase lending, encouraging people to take more risks, which could drive markets higher. Bearish sentiment is premature at this stage.
The heart of truth beats in the printer and in the river of liquidity !
Happy Tr4Ding !
QuickScalp on #EURUSD 📌 Market Insight: {#EURUSD }
⚠️ Risk Assessment: {High}
🚀 Approach:
Need a valid Momentum Structure , a nice one
better to have LTF entry sign first
#Ash_TheTrader #Forex #GBPJPY #MarketAnalysis #TradingSetup #RiskManagement #GOLD #Scalper #NQ #EURUSD

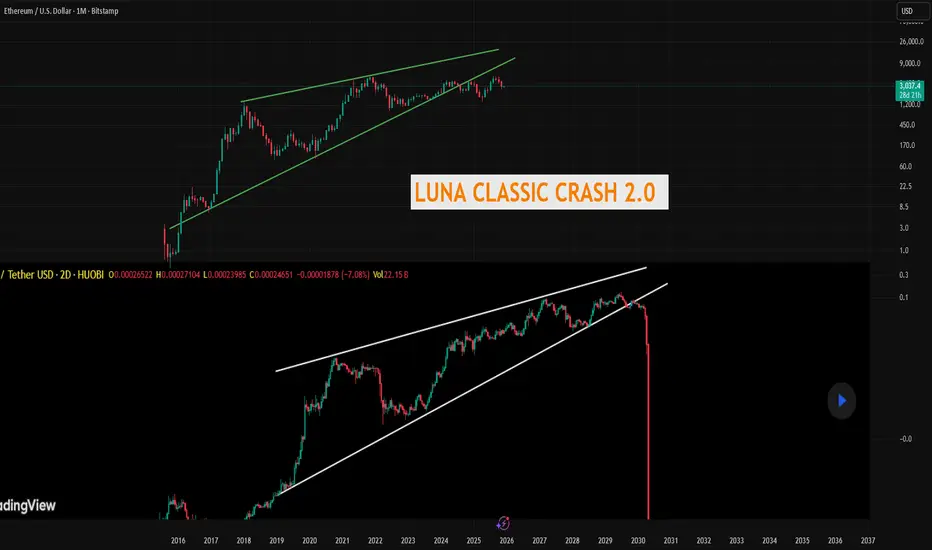
IS ETH ABOUT TO CRASH LIKE LUNA CLASSIC?I pointed this out a couple years ago you can fins my chart in my profile but I think ETH might crash like Luna Classic did. Look at the similarities with the massive rising wedge. ETH is actually outdated, clunky, the fees are stupid high, and its extremely overvalued, in my opinion. I called the Luna Classic crash down to about 50 cents from when it was at its high around 70 dollars, Ill link it below, it went waaay below even my crazy target. People thought I was crazy, go read the comments.
I think the same is on tap for Ethereum. Its already broken below if it cant get back above, I see a waterfall of red candles. What the narrative will be who knows but its coming.
The chart I added of Luna you cant even find it anymore on here this is a screenshot of that chart from my previous ideas.
Not financial advice just my opinion.
DXY EXTREME BEARISH DIVERGENCE > ABOUT TO COME STRAIGHT DOWN!DXY Has been on a tear but I think thats about to end and I think it will end very quickly. There is multiple very strong bearish divergences on the weekly, across multiple indicators showing that a major move down is coming. I think we have reached the top for the DXY for a while and its about to tank. Dont know whats around the corner as far as news but something big is about to come out thats going to kill the DXY. This is not trading or financial advice this is just my opinion. If you apprecaite my work please consider giving this chart a boost and follow me for more updates. Thank you and good luck my friends.

Bitcoin at the daily target: what comes after 93,092?This analysis is based on the Initiative Analysis (IA) method.
Hello traders and investors!
On the daily timeframe, Bitcoin has formed another confident buyer absorption — and this absorption was simultaneously a manipulation (a false breakout) of the 86,116 level.
Notably, the seller’s candle appeared with increased volume, and the subsequent absorption created a new buyer zone.
The buyer target within the current range — 93,092 — is almost reached.
Given the strength of buyer initiative, further movement toward 94,000 or even 97,000 cannot be ruled out.
However, once the price reaches 93,092, it is reasonable to expect seller initiative.
This is classic market behavior near a target: some buyers take profit while sellers get an opportunity to step in.
Wishing you profitable trades!

BTCUSDT.P - December 3, 2025Bitcoin is attempting to reverse from a prior downtrend, trading above a short-term rising trendline and pushing into a key resistance band around 93,000–94,300. The chart highlights a bullish scenario targeting the 112,000 area if price can clear this resistance and hold above the stop zone near 97,800. A failure to break and sustain above resistance, coupled with a break below the trendline, would favor a corrective move back toward the 87,300 profit level marked on the chart. Momentum is improving but remains vulnerable around resistance, making this a pivotal area for trend confirmation.

BTC: The 15-Year Prophecy (Hosoda Time & The Diagonal)There is a ghost in the machine.
For the last few months, amidst the noise of breakouts and new highs, a specific signal has been flashing a warning that defies the rules of a standard Bull Market. It is a "glitch" in the data—a silence where there should be noise.
Most are ignoring it. Some are confused by it. Today, we are going to try solving it.
Below is the full evolution of the Bitcoin setup, from the Daily traps to the Macro truth, revealing why the "Silence" is actually the loudest signal we have ever seen.
Part 1: The Micro Trap (1D Chart)
Zooming into the daily timeframe, the structure of the decline is textbook. We are currently navigating Wave (4), but the context provided by the previous move is critical.
The "Extended" Wave 3: The drop we just witnessed wasn't a standard correction; it was an impulsive sell-off where Wave 3 was extended. when the third wave extends, it confirming strong momentum in the direction of the trend. The bears are in control.
Current Status (Wave 4): We seem to be in the middle of a Wave (4) relief rally, potentially unfolding as an ABC correction.
Sub-waves 'a' and 'b' appear complete, with 'b' potentially establishing a local higher low.
What's Next: We are likely waiting for Wave 'c' to expand upwards to potentially complete the structure.
The Potential Resistance ($99k): If this structure holds, Wave 'c' might push towards the resistance confluence around $99,323. This area could serve as a ceiling for this corrective phase.
The Downside Risk ($79k): Traders should remain cautious. If Wave (4) finds resistance near $99k, the Elliott Wave guidelines suggest a Wave (5) decline could follow. If that scenario plays out, the market might target the major support zone near $79,000.
Part 2: The Time Anomaly (1W Chart)
While the daily chart showed us the immediate price action, the Weekly chart reveals the true scale of the move. As discussed in previous updates, we are navigating a large-scale Irregular Flat Correction, and we are currently at the tail end of Wave (1) of the 5-wave impulse that makes up the larger C-Wave.
So, the entire impulsive structure we just analyzed on the Daily chart? That was just the first leg of this Weekly move.
☁️ The Ichimoku Signal: Testing "Senkou Span B" Price action has now entered the Ichimoku Cloud (Kumo), a critical zone of turbulence.
The Level: you can see candles trading inside the cloud. We have already tested the bottom support, specifically the Leading Span B (Senkou Span B).
The Forecast: Hitting this level signals that Wave (1) is either ending or has already ended. However, the market rarely makes it easy. I am expecting a potential "False Breakout" below the Cloud to trigger panic, followed by a sharp reclamation. That fake-out would likely mark the bottom of Wave (1) and start of Wave (2).
⏳ The Time Anomaly: Why so fast? There is a strange disconnect in the "Time" dimension of this cycle compared to history (see picture).
2021 Cycle: In the previous bull run, the correction for Wave 1 typically took 70 days to cool the RSI down to 37.
Current Cycle: We have smashed down to an RSI of 35.8 in just 42 days.
The Question: Why is the market correcting nearly twice as fast as before? This "Time Compression" indicates the cycle is moving faster and more violently than we are used to.
The "BBWP Mystery" Finally, look at the BBWP (Volatility) in the below picture. This presents a genuine anomaly. Throughout this cycle, we have seen contractions many times, yet the spectrum never reached the extreme 90% expansion levels. Now, at the very end of the cycle, we are seeing another massive BBWP Contractions.
Why is this happening? Is it just noise, or is this contraction actually telling us the truth?
Part 4: The Truth (6-Month Macro Chart)
Why is the market moving so fast? And what is the "BBWP Signal" we mentioned Before? Look at the 6-Month Logarithmic Chart below.
The Big Picture: Elliott Wave Supercycle on 6M Log Scale
On the logarithmic chart, Bitcoin appears to be wrapping up a massive impulse wave that started from its early days:
Wave (I): Peaked around 2013 (~$1,200 high).
Wave (II): Bottomed in 2015 (~$200 low).
Wave (III): Explosive rally to the 2021 all-time high (~$69,000).
Wave (IV): The 2022 bear market low (~$15,500).
Wave (V): Ongoing since late 2022, but here's the twist—it's unfolding as an ending diagonal (wedge pattern with overlapping subwaves: 1-2-3-4-5).
2.Applying Hosoda Time Theory (Ichimoku Time Theory indicate potential future market turning point).
The vertical lines in the chart are not Fibonacci; they are Hosoda Numbers (9, 13, 17, 21...),
9: Marked the 2023 Bull Run start.
13: Exactly Marked the Jan 2025 Top as end of wave 3, which matches the irregular flat analysis on Weekly chart which states that Cycle top was on Jan 2025.
17 (±1): Matches our projection for the next major pivot—the end of wave IV and the start of the final Wave V run on Jul-2026 or Jan-2027.
The "Mystery": The BBWP Anomaly
BBWP is contracting sharply now on weekly chart—at what feels like the end of the cycle, not the start. This flips the script on historical behavior. Why? I tie it back to the higher-degree Elliott count: The ending diagonal's converging nature naturally squeezes volatility, compressing Bollinger Bands as momentum fades. Instead of signaling a fresh bull, this late-cycle contraction could be foreshadowing a reversal—think trend exhaustion rather than accumulation.
A Possible Explanation: If the macro structure is indeed an Ending Diagonal, then this volatility crunch (BBWP contractions) and the market correcting nearly twice as fast as before makes perfect sense. We would be squeezing into the apex of a 15-year wedge. The market might be running out of "oxygen".
The Verdict: With the 6-Month structure potentially squeezing into a corrective Wave IV, the weight of evidence suggests that the path of least resistance is down. Until the market touches the lower boundary of this diagonal (or invalidates the structure), the only logical macro view is bearish.

$XAG > $BTC? The 1980 "Curse" is Finally Broken.We just witnessed history. Stop scrolling and look at the chart.
For 45 years, the $50 level was the "Graveyard of Bulls."
1980: The Hunt Brothers cornered the market, peaked at $50, and crashed.
2011: The retail mania hit $49 and collapsed.
Today, that ceiling is gone. NASDAQ:XAG hasn't just "broken out"; it has shattered the most significant resistance level in modern financial history. We are trading at $58+, well into price discovery mode.
The "No-BS" Reality: While CRYPTOCAP:BTC is fighting for its life to hold support during this liquidity crunch, Silver has done what "Digital Gold" promised to do but couldn't.
CRYPTOCAP:BTC Status: Flushing leverage, correlating with tech stocks, and failing to act as a hedge.
NASDAQ:XAG Status: Breaking a 45-year suppression cycle to become the #1 performing asset.
The Setup (The Cup & Handle of the Century): This is a 45-year technical structure. The "Cup" started in 1980. The "Handle" ended this month.
The Breakout: $50 is now the floor, not the ceiling.
The Target: The measured move from the 1980 peak targets $85.89 - $89.15.
My Outlook: The "Gold 2.0" narrative is being tested in real-time.
Long NASDAQ:XAG : I am riding this breakout to the $89 target.
The "Re-test" Buy: If we dip back to $50 (the 1980 High), that is a generational buying opportunity. Old resistance must become new support.
Verdict: The "relic" just outperformed the "future." The 1980 curse is dead.
👇 Discussion: Is CRYPTOCAP:BTC failing its "Gold 2.0" audition, or is this just a temporary rotation before Crypto catches up to AMEX:SLV & AMEX:GLD Sectors ? Let me know your targets below.

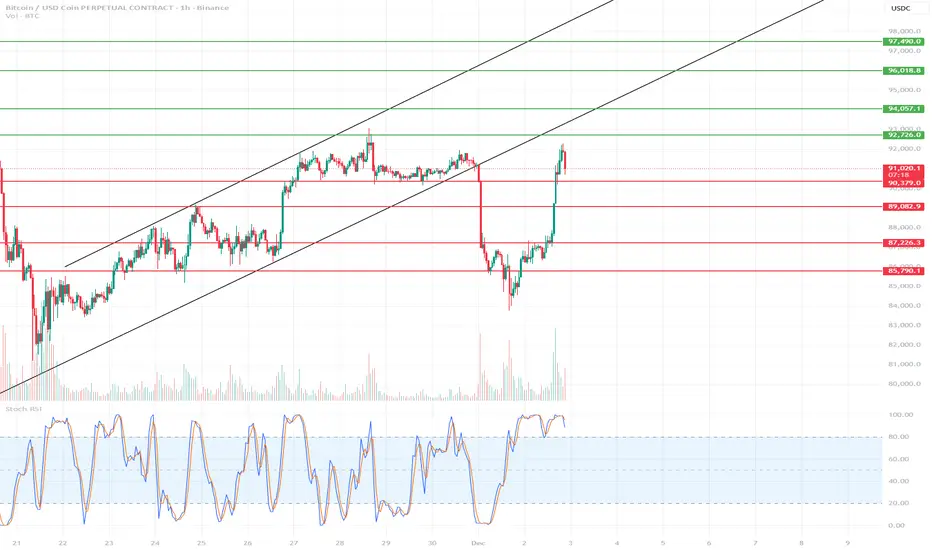
BTC Short-Term Chart 1H🔍 1. Current Market Situation
BTC has made a very strong rebound from around ~87,000 and reached the key resistance zone of 92,700–93,200, where the first signs of a slowdown are currently visible.
The Stoch RSI on the 1-hour timeframe is heavily overbought, which usually suggests a local correction or at least consolidation.
🔴 2. Key Resistance Levels (Short-Term)
92,726 → current resistance; the price has rebounded precisely from this zone.
94,057 → next strong resistance if BTC breaks above 92.7k.
96,018–96,866 → strong supply zone; only after breaking this zone will the uptrend resume in full force.
🟢 3. Major Supports (Short-Term)
90,379 – 90,990 → nearest intraday support zone
89,082 → strong support that halted the previous decline
87,726 → key to the upward structure
85,790 → critical level, a breakout opens the door to a deeper correction
📉 4. Short-Term Baseline Scenario
Most likely in the coming hours:
✔ Scenario A – correction from the current level (preferred)
Stoch RSI overbought
Price rejected from the 92.7k resistance
Large vertical move → market needs to cool down
Correction Targets:
90,900–90,300 → first TP/buy zone
89,100 → deeper correction but still healthy.
Long signal:
Return of h1 candle closes > 91.3k after a pullback.
✔ Scenario B – breakout of 92.7k and continued growth
If BTC breaks and holds above 93,200, upward momentum resumes.
Targets:
94,057
96,000–96,800 (strong supply zone – take profit area)
Bitcoin's Next Move: What 4 Timeframes Reveal Right NowWeekly
A sustained move through the key resistance on this timeframe at105,000 to 110,000, could confirm a reversal. For now, the weekly outlook shows a potential market in correction rather than reversal.
Daily
After dropping nearly 5% yesterday, Bitcoin has rebounded sharply today with a gain of about 6.7%. The price is currently up $5775 at $92,060. Today’s low at $86,190 followed yesterday’s deeper dip to $83,814. The daily chart may suggest further upside potential.
4H
Momentum on RSI has turned higher on the 4-hour chart, lifting from oversold conditions and breaking back above the midline. This suggests improving intraday demand and provides a base for further upside if price continues to hold above the recent breakout level. The next resistance sits around 96,500, the prior swing high on this timeframe.
1H
The hourly timeframe shows the price bouncing back above the 50, 100 and 200-hour moving averages, which are currently clustered around $87,500 and $89,320. If the price stays above these converged moving averages, it can signal continued buying pressure in the near term.

BITCOIN FREE SIGNAL|SHORT|
✅BTCUSD price is approaching the mitigation block after sweeping liquidity inside the premium zone. If the retest confirms displacement, a drawdown into the target imbalance becomes likely.
—————————
Entry: 92,246$
Stop Loss: 93,200$
Take Profit: 90,000$
Time Frame: 4H
—————————
SHORT🔥
✅Like and subscribe to never miss a new idea!✅
