BTCUSD H1 | Pullback resistance triggering bearish reversalBitcoin (BTC/USD) is rising towards the sell entry of 112,278.38, which is a pullback resistance that aligns with the 61.8% Fibonacci retracement and could reverse from this level to the downside.
Stop loss is at 114,720/58, which is a pullback resistance that aligns with the 138.2% Fibonacci extension.
Take profit is at 109,371.71, which is a pullback support.
High Risk Investment Warning
Trading Forex/CFDs on margin carries a high level of risk and may not be suitable for all investors. Leverage can work against you.
Stratos Markets Limited (tradu.com ):
CFDs are complex instruments and come with a high risk of losing money rapidly due to leverage. 65% of retail investor accounts lose money when trading CFDs with this provider. You should consider whether you understand how CFDs work and whether you can afford to take the high risk of losing your money.
Stratos Europe Ltd (tradu.com ):
CFDs are complex instruments and come with a high risk of losing money rapidly due to leverage. 66% of retail investor accounts lose money when trading CFDs with this provider. You should consider whether you understand how CFDs work and whether you can afford to take the high risk of losing your money.
Stratos Global LLC (tradu.com ):
Losses can exceed deposits.
Please be advised that the information presented on TradingView is provided to Tradu (‘Company’, ‘we’) by a third-party provider (‘TFA Global Pte Ltd’). Please be reminded that you are solely responsible for the trading decisions on your account. There is a very high degree of risk involved in trading. Any information and/or content is intended entirely for research, educational and informational purposes only and does not constitute investment or consultation advice or investment strategy. The information is not tailored to the investment needs of any specific person and therefore does not involve a consideration of any of the investment objectives, financial situation or needs of any viewer that may receive it. Kindly also note that past performance is not a reliable indicator of future results. Actual results may differ materially from those anticipated in forward-looking or past performance statements. We assume no liability as to the accuracy or completeness of any of the information and/or content provided herein and the Company cannot be held responsible for any omission, mistake nor for any loss or damage including without limitation to any loss of profit which may arise from reliance on any information supplied by TFA Global Pte Ltd.
The speaker(s) is neither an employee, agent nor representative of Tradu and is therefore acting independently. The opinions given are their own, constitute general market commentary, and do not constitute the opinion or advice of Tradu or any form of personal or investment advice. Tradu neither endorses nor guarantees offerings of third-party speakers, nor is Tradu responsible for the content, veracity or opinions of third-party speakers, presenters or participants.
BTC-USD

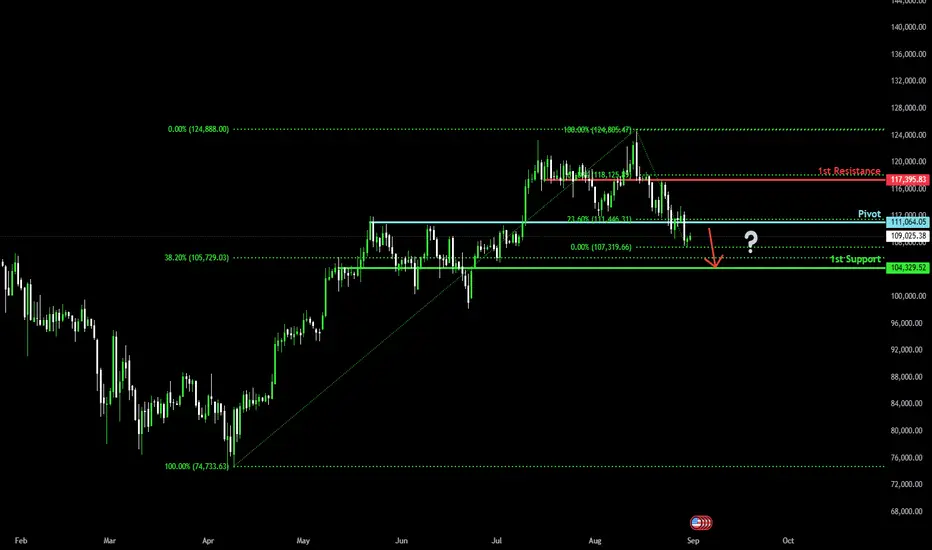
Bearish reversal?The Bitcoin (BTC/USD) is reacting off the pivot which is a pullback resistance and could drop to the 1st support.
Pivot: 112,817.18
1st Support: 104,329.52
1st Resistance: 117,395.83
Disclaimer:
The above opinions given constitute general market commentary, and do not constitute the opinion or advice of IC Markets or any form of personal or investment advice.
Any opinions, news, research, analyses, prices, other information, or links to third-party sites contained on this website are provided on an "as-is" basis, are intended only to be informative, is not an advice nor a recommendation, nor research, or a record of our trading prices, or an offer of, or solicitation for a transaction in any financial instrument and thus should not be treated as such. The information provided does not involve any specific investment objectives, financial situation and needs of any specific person who may receive it. Please be aware, that past performance is not a reliable indicator of future performance and/or results. Past Performance or Forward-looking scenarios based upon the reasonable beliefs of the third-party provider are not a guarantee of future performance. Actual results may differ materially from those anticipated in forward-looking or past performance statements. IC Markets makes no representation or warranty and assumes no liability as to the accuracy or completeness of the information provided, nor any loss arising from any investment based on a recommendation, forecast or any information supplied by any third-party.

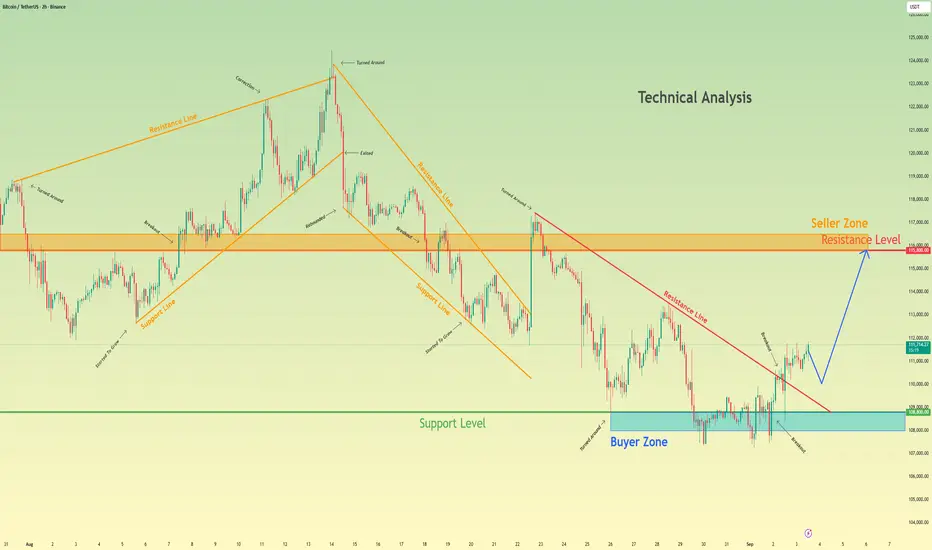
Bitcoin continue to move up to resistance levelHello traders, I want share with you my opinion about Bitcoin. The prolonged corrective phase for Bitcoin appears to be concluding, as the price action signals a significant shift in momentum. After a complex journey through various corrective patterns, the price established a strong support base in the 108800 buyer zone and has now executed a decisive breakout from the final descending resistance line. Currently, following this breakout, the price of BTC is in a strong upward impulse, confirming the new bullish momentum and moving decisively away from the prior consolidation zone. The primary working hypothesis is a long scenario that anticipates a brief corrective movement before the next major leg higher. The expectation is that the price will soon make a small dip to retest the recently broken resistance line, confirming it as new dynamic support. A successful and confirmed bounce from this retest would validate the strength of the breakout and signal that buyers remain in firm control, likely triggering the continuation of the rebound to the upside. Therefore, the TP for this breakout and continuation play is logically placed at the 115800 level, which aligns with the major horizontal resistance level and seller zone. Please share this idea with your friends and click Boost 🚀
BTC/USDT – Short-Term Bearish, Medium-Term Recovery PotentialThe market is under pressure as Bitcoin lost the key $110K level, raising concerns of further selling. However, with major institutions continuing to hold over 1 million BTC, long-term confidence remains intact.
On the 12H chart:
Current price: 111,265 USDT
Near resistance: 112,300 USDT (aligned with EMA34 – 111,794 and EMA89 – 113,283)
Key support: 108,000 USDT, a level likely to provide buying interest
Main scenario:
In the short term, BTC may continue to face selling pressure, testing the 108,000 USDT support before stabilizing.
In the medium term, if this level holds, the price could rebound back toward 112,300 USDT, and potentially break out of the descending channel to the upside.
👉 Overall outlook: Short-term bearish → Neutral → Slightly bullish in the future.

BTCUSD: Selling Pressure Increases – Risk Toward 100,500 USDThe Bitcoin market is under heavy pressure following a series of negative headlines. Expectations of a Fed rate cut have weakened , and the stronger USD has driven capital out of crypto. BTC quickly dropped to around 108,035 USD. At the same time, ETF outflows and large-scale liquidations dragged the price down to a 7-week low , marking a nearly 12% drop from the recent peak. Notably, a whale dumping 24,000 BTC triggered a sharp flash crash, sending BTC plunging within just a few hours.
On the 12H chart, the downtrend is evident: BTC is capped by the descending trendline, while both short-term and long-term EMAs have turned lower. The most likely scenario is a technical rebound toward 109,500 USD before continuing its decline toward the major support at 100,500 USD.
Trading Strategy (for reference):
Prefer Sell on rally near 109,500 USD.
Stop-loss: above 112,000 USD.
Targets: 105,000 USD first, then 100,500 USD.

BTCUSD H4 | Bullish reversalBitcoin (BTC/USD) has reacted off the buy entry, which is a pullback support and could potentially rise to the upside.
Buy entry is at 108,972.79, which is a pullback support.
Stop loss is at 107,232.17, which is a multi-swing low support.
Take profit is at 113,313.88, which is a pullback resistance.
High Risk Investment Warning
Trading Forex/CFDs on margin carries a high level of risk and may not be suitable for all investors. Leverage can work against you.
Stratos Markets Limited (tradu.com ):
CFDs are complex instruments and come with a high risk of losing money rapidly due to leverage. 65% of retail investor accounts lose money when trading CFDs with this provider. You should consider whether you understand how CFDs work and whether you can afford to take the high risk of losing your money.
Stratos Europe Ltd (tradu.com ):
CFDs are complex instruments and come with a high risk of losing money rapidly due to leverage. 66% of retail investor accounts lose money when trading CFDs with this provider. You should consider whether you understand how CFDs work and whether you can afford to take the high risk of losing your money.
Stratos Global LLC (tradu.com ):
Losses can exceed deposits.
Please be advised that the information presented on TradingView is provided to Tradu (‘Company’, ‘we’) by a third-party provider (‘TFA Global Pte Ltd’). Please be reminded that you are solely responsible for the trading decisions on your account. There is a very high degree of risk involved in trading. Any information and/or content is intended entirely for research, educational and informational purposes only and does not constitute investment or consultation advice or investment strategy. The information is not tailored to the investment needs of any specific person and therefore does not involve a consideration of any of the investment objectives, financial situation or needs of any viewer that may receive it. Kindly also note that past performance is not a reliable indicator of future results. Actual results may differ materially from those anticipated in forward-looking or past performance statements. We assume no liability as to the accuracy or completeness of any of the information and/or content provided herein and the Company cannot be held responsible for any omission, mistake nor for any loss or damage including without limitation to any loss of profit which may arise from reliance on any information supplied by TFA Global Pte Ltd.
The speaker(s) is neither an employee, agent nor representative of Tradu and is therefore acting independently. The opinions given are their own, constitute general market commentary, and do not constitute the opinion or advice of Tradu or any form of personal or investment advice. Tradu neither endorses nor guarantees offerings of third-party speakers, nor is Tradu responsible for the content, veracity or opinions of third-party speakers, presenters or participants.

Price drop from overlap resistanceBitcoin (BTC/USD) is rising towards the pivot, which acts as an overlap resistance that lines up with the 23.6% Fibonacci retracement and could drop to the 1st support.
Pivot: 111,064.05
1st Support: 104,329.52
1st Resistance: 117,395.83
Risk Warning:
Trading Forex and CFDs carries a high level of risk to your capital and you should only trade with money you can afford to lose. Trading Forex and CFDs may not be suitable for all investors, so please ensure that you fully understand the risks involved and seek independent advice if necessary.
Disclaimer:
The above opinions given constitute general market commentary, and do not constitute the opinion or advice of IC Markets or any form of personal or investment advice.
Any opinions, news, research, analyses, prices, other information, or links to third-party sites contained on this website are provided on an "as-is" basis, are intended only to be informative, is not an advice nor a recommendation, nor research, or a record of our trading prices, or an offer of, or solicitation for a transaction in any financial instrument and thus should not be treated as such. The information provided does not involve any specific investment objectives, financial situation and needs of any specific person who may receive it. Please be aware, that past performance is not a reliable indicator of future performance and/or results. Past Performance or Forward-looking scenarios based upon the reasonable beliefs of the third-party provider are not a guarantee of future performance. Actual results may differ materially from those anticipated in forward-looking or past performance statements. IC Markets makes no representation or warranty and assumes no liability as to the accuracy or completeness of the information provided, nor any loss arising from any investment based on a recommendation, forecast or any information supplied by any third-party.
BTCUSDT - Strong Downtrend?On the 8H chart of BTCUSDT, a clear descending channel is visible, with key support and resistance levels at 113,200 USD and 105,200 USD. After failing to break the resistance at 113,200 USD, BTCUSDT continued to decline and is now heading toward the support zone at 105,200 USD. Both the EMA (34) and EMA (89) indicators are showing a bearish signal, with EMA (34) below EMA (89), confirming strong selling pressure.
News Impact:
Recently, concerns about cryptocurrency regulations from major countries, especially the US, have caused BTCUSDT to drop sharply. Additionally, adjustments in global financial markets have also impacted investor sentiment, leading to a sell-off of Bitcoin.
Trading Strategy:
Given the current downtrend, traders may consider opening short positions as the price tests the 113,200 USD level again. The next target for the downtrend is the 105,200 USD support level. Place a stop loss if the price unexpectedly breaks above 113,200 USD.

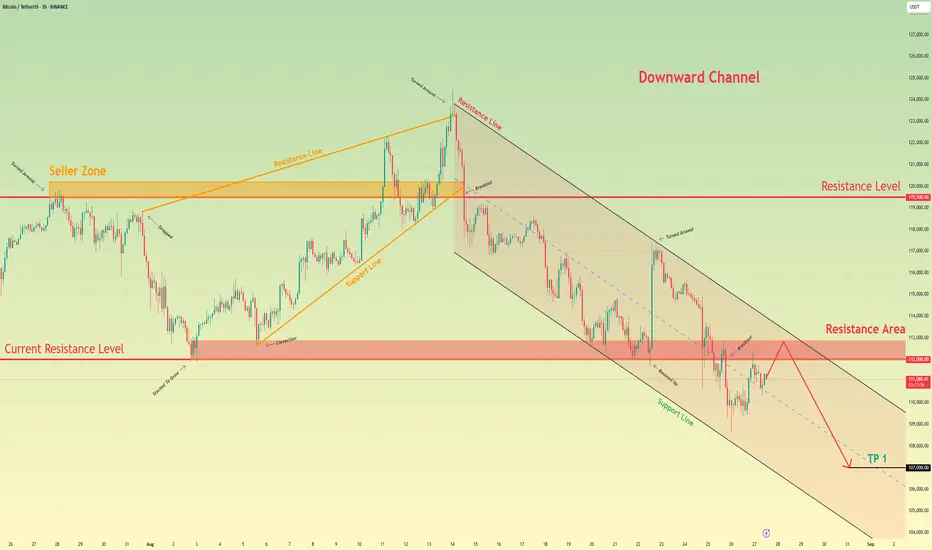
Bitcoin will rebound from resistance area and continue to fallHello traders, I want share with you my opinion about Bitcoin. A distinct shift in market control from buyers to sellers has defined the recent price action for Bitcoin. After the prior upward wedge failed at the major 119500 resistance level, a significant breakdown occurred, initiating the current bearish phase, which has been neatly contained within a downward channel. The price action within this structure has been orderly, consisting of downward impulses followed by corrective rebounds. The most critical recent development was the downward fall that broke below the key horizontal support level at 112000. Currently, the asset is in the midst of an upward rebound, rallying back to test this broken structure from below. The primary working hypothesis is a brief scenario, anticipating that this rally will fail upon entering the 112900 - 112000 resistance zone. A confirmed rejection from this former support area would validate the bearish trend continuation and signal that the next impulsive move down is imminent. Therefore, the TP for this scenario is logically set at 107000 points. Please share this idea with your friends and click Boost 🚀
Potential bearish drop?The Bitcoin (BTC/USD) has rejected off the pivot which acts a a pullback resistance and could drop to the 1st support.
Pivot: 112,875.12
1st Support: 109,694.37
1st Resistance: 117,327.94
Risk Warning:
Trading Forex and CFDs carries a high level of risk to your capital and you should only trade with money you can afford to lose. Trading Forex and CFDs may not be suitable for all investors, so please ensure that you fully understand the risks involved and seek independent advice if necessary.
Disclaimer:
The above opinions given constitute general market commentary, and do not constitute the opinion or advice of IC Markets or any form of personal or investment advice.
Any opinions, news, research, analyses, prices, other information, or links to third-party sites contained on this website are provided on an "as-is" basis, are intended only to be informative, is not an advice nor a recommendation, nor research, or a record of our trading prices, or an offer of, or solicitation for a transaction in any financial instrument and thus should not be treated as such. The information provided does not involve any specific investment objectives, financial situation and needs of any specific person who may receive it. Please be aware, that past performance is not a reliable indicator of future performance and/or results. Past Performance or Forward-looking scenarios based upon the reasonable beliefs of the third-party provider are not a guarantee of future performance. Actual results may differ materially from those anticipated in forward-looking or past performance statements. IC Markets makes no representation or warranty and assumes no liability as to the accuracy or completeness of the information provided, nor any loss arising from any investment based on a recommendation, forecast or any information supplied by any third-party.

Bitcoin: Is the Uptrend Gaining Strength?Bitcoin (BTC) is currently trading around $110,280, after a drop from a recent peak of $116,700. Despite the correction, BTC remains above important support levels, consolidating its uptrend.
Supporting News:
Fed Chair Jerome Powell's remarks at Jackson Hole signal that the Fed may ease tightening measures if the labor market weakens. This has led to a decline in U.S. bond yields and a weaker USD, providing favorable conditions for BTC to maintain its upward momentum.
Technical Analysis:
BTC has broken through the resistance at $116,700 and is now consolidating above support at $108,900. If it stays above this level, BTC could continue targeting $116,700 and possibly even $120,000.
Conclusion:
With the support of Fed policies and a positive market trend, BTC has strong potential for further short-term gains.

Bearish continuation?Bitcoin (BTC/USD) is reacting off the pivot which is a pullback resistance and could drop to the 1st support.
Pivot: 112,442.83
1st Support: 107,898.67
1st Resistance: 114,633.18
Risk Warning:
Trading Forex and CFDs carries a high level of risk to your capital and you should only trade with money you can afford to lose. Trading Forex and CFDs may not be suitable for all investors, so please ensure that you fully understand the risks involved and seek independent advice if necessary.
Disclaimer:
The above opinions given constitute general market commentary, and do not constitute the opinion or advice of IC Markets or any form of personal or investment advice.
Any opinions, news, research, analyses, prices, other information, or links to third-party sites contained on this website are provided on an "as-is" basis, are intended only to be informative, is not an advice nor a recommendation, nor research, or a record of our trading prices, or an offer of, or solicitation for a transaction in any financial instrument and thus should not be treated as such. The information provided does not involve any specific investment objectives, financial situation and needs of any specific person who may receive it. Please be aware, that past performance is not a reliable indicator of future performance and/or results. Past Performance or Forward-looking scenarios based upon the reasonable beliefs of the third-party provider are not a guarantee of future performance. Actual results may differ materially from those anticipated in forward-looking or past performance statements. IC Markets makes no representation or warranty and assumes no liability as to the accuracy or completeness of the information provided, nor any loss arising from any investment based on a recommendation, forecast or any information supplied by any third-party.

BTC/USDT: Breakout, Heading for a Bullish WaveBTC/USDT staged a strong breakout following dovish signals from the Fed at Jackson Hole, which drove capital back into risk assets, with Bitcoin among the biggest beneficiaries. At the same time, Tether’s move to increase transparency by appointing a former White House crypto adviser has further strengthened market confidence, supporting the medium-term bullish outlook.
On the chart, price is seeing a mild correction around 111,000–112,000 but remains within the long-term ascending channel. The 107,800 zone acts as key support; if it holds, BTC could rebound toward the next resistance area near 123,600. Conversely, a break below 107,800 would put the bullish structure at risk.
With favorable news and a strong technical setup, BTC/USDT continues to lean toward an upside scenario, making buy-the-dip strategies attractive.

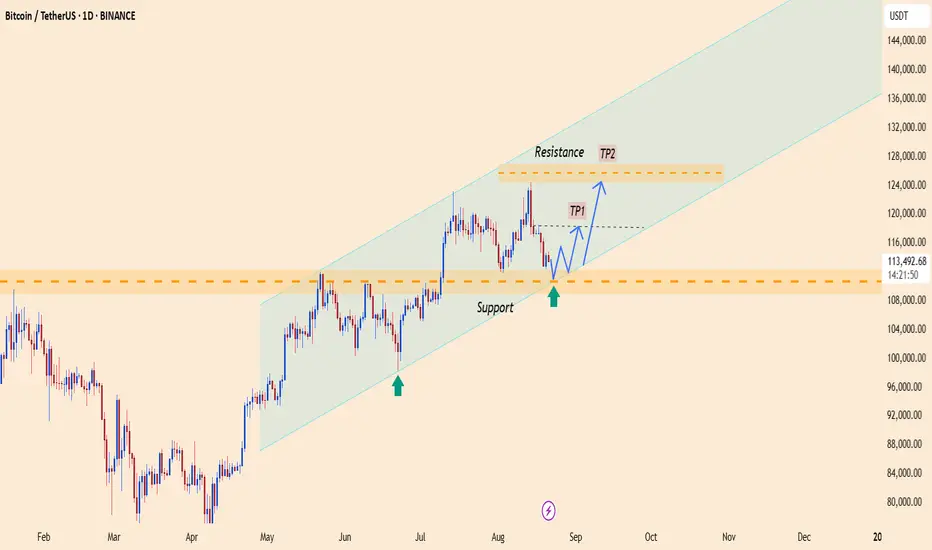
Bitcoin Soars: Buying Opportunity with Strong Uptrend!On the BTCUSDT chart, Bitcoin is trading in an upward channel, with strong support at 111,900 USD. The next target for Bitcoin is 123,400 USD. If BTC holds support at 111,900 USD, the uptrend could continue.
News Impact:
Fed Chairman Jerome Powell hinted at a potential interest rate cut in September, weakening the USD and reducing bond yields, which has led to a flow of money into safe-haven assets like Bitcoin. Additionally, the Trump administration is calling for strong interest rate cuts, which could further weaken the USD and push Bitcoin prices higher.
Conclusion:
With supportive macroeconomic factors and a positive technical trend, Bitcoin could continue to rise strongly in the future. Investors can look for buying opportunities around the 111,900 USD support level and expect the price to reach higher targets like 123,400 USD.

BITCOIN H4 | Potential bearish reversalBased on thee H4 chart analysis,we could see the price rise to the sell entry at 115,666.35, which is a pullbck eistance that is slightly above the 23.6% Fibonacci retracement and could reverse from this level to the take profit.
Stop los is at 118,717.95, which is a pullback resistanc that lines up with the 50% Fibonacci retracement.
Take profit is at 110,541.22, which is a pullback support.
High Risk Investment Warning
Trading Forex/CFDs on margin carries a high level of risk and may not be suitable for all investors. Leverage can work against you.
Stratos Markets Limited (tradu.com ):
CFDs are complex instruments and come with a high risk of losing money rapidly due to leverage. 65% of retail investor accounts lose money when trading CFDs with this provider. You should consider whether you understand how CFDs work and whether you can afford to take the high risk of losing your money.
Stratos Europe Ltd (tradu.com ):
CFDs are complex instruments and come with a high risk of losing money rapidly due to leverage. 66% of retail investor accounts lose money when trading CFDs with this provider. You should consider whether you understand how CFDs work and whether you can afford to take the high risk of losing your money.
Stratos Global LLC (tradu.com ):
Losses can exceed deposits.
Please be advised that the information presented on TradingView is provided to Tradu (‘Company’, ‘we’) by a third-party provider (‘TFA Global Pte Ltd’). Please be reminded that you are solely responsible for the trading decisions on your account. There is a very high degree of risk involved in trading. Any information and/or content is intended entirely for research, educational and informational purposes only and does not constitute investment or consultation advice or investment strategy. The information is not tailored to the investment needs of any specific person and therefore does not involve a consideration of any of the investment objectives, financial situation or needs of any viewer that may receive it. Kindly also note that past performance is not a reliable indicator of future results. Actual results may differ materially from those anticipated in forward-looking or past performance statements. We assume no liability as to the accuracy or completeness of any of the information and/or content provided herein and the Company cannot be held responsible for any omission, mistake nor for any loss or damage including without limitation to any loss of profit which may arise from reliance on any information supplied by TFA Global Pte Ltd.
The speaker(s) is neither an employee, agent nor representative of Tradu and is therefore acting independently. The opinions given are their own, constitute general market commentary, and do not constitute the opinion or advice of Tradu or any form of personal or investment advice. Tradu neither endorses nor guarantees offerings of third-party speakers, nor is Tradu responsible for the content, veracity or opinions of third-party speakers, presenters or participants.

BTC Explodes: Heading Towards New Targets!The BTC/USDT chart shows a strong upward trend, with the price currently trading within a stable ascending channel. Bitcoin has rebounded from the support level at 3,314.700 USD and is now heading towards the next target at 3,372 USD. This price structure, with higher highs and higher lows, indicates that the bullish trend is strengthening. If BTC remains above the support level at 3,334 USD, the probability of continuing the upward movement towards 3,372 USD is very high.
News Supporting the Uptrend:
FOMC Minutes: The dovish tone from the FOMC has weakened the USD, which supports BTC's upward trend.
Jobless Claims: Higher-than-expected jobless claims data signals a weaker economy, pushing BTC higher.
PMI Index: Weak PMI figures reinforce the decline of the USD and create favorable conditions for BTC's price increase.
Trading Strategy:
Buy when BTC stays above the current support level, targeting the next level at 3,372 USD. Protect capital with a reasonable stop loss.
Potential bearish reversal?The Bitcoin (BTC/USD) is rising towards the pivot which acts as a pullback resistance and could reverse to the 1st support, which is a multi swing low support.
Pivot: 116,456.65
1st Support: 112,346.982
1st Resistance: 118,969.64
Risk Warning:
Trading Forex and CFDs carries a high level of risk to your capital and you should only trade with money you can afford to lose. Trading Forex and CFDs may not be suitable for all investors, so please ensure that you fully understand the risks involved and seek independent advice if necessary.
Disclaimer:
The above opinions given constitute general market commentary, and do not constitute the opinion or advice of IC Markets or any form of personal or investment advice.
Any opinions, news, research, analyses, prices, other information, or links to third-party sites contained on this website are provided on an "as-is" basis, are intended only to be informative, is not an advice nor a recommendation, nor research, or a record of our trading prices, or an offer of, or solicitation for a transaction in any financial instrument and thus should not be treated as such. The information provided does not involve any specific investment objectives, financial situation and needs of any specific person who may receive it. Please be aware, that past performance is not a reliable indicator of future performance and/or results. Past Performance or Forward-looking scenarios based upon the reasonable beliefs of the third-party provider are not a guarantee of future performance. Actual results may differ materially from those anticipated in forward-looking or past performance statements. IC Markets makes no representation or warranty and assumes no liability as to the accuracy or completeness of the information provided, nor any loss arising from any investment based on a recommendation, forecast or any information supplied by any third-party.

BTCUSD H4 | Could the price bounce from hereBitcoin (BTC/USD) is falling towards the buy entry at 110,102.76, which is a pullback support that is slightly above the 127.2% Fibonacci extension and the 61.8% Fibonacci retracement and could bounce from this level to the upside.
Stop will be at 105,282.37, which is a pullback support that is slightly above the 78.6% Fibonacci retracement.
Take profit is at 116,140.42, which is a pullback resistance.
High Risk Investment Warning
Trading Forex/CFDs on margin carries a high level of risk and may not be suitable for all investors. Leverage can work against you.
Stratos Markets Limited (tradu.com ):
CFDs are complex instruments and come with a high risk of losing money rapidly due to leverage. 65% of retail investor accounts lose money when trading CFDs with this provider. You should consider whether you understand how CFDs work and whether you can afford to take the high risk of losing your money.
Stratos Europe Ltd (tradu.com ):
CFDs are complex instruments and come with a high risk of losing money rapidly due to leverage. 66% of retail investor accounts lose money when trading CFDs with this provider. You should consider whether you understand how CFDs work and whether you can afford to take the high risk of losing your money.
Stratos Global LLC (tradu.com ):
Losses can exceed deposits.
Please be advised that the information presented on TradingView is provided to Tradu (‘Company’, ‘we’) by a third-party provider (‘TFA Global Pte Ltd’). Please be reminded that you are solely responsible for the trading decisions on your account. There is a very high degree of risk involved in trading. Any information and/or content is intended entirely for research, educational and informational purposes only and does not constitute investment or consultation advice or investment strategy. The information is not tailored to the investment needs of any specific person and therefore does not involve a consideration of any of the investment objectives, financial situation or needs of any viewer that may receive it. Kindly also note that past performance is not a reliable indicator of future results. Actual results may differ materially from those anticipated in forward-looking or past performance statements. We assume no liability as to the accuracy or completeness of any of the information and/or content provided herein and the Company cannot be held responsible for any omission, mistake nor for any loss or damage including without limitation to any loss of profit which may arise from reliance on any information supplied by TFA Global Pte Ltd.
The speaker(s) is neither an employee, agent nor representative of Tradu and is therefore acting independently. The opinions given are their own, constitute general market commentary, and do not constitute the opinion or advice of Tradu or any form of personal or investment advice. Tradu neither endorses nor guarantees offerings of third-party speakers, nor is Tradu responsible for the content, veracity or opinions of third-party speakers, presenters or participants.

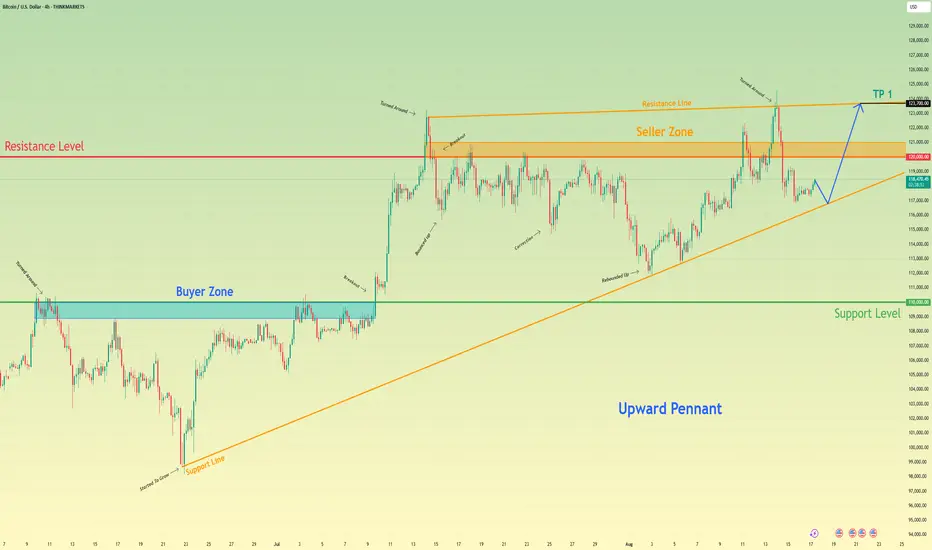
Bitcoin may bounce up of support line and break resistance levelHello traders, I want share with you my opinion about Bitcoin. Following a powerful upward trend and a significant breakout, bitcoin has established a new and higher territory for its price action, leading into the current phase of extensive consolidation. This consolidation has taken the form of a large upward pennant, a classic pattern of contracting volatility where the price is being squeezed between a descending resistance line and an ascending support line. The market has been rotating within these boundaries, with the seller zone around the 120000 resistance level capping rallies and the dynamic support line providing a floor for pullbacks. Currently, the asset is positioned at a critical juncture, testing the ascending support line of this multi-week formation after a corrective move down. The primary working hypothesis is a long scenario, based on the expectation of a successful upward rebound from this dynamic support. A confirmed bounce would validate the integrity of the pennant and suggest that another full rotation to the upside is the most probable path. This move would first challenge the horizontal resistance at 120000. Therefore, the ultimate TP for this rotational play is logically set at the 123700 level, as this precisely targets the upper resistance line of the pennant, representing the completion of the swing and a key decision point for a potential future breakout. Please share this idea with your friends and click Boost 🚀
Disclaimer: As part of ThinkMarkets’ Influencer Program, I am sponsored to share and publish their charts in my analysis.
Bullish continuation for the Bitcoin?The price is falling towards the pivot which acts as an overlap support and could bounce to the 127.2% Fibonacci resistance.
Pivot: 111,783.38
1st Support: 98,421.14
1st Resistance: 126,406.21
Risk Warning:
Trading Forex and CFDs carries a high level of risk to your capital and you should only trade with money you can afford to lose. Trading Forex and CFDs may not be suitable for all investors, so please ensure that you fully understand the risks involved and seek independent advice if necessary.
Disclaimer:
The above opinions given constitute general market commentary, and do not constitute the opinion or advice of IC Markets or any form of personal or investment advice.
Any opinions, news, research, analyses, prices, other information, or links to third-party sites contained on this website are provided on an "as-is" basis, are intended only to be informative, is not an advice nor a recommendation, nor research, or a record of our trading prices, or an offer of, or solicitation for a transaction in any financial instrument and thus should not be treated as such. The information provided does not involve any specific investment objectives, financial situation and needs of any specific person who may receive it. Please be aware, that past performance is not a reliable indicator of future performance and/or results. Past Performance or Forward-looking scenarios based upon the reasonable beliefs of the third-party provider are not a guarantee of future performance. Actual results may differ materially from those anticipated in forward-looking or past performance statements. IC Markets makes no representation or warranty and assumes no liability as to the accuracy or completeness of the information provided, nor any loss arising from any investment based on a recommendation, forecast or any information supplied by any third-party.

BTCUSD H4 | Bullish bounce offBitcoin (BTC/USD) has reacted off the buy entry of 117.387.77, which is a pullback support that aligns with the 61.8% Fibonacci retracement and could rise from this level to the upside.
Stop loss is at 113,331.94, which is a swing low support.
Take profit is at 122,526.14, which is a multi swing high resistance.
High Risk Investment Warning
Trading Forex/CFDs on margin carries a high level of risk and may not be suitable for all investors. Leverage can work against you.
Stratos Markets Limited (tradu.com ):
CFDs are complex instruments and come with a high risk of losing money rapidly due to leverage. 65% of retail investor accounts lose money when trading CFDs with this provider. You should consider whether you understand how CFDs work and whether you can afford to take the high risk of losing your money.
Stratos Europe Ltd (tradu.com ):
CFDs are complex instruments and come with a high risk of losing money rapidly due to leverage. 66% of retail investor accounts lose money when trading CFDs with this provider. You should consider whether you understand how CFDs work and whether you can afford to take the high risk of losing your money.
Stratos Global LLC (tradu.com ):
Losses can exceed deposits.
Please be advised that the information presented on TradingView is provided to Tradu (‘Company’, ‘we’) by a third-party provider (‘TFA Global Pte Ltd’). Please be reminded that you are solely responsible for the trading decisions on your account. There is a very high degree of risk involved in trading. Any information and/or content is intended entirely for research, educational and informational purposes only and does not constitute investment or consultation advice or investment strategy. The information is not tailored to the investment needs of any specific person and therefore does not involve a consideration of any of the investment objectives, financial situation or needs of any viewer that may receive it. Kindly also note that past performance is not a reliable indicator of future results. Actual results may differ materially from those anticipated in forward-looking or past performance statements. We assume no liability as to the accuracy or completeness of any of the information and/or content provided herein and the Company cannot be held responsible for any omission, mistake nor for any loss or damage including without limitation to any loss of profit which may arise from reliance on any information supplied by TFA Global Pte Ltd.
The speaker(s) is neither an employee, agent nor representative of Tradu and is therefore acting independently. The opinions given are their own, constitute general market commentary, and do not constitute the opinion or advice of Tradu or any form of personal or investment advice. Tradu neither endorses nor guarantees offerings of third-party speakers, nor is Tradu responsible for the content, veracity or opinions of third-party speakers, presenters or participants.

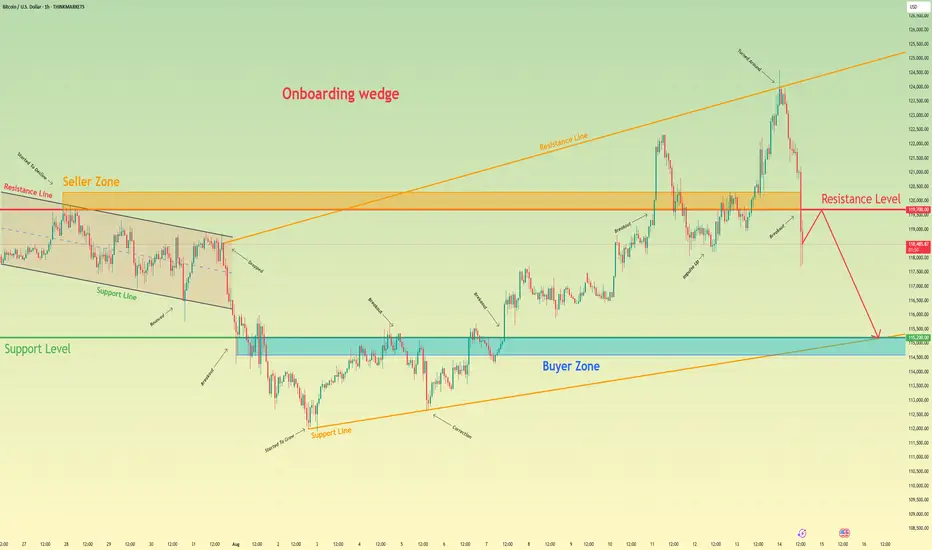
Bitcoin may continue to decline to support level in wedgeHello traders, I want share with you my opinion about Bitcoin. The market structure for Bitcoin has evolved significantly, transitioning from a contained downward channel into a much more volatile and expansive broadening wedge after a major breakout. This new pattern has defined a wide trading range, with price action making higher highs and lower lows, indicating a fierce battle between market participants. The most recent and critical development within this structure has been the price's failure to hold above the key level of 119700, breaking down below this former support and seller zone. Currently, the asset appears to be in a corrective phase, setting up for a potential retest of this broken level from underneath. The primary working hypothesis is a short scenario, which anticipates that the price will rally to test the 119700 resistance level and be rejected. A confirmed failure to reclaim this level would serve as a strong validation of the bearish pressure and suggest that a full rotation towards the bottom of the broadening wedge is now the most probable outcome. Therefore, the tp is logically and strategically placed at the 115200 level. This target is particularly significant as it represents a powerful confluence of the horizontal support level, the main buyer zone, and the ascending support line of the wedge, making it a natural magnet for price on the next major downward impulse. Please share this idea with your friends and click Boost 🚀
Disclaimer: As part of ThinkMarkets’ Influencer Program, I am sponsored to share and publish their charts in my analysis.
BITCOIN H4 | Bullish bounce off 50% Fib supportBTC/USD is falling towards the buy entry whihc acts as a pullback support that aligns with the 50% Fibonacci retracement and could bounce to the take profit.
Buy entry is at 117,165.96, which is a pullback support that lines up with the 50% Fibonacci retracement.
Stop loss is at 113,331.94, which is a swing low support.
Take profit is at 122,526.14, which is a multi swing high resistance.
High Risk Investment Warning
Trading Forex/CFDs on margin carries a high level of risk and may not be suitable for all investors. Leverage can work against you.
Stratos Markets Limited (tradu.com ):
CFDs are complex instruments and come with a high risk of losing money rapidly due to leverage. 65% of retail investor accounts lose money when trading CFDs with this provider. You should consider whether you understand how CFDs work and whether you can afford to take the high risk of losing your money.
Stratos Europe Ltd (tradu.com ):
CFDs are complex instruments and come with a high risk of losing money rapidly due to leverage. 66% of retail investor accounts lose money when trading CFDs with this provider. You should consider whether you understand how CFDs work and whether you can afford to take the high risk of losing your money.
Stratos Global LLC (tradu.com ):
Losses can exceed deposits.
Please be advised that the information presented on TradingView is provided to Tradu (‘Company’, ‘we’) by a third-party provider (‘TFA Global Pte Ltd’). Please be reminded that you are solely responsible for the trading decisions on your account. There is a very high degree of risk involved in trading. Any information and/or content is intended entirely for research, educational and informational purposes only and does not constitute investment or consultation advice or investment strategy. The information is not tailored to the investment needs of any specific person and therefore does not involve a consideration of any of the investment objectives, financial situation or needs of any viewer that may receive it. Kindly also note that past performance is not a reliable indicator of future results. Actual results may differ materially from those anticipated in forward-looking or past performance statements. We assume no liability as to the accuracy or completeness of any of the information and/or content provided herein and the Company cannot be held responsible for any omission, mistake nor for any loss or damage including without limitation to any loss of profit which may arise from reliance on any information supplied by TFA Global Pte Ltd.
The speaker(s) is neither an employee, agent nor representative of Tradu and is therefore acting independently. The opinions given are their own, constitute general market commentary, and do not constitute the opinion or advice of Tradu or any form of personal or investment advice. Tradu neither endorses nor guarantees offerings of third-party speakers, nor is Tradu responsible for the content, veracity or opinions of third-party speakers, presenters or participants.
