BTC BREAKING NEWS OR BREAKING CHARTS?📰 BREAKING NEWS OR BREAKING CHARTS?
TRUMP IMPOSES TARIFFS, CAUSING A BITCOIN BLOODBATH — $20,000 DRAWDOWN IN 2 HOURS!
Bitcoin was sitting comfortably at $121,000, before a sudden macro shock — triggered by newly imposed U.S. tariffs — sent prices spiraling down to $100,000 in a matter of hours.
Bulls were liquidated. Bears rejoiced.
Now, the market stands at a crossroads: will this become a major dump continuation, or the foundation for a secret pump?
Chart Overview & Structure
On the high timeframe, BTC continues to trade within a rising wedge formation, with price now showing a significant wick rejection from the upper boundary. This move suggests a potential shift in market structure — a moment that’s likely to shake inexperienced traders. The chart reveals a clear supply and demand structure:
Supply Zone: $123,452 – $130,000
D emand Zone: $98,826 – $101,400
These zones define the battlefield between bulls and bears. In addition, eight psychological levels dominate the chart — $100K, $105K, $110K, $115K, $120K, $125K, and $130K — each representing potential liquidity clusters and reaction points.
Adding to the complexity, we can see a golden pocket (0.618–0.65 retracement) forming around $106,000, perfectly aligning with prior swing lows and the midpoint of a large Fair Value Gap (FVG) overhead. This zone could serve as a reversal or continuation point depending on whether price can reclaim and hold above the major support trendline.
Technical Insights
The market has now tapped the rising wedge resistance three times, with the last tap forming a wick above $125K, triggering liquidity before the sharp collapse. This aligns with the classical exhaustion behavior of wedges. Moreover, a potential Head and Shoulders structure is beginning to emerge, with the right shoulder aligning near $115K — a confluence area that may attract strong bearish attention.
For now, price is testing the lower support trendline — a crucial pivot area for determining whether BTC continues to break down toward demand or consolidates for recovery. This structure creates a make-or-break zone that will define the next macro leg.
Bullish Scenario
Despite the panic, this could be a classic liquidity flush — a “flush candle” event designed to wipe out leveraged long positions before a larger move upward. If BTC can maintain structure above the major support line and close above $106K–$110K, it opens the door for a relief rally.
A reclaim of $115K would confirm buyer strength.
Sustained momentum could push BTC back into the $120K–$125K range to retest the broken supply zone.
Breaking through $125K would invalidate the bearish wedge, potentially igniting a run toward $130K+ and even new highs in “Pump-tober.”
In this scenario, the deep liquidation event becomes fuel for a massive short squeeze, driving momentum and reigniting bullish sentiment across crypto markets.
Bearish Scenario
On the flip side, if BTC fails to hold above $106K or decisively breaks below the demand zone at $98K, it would confirm a rising wedge breakdown.
Below $100K, momentum could accelerate toward $95K–$92K — the next liquidity pools and volume gaps.
The Head and Shoulders completion would confirm the bearish reversal structure, further strengthening the downside case.
Macro sentiment, fueled by geopolitical and policy fears, could add weight to the bearish outlook.
A rejection from $115K without sustained reclaim would also reinforce the bearish continuation pattern, with every psychological level above turning into resistance.
Summary
Bitcoin is at an inflection point — the $100K–$115K range will define the next macro move.
The recent wick and structure breakdown hint at weakness, but the flush candle and liquidity sweep also suggest that a bullish rebound could be on the horizon.
In short:
Above $115K → Bullish continuation possible.
Below $100K → Bearish expansion likely.
With volatility at its peak, traders should expect massive liquidity hunts, fakeouts, and emotional traps on both sides.
Whether this becomes the start of a macro correction or a secret accumulation phase before a major pump — the next few daily closes will tell the story.
BTC

$BTC.D Head and Shoulders + Death CrossWho remembers when I put out this Head & Shoulders idea for CRYPTOCAP:BTC.D September 2nd? 🤓
On the verge of the 20 / 50 WMA Death Cross ☠️
This SHOULD be the top for ₿itcoin Dominance.
Does not mean that it won't float around here for a few weeks tho 🫶

The key is whether the upward trajectory can continue
Hello, fellow traders.
If you "Follow," you'll always get the latest information quickly.
Have a great day.
-------------------------------------
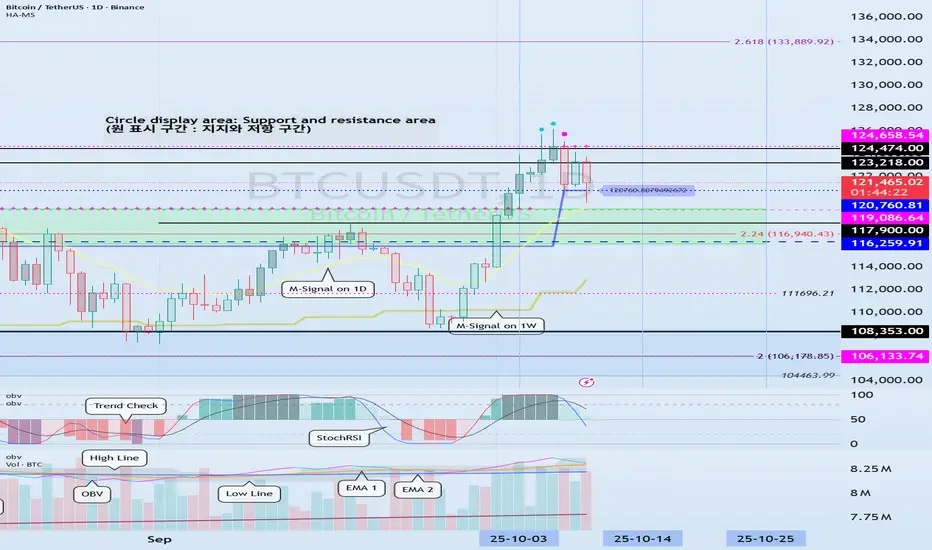
(BTCUSDT 1D chart)
The price rose after forming a DOM(-60) ~ HA-Low range, and is now forming a HA-High ~ DOM(60) range, showing a upward trajectory.
Trend-wise, a decline below the M-Signal indicator on the 1W chart is likely to initiate a downtrend, and a decline below the M-Signal indicator on the 1M chart is expected to initiate a downtrend.
Therefore, when the price falls to the HA-High ~ DOM (60) range, it's important to identify support and resistance levels formed at the M-Signal indicator on the 1W chart.
-
Therefore, it's important to maintain the price above the 116259.91-119086.64 range.
The next important range is the 104463.99-108353.0 range.
-
To break above these key levels or ranges,
- The StochRSI indicator must be trending upward. If possible, it's best to avoid entering the overbought zone.
- The On-By-Signal (OBV) indicator must be trending upward. If possible, it should remain above the High Line.
- The TC (Trend Check) indicator should show an upward trend. If possible, it should remain above the 0 level.
If the above conditions are met, an upward breakout of the HA-High ~ DOM (60) range is expected.
The next period of volatility is expected around October 14th (October 13th-15th).
-
Thank you for reading to the end.
I wish you successful trading.
--------------------------------------------------
- This is an explanation of the big picture.
(3-year bull market, 1-year bear market pattern)
I will explain in more detail when the bear market begins.
------------------------------------------------------
$BTC 200DMA Retest Prophecy Has Been FULFILLED!Ladies and Gents,
the 200D Retest Prophecy has been FULFILLED!
At 186 days, this was the second longest retest after a Death Cross in Bitcoin's history.
If PA convincingly reclaims the 50MA, that should mark the bottom.
PA looks like it will close the day outside of the DANGER ZONE, so I'm hopeful 🤓

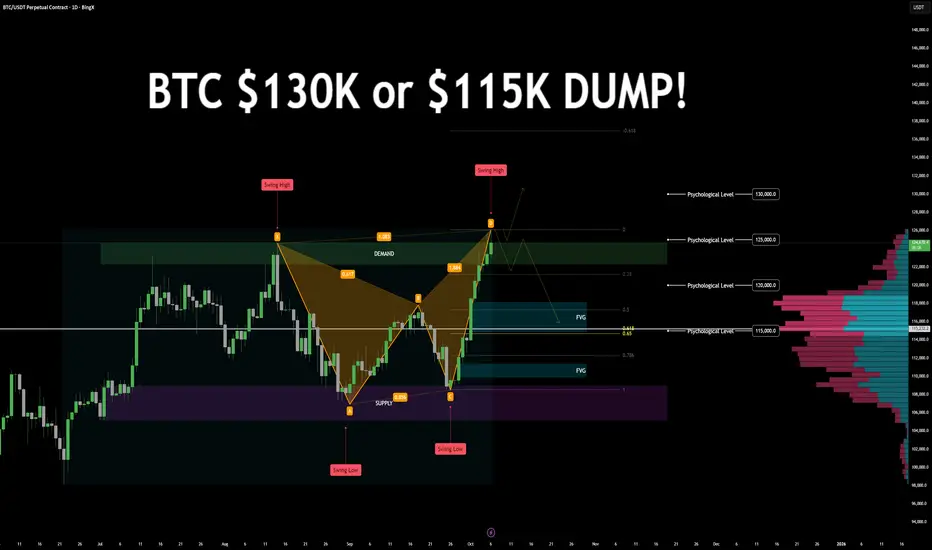
$BTC Daily chart $130K! or $115k DUMPBTC/USDT – Bearish Harmonic Formation | Key Levels & Scenarios
Technical Overview:
Price is currently forming a bearish harmonic pattern, approaching a key decision zone. The next few daily candles will determine whether BTC continues its bullish trend or initiates a corrective phase.
Key Zones
Demand: 122.2K – 124.7K
Supply: 105.1K – 108.9K
Psychological Levels: 130K · 125K · 120K · 115K
Golden Pocket: Around 115K (0.618–0.65 retracement)
Fair Value Gaps (FVGs):
115K–118K
110K (secondary FVG)
Swing Points:
Previous Swing Low: 108K
Previous Swing High: 126K
High Volume Nodes: 118K and 115K
Market Structure
BTC is respecting a consistent bullish leg with limited pullbacks. Price recently swept the 125K psychological level, aligning with harmonic completion and demand resistance.
Scenario Outlook
🔼 Bullish Continuation:
A daily close above the 124.7K demand zone could invalidate the bearish harmonic and signal continuation toward 130K+ targets.
🔽 Bearish Reversal:
A close below the previous day’s candle low may confirm the start of a bearish correction, targeting 118K → 115K, and potentially 110K.
Bearish Confluences
Bearish Harmonic Pattern completion near key resistance.
Golden Pocket + FVG + Psychological + Volume confluence at 115K.
Extended bullish leg with no significant retracement, followed by 125K liquidity sweep.
LET me know your thoughts below!
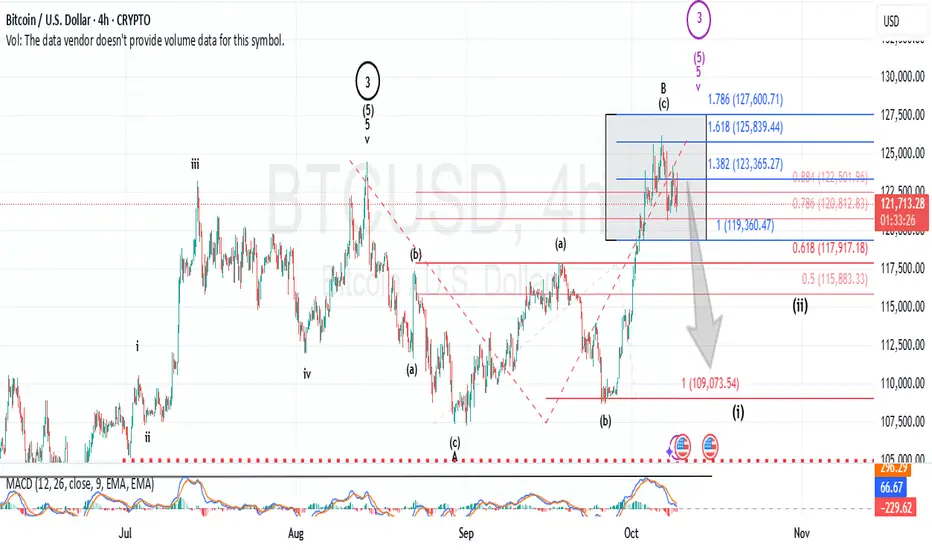
Simple, But NuancedIn my September 20th update titled “Bitcoin Has Appeared to Have Struck a Meaningful Top,” I noted that a top in the premier cryptocurrency was expected and likely imminent. Since that post, however, Bitcoin has reached a new all-time high, moving contrary to that prior expectation.
My interpretation of this updated price action is simple, but nuanced.
Simple in the sense that, since the September 20th update, price has only advanced in three waves, a hallmark of corrective, not impulsive , movement. Nuanced in the sense that, at times, corrective patterns can extend beyond prior highs and still maintain their corrective nature, as long as the internal structure remains a three-wave pattern.
Some may point out that the prevailing trend has appeared bullish since the June 25th low at $98,242. Yet, in my view, the August 13th high at $124,501.31 completed all the necessary wave components for a terminal structure. While it’s rare, retracements can exceed prior highs and still be valid as part of a corrective sequence, structure is what determines that validity, not price level alone.
That said, if Bitcoin does continue higher and makes an incremental new high, I will adopt my alternative count, which assumes the August 13th top was off by one degree and that the final fifth wave is only now completing.
While these distinctions may seem technical, they are crucial. If the recent rally represents an irregular B-wave correction, it leaves the door open for a C-wave decline potentially forming a flat structure or a retracement that falls short of the initial A-wave low. Conversely, should another marginal high occur first, it would still likely mark a major peak, only delaying the onset of the broader corrective phase.
In summary, absent a new incremental high, my expectation is for a C-wave decline targeting the low $109,000 region minimum , as the next major phase of Bitcoin’s correction.
Bear market has startedThe End of the Bull Cycle. Why I'm Selling Everything and Won't Buy Again Until September 2026.
For the last year and a half, I have said that we are in a bull market. I never once changed my opinion. But all things come to an end. The time has come.
September 13, 2025, the date I have been mentioning across my social media, was, in my opinion, the peak of this market cycle. As painful as it may sound, the bull market is over.
"Altseason" is a Scam. It's Time to Grow Up
Let's be honest. The "altseason" that everyone was dreaming of never happened. Yes, there were pumps on selective, mostly new coins. But the old guard, for the most part, showed nothing.
Therefore, I want to officially declare: I will never use the word "altseason" again. It's a meme from 2017. There are now over a million coins on the market. Liquidity is so diluted that pumping everything is impossible. Instead of "altseason," we have, and always will have, "selective pumps" driven by interested players. Our job is to learn how to find them, not to wait for a mythical wave that will lift all boats.
Why Now? The Classic Signs of a Top
I wouldn't be so certain if I didn't see the classic signs of euphoria that always appear at the top of a cycle:
- Universal Optimism: Governments are embracing crypto, creating reserve funds.
-Corporate Buying: Public companies are massively buying Bitcoin and Ethereum.
-Positive News: The media is filled with only positive news; no one wants to sell and is waiting for $200k, $300k, $500k.
When the crowd rushes into the market, smart money begins to exit. I prefer to be with the latter.
My Personal 2-Year Plan. Maximum Transparency
I'm not just saying the market will fall. I am publicly sharing my plan of action:
1. I am exiting the market into stablecoins NOW. I am locking in my profits.
2. I will NOT be buying the first correction. When Bitcoin drops to $90,000, most people will be buying, thinking it's a discount. I will not.
3. I plan to start actively buying again in September 2026.
Why so long? Because those who buy at the $90-100k mark risk sitting through two years of psychological and financial drawdown just to break even. I am not willing to pay that price. I won't disconnect from the market; I'll keep my finger on the pulse, but I don't plan on making any active buys.
Cycles Work. My Technical Rationale
My decision is not based on emotion but on cycle theory, which I have tested for years. The cycle consists of ~151 weeks of growth and ~51 weeks of decline. We have just completed the growth phase. The period between September 13 and October 6 is the exact reversal zone after which a decline should begin.
I could be wrong. No one can be right all the time. Perhaps the cycle theory will break this time. But I trust my system.
Conclusion: What's Next? The Long-Term View
I have not become a bear forever. I believe Bitcoin will hit $300,000. But not in the coming months. It will be worth that in 2.5 years, after a healthy 50-60% correction from the peak.
From this moment on, my bias is bearish. On strong upward bounces, I might even open short positions. A new game is beginning, with new rules. My job is to preserve my capital and multiply it in the next cycle. What about yours?
Why bear market started now Proofs:
Best regards EXCAVO

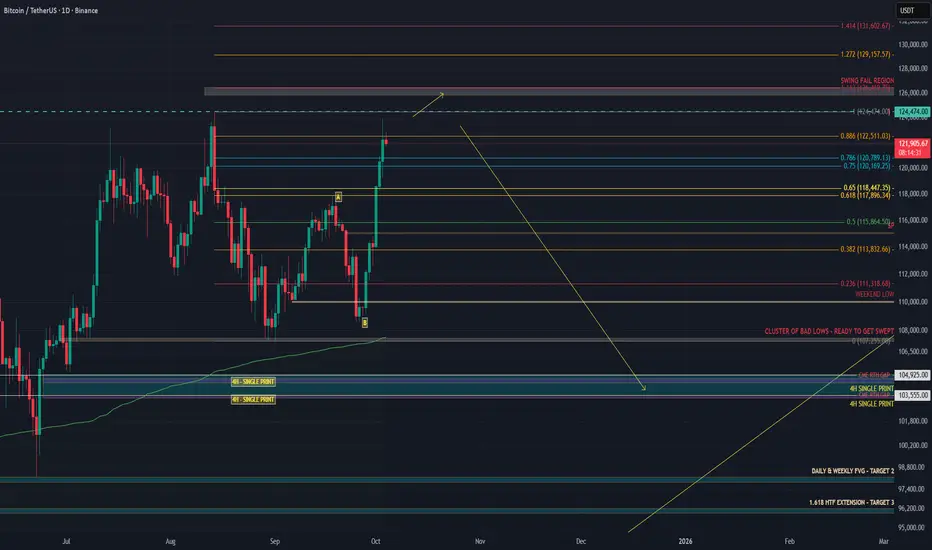
BITCOIN’S FINAL TRAP – THE SENTIMENT SWITCH IS COMING FASTIn my last BTC post I said a dump was likely based on data, and that thesis still stands. If anything, it’s even stronger now. .
On 13 August, CME made a high at 123,590.
That high was weak, no excess, flat TPO top, unfinished auction.
Binance topped at 124,474, Coinbase at 124,522.
CME opened with a gap down, leaving that poor high unrepaired with unfinished business and clean liquidity sitting above.
From 26 September, BTC started grinding up.
I expected a run of the 18 September high and a reversal around 118–119K, but price extended the move to the 1.618 extension. See my last analysis.
Structure was weak, spot CVD flat, futures CVD ripping, open interest climbing.
That shows perps were driving it, not real spot demand.
This week CME finally cleaned it up.
CME ripped through 125,025, taking out the August high at 123,590.
That level matched the old highs on Binance and Coinbase almost perfectly.
CME swept the old poor high left behind by spot and perps, completing the auction.
This is typical CME behavior, it hunts untested reference points during RTH and often reverses right after.
Flow data confirms the setup:
Spot CVD down means real buyers not following.
Stablecoin CVD pushing up means overleveraged longs chasing.
Coin-margined CVD rolling means profit taking or hedge flow.
Open interest flat at the top means trapped longs with no squeeze left.
The move looks like a leveraged markup driven by perps, cleaned up by CME liquidity, and now hanging on air.
CME repaired the August inefficiency, swept the prior spot high, and left another weak high with no excess, a textbook sign of distribution.
There’s still a chance we see one more SFP around 126K before momentum flips, but unless spot demand picks up aggressively, that should be the final liquidity grab.
My targets are 104K and 99K if 104K fails to hold, with potential for an even deeper drop beyond that level.
BTCToday, BINANCE:BTCUSDT.P dropped by around 17%. It may fall further, or it may not — but one thing I know for sure: market panic has always been my most profitable time. When fear dominates and the entire market is crashing, that’s when the best opportunities appear.
If you panic — you’re far from professionalism. If you enter, take your profit, and calmly move on — that’s a sign of skill. In trading, professionalism isn’t optional; without it, you won’t survive — and sometimes that’s quite literal.
So, in times like these — when some made quick profits, others took heavy losses, and only a few truly gained — I’ll share a thought that changed my mindset years ago. After losing a significant amount, I realized that was the true cost of the trading education I once wanted to buy.
Trade with minimal risk and invest the rest in your learning — it’s always the right investment.
And just to be clear — I don’t sell courses, and this message isn’t for profit.
It’s genuine advice. Have a great day.

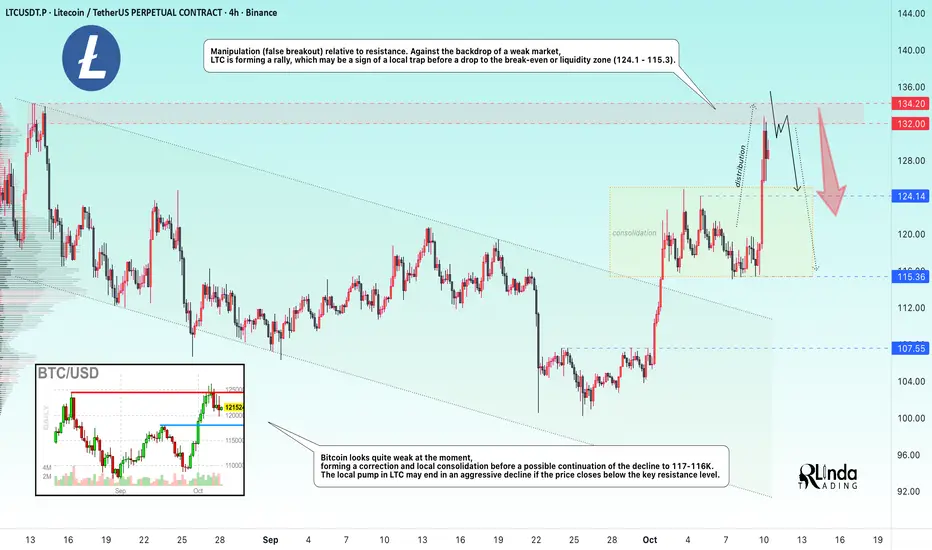
LTCUSDT → False breakout of resistance...BINANCE:LTCUSDT is forming a distribution pattern after local consolidation. The price is testing the resistance zone and forming a false breakout, but there is a but. The cryptocurrency market is in correction...
Bitcoin looks quite weak at the moment, forming a correction and local consolidation before a possible continuation of the decline to 117-116K. The local pump in LTC may end in an aggressive decline if the price closes below the key resistance level.
Manipulation (false breakout) relative to resistance. Against the backdrop of a weak market, LTC is forming a rally, which may be a sign of a local trap before a drop to the break-even or liquidity zone (124.1 - 115.3).
Resistance levels: 132.0, 134.2
Support levels: 124.14, 115.36
A false breakout of resistance, while the entire altcoin market is declining, looks like a hunt for liquidity before catching up with the main market. Accordingly, confirmation of a false breakout of the resistance zone could trigger a drop in LTC.
Sincerely, R. Linda!
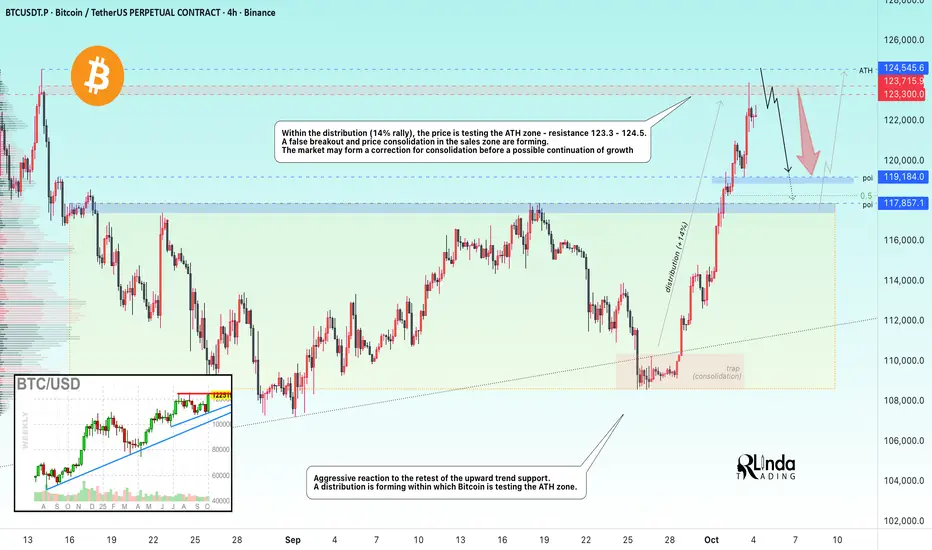
BITCOIN → False breakout of the all-time high zoneBINANCE:BTCUSDT is rising amid the US government shutdown and testing the all-time high zone and resistance at 123.3K - 123.7K. A false breakout has formed and the market is moving into local consolidation.
The price is reacting aggressively to the retest of the uptrend support. A rally is forming, and Bitcoin is testing the ATH zone. As part of the distribution (14% rally), the price reaches an important resistance zone, behind which lies a liquidity pool - 123.3K - 124.5K. However, the growth ends with a false breakout and subsequent price consolidation in the sales zone. To break through such a strong zone, the market needs significant consolidation, which is currently lacking, and the news that caused the price to grow so strongly has already partially exhausted its potential. Thus, the market may move into consolidation, correction to accumulate potential, or wait for the next bullish driver.
Resistance levels: 123.3K, 123.7K, 124.5K
Support levels: 119.2K, 117.8K
I do not rule out the possibility of a retest of 123.7 - 124.5, but technically, on Friday, the market began a sell-off (profit-taking), forming a sufficiently long shadow on the daily candlestick. In the medium term, I expect a correction to the local break-even and imbalance zone of 119K - 117K before another attempt at growth is made
Best regards, R. Linda!
BITCOIN Are you worried about this?Bitcoin (BTCUSD) is pulling back aggressively today following Trump's China-tariffs related news and this weekly rejection is far from ideal technically as well.
In recent years it's been unusual to look at the market on anything but a logarithmic scale, which is natural as it offers a fair representation of BTC's remarkable gains and parabolic Cycles.
On today's analysis however we present the long-term price action on the 1W time-frame without being on the log scale. And as you can see what stands out is a Higher Highs trend-line that dates back to the December 11 2017 Cycle Top, almost 8 years ago.
This trend-line is anything but comforting at the moment as it has caused numerous rejections with the strongest being the April 12 2021 High. More recently it has formed the July 14 2025 High, the August 11 2025 High, last week's (September 29 2025) High and so far the current one (October 06 2025).
This is far from ideal and it gets worse seeing that since the March 04 2024 High, the 1W RSI has been under Lower Highs, which is of course a Bearish Divergence against the markets Higher Highs, similar to the Lower Highs of the previous Cycle that formed the November 08 2021 Top.
This time is indeed a little different though as the RSI's current 3rd Lower High is still a Higher High for BTC while on the previous Cycle it was (March 21 2022) already a Lower High for the price as well inside a Bear Cycle that has already started.
Still, do you believe this 8-year Higher Highs trend-line rejection is alarming or not? Feel free to let us know in the comments section below!
-------------------------------------------------------------------------------
** Please LIKE 👍, FOLLOW ✅, SHARE 🙌 and COMMENT ✍ if you enjoy this idea! Also share your ideas and charts in the comments section below! This is best way to keep it relevant, support us, keep the content here free and allow the idea to reach as many people as possible. **
-------------------------------------------------------------------------------
💸💸💸💸💸💸
👇 👇 👇 👇 👇 👇

BTC MARKET UPDATE
🔥 **$117K-$115K Zone:** Critical hold – Strong demand area! Expect bounce-back to $127K+.It's essential for BTC to defend this level to maintain bullish momentum
⚠️ DYOR | NFA
This pullback came after a strong rally driven by institutional ETF inflows, dovish Fed signals, and seasonal "Uptober" momentum, but it's now consolidating near key support levels. The market sentiment is mixed: bullish on longer-term fundamentals but cautious short-term due to overbought conditions and profit-taking.

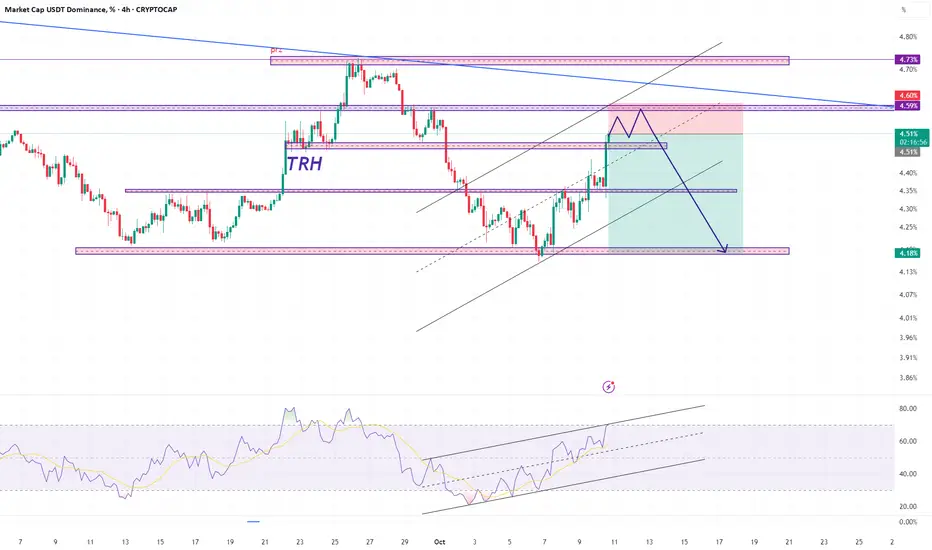
usdt.d 4hHello friends, I am Mehdi.
Given the area, we expect a price correction from this area trh.
Reasons:
We are in the area trh.
There is a possibility of approaching the channel ceiling and then correcting the price.
The resistance at 4.60 is a good place to buy.
I would like to thank you for supporting me by liking and commenting.
And please state your desired currency for analysis.
BTC (SHORT)BINANCE:BTCUSDT
SHORT
Entry 123 900
SL 126 300
T1 117 500
Golden Advices.
********************
* Please calculate your losses before the entry.
* Do not enter any trade you find it not suitable for you.
* No FOMO - No Rush , it is a long journey.

BTC ( Long ) or (Spot)BINANCE:BTCUSDT
LONG & SPOT
Entry 117 800
SL 115 000
T1 131 700
Extra Targets 137 000 & 160 000 are optional
Golden Advices.
********************
* Please calculate your losses before the entry.
* Do not enter any trade you find it not suitable for you.
* No FOMO - No Rush , it is a long journey.

AR (Arweave) - Major Support Zone In PlayAR has seen a sharp pullback over the last few weeks and is now testing a key support level. This zone has previously acted as a strong base, making it a potential area for bullish reversal or bounce.
💡 Trade Idea:
🔹 Entry Zone: $5.20 – $5.40
🔹 Targets (TP):
• First target: $6.10 – $6.60
• Second target: $7.80 – $8.75
🔹 Stop Loss: Just below $5.00
🔍 Watch for bullish confirmation (volume spike, candle reversal) at support before entering. Manage your risk and scale out at key resistance levels.

BITCOIN SIGNAL: NEXT TARGET REVEALED!! (scary) Yello Paradisers! Enjoy the video!
And Paradisers! Keep in mind to trade only with a proper professional trading strategy. Wait for confirmations. Play with tactics. This is the only way you can be long-term profitable.
Remember, don’t trade without confirmations. Wait for them before creating a trade. Be disciplined, patient, and emotionally controlled. Only trade the highest probability setups with the greatest risk to reward ratio. This will ensure that you become a long-term profitable professional trader.
Don't be a gambler. Don't try to get rich quick. Make sure that your trading is professionally based on proper strategies and trade tactics.

Bitcoin - KEY support is at 118kBitcoin - KEY support is at 118k
taht's a POC of a range + vwap from siwng low
that level should work as powerful support or trend woudl reverse
i`ll take LONG in a case of local CONFIRMATION

$DOT WEEKLY CHART UPDATE #DOT is showing a strong long-term CRYPTOCAP:DOT WEEKLY CHART UPDATE
CRYPTOCAP:DOT is showing a strong long-term accumulation pattern around the $3-4 zone. This level has acted as a solid historical support since 2022. If it holds, we could see a major reversal ahead with potential upside targets around $10–$20 by 2026.
The structure looks bullish, and early accumulation here could pay off big in the next cycle. 🚀

Following PIVX, we take the X's on the HOOKAs I have already written, you should not try to jump on the departed train on pivx, which I recommended for purchase for more than a month, it is better to consider the options where the X's are just being prepared. First of all, they include CHESS HOOK BMT MITO VIC.
Consider the position of the HOOK. After listing on binance, the token left several strong technical signals for a retest up to 0-50-75, which is highly likely to lead to a major growth wave. The growth momentum last week was only the first investment in the upcoming trend. An uptrend line has been formed and there is a high probability of an attempt to consolidate above it before the end of this month. The quarter opened in a mixed zone, an opening above 0.09 gives a signal for growth up to 0.15, however, an opening below 0.1 is likely to give pullbacks in the event of a sharp increase. The main long-term support for the current issue is the 0.0750-850 range, from which there was a rebound after a long-term rebidding. A hike below this range is likely only with an additional significant drawdown of ETH. The most likely target is an attempt to close the current monthly candle above 0.21-21 in order to continue the trend in the new month. With negative overall market dynamics, there is a possibility of a pullback from 0.21-25. In this case, in the new month, we can expect a new attempt to return to the trend line from 0.110-125, which will provide an additional opportunity for scalping.

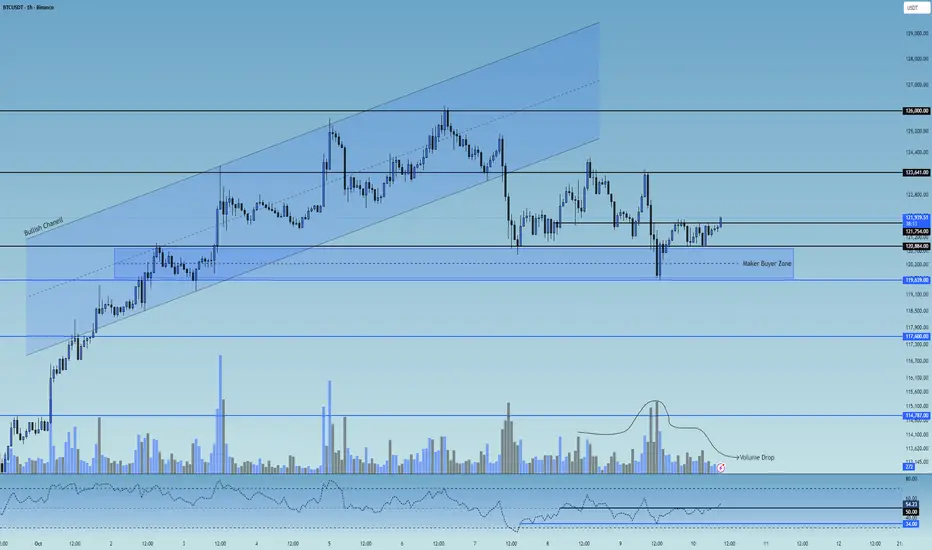
BTC 1H Analysis - Key Triggers Ahead | Day 53☃️ Welcome to the cryptos winter , I hope you’ve started your day well.
❤️ I sincerely apologize to everyone in the channel — I’ve been down with a cold for several days. Now, let’s dive into the 1-hour Bitcoin analysis.
⏰ We’re analyzing BTC on the 1-Hour timeframe .
👀 In the 1-hour timeframe, after a strong bullish rally, Bitcoin broke below its ascending channel and moved toward the $121,000 support zone. From there, increased buying volume pushed the price upward, but it got rejected from the $123,600 resistance** and pulled back, creating a long trigger at that zone.
As it moved toward lower support levels, it formed a micro buyer zone between $119,640 and $120,884, where each time price enters this zone, Bitcoin experiences noticeable buying pressure.
🧮 Looking at the RSI oscillator, after ranging below the 50 level, it’s now trying to break above it. The 50 level has become a **strong static resistance, while there’s swing support near 34.
If the RSI breaks out of these marked zones, it could trigger stronger volatility and expand both **short and long trading opportunities.
🕯 The size and volume of recent candles on the 1-hour chart show range-bound movement, weak momentum, and market indecision, forming a **multi-timeframe trading range** where the top and bottom boundaries act as trigger zones.
The **micro buyer zone is where buyers aggressively defend price through market orders, preventing further downside — a reversal candle forming inside this zone is a strong example of that.
▶️ **Today’s economic news related to U.S. monetary policy can impact the market significantly. Since Bitcoin is currently in a small trading range, upcoming volatility spikes from the news could provide short-term setups.
↗️ Risky Long Scenario:
Look for a breakout above the marked $121,754 zone, accompanied by an engulfing candle, **indecision signal, SMA-7 confirmation, and increasing volume in the direction of the breakout — especially if the news comes out risk-on (positive for markets).
📉 Very Risky Short Scenario:
If price breaks below the micro buyer zone and loses the swing RSI support near 33, Bitcoin could enter a deeper correction.
However, note that a drop in Bitcoin’s price often increases its attractiveness compared to other assets, so avoid rushing into shorts.
❤️ Disclaimer : This analysis is purely based on my personal opinion and I only trade if the stated triggers are activated .
$DOGE \ $BTC CRYPTOCAP:DOGE ➚ CRYPTOCAP:BTC
Dogecoin is moving towards the upper band of the bullish falling wedge formation it has been trading within for some time, and if a breakout occurs, it will create the potential for a significant run against BTC.
Expectations are high, but approval is at a breaking point!
