BTCUSD 1W chart review• Currently BTC is at ~ USD 123,000 (+1.97%).
• Strong support visible in the area of 113 400 USD and USD 106,800.
• The next resistance is USD 124,500, and the next important is USD 133,500.
2. Trend:
• You can see the growing trend line (orange), which supports increases.
• The weekly candle is green and quite strong - suggests that the demand persists.
3. Medium walking (SMA / EMA):
• SMA 50/200 shows the Golden Cross (EMA CROSS 50/200), which is a long -term bull signal.
• SMA (red) is below the price → pro-rectification signal.
4. RSI (Relative Strength Index):
• Currently approx. 60 → Neutral-BYCZECZE territory.
• Not bought yet (> 70), so there is space for further increases.
5. MacD / Histogram:
• The histogram begins to grow green - growth moment is growing.
• This confirms that the buyers are taking over the initiative.
⸻
📈 Scenarios:
1. Bull (greater likelihood at the moment)
• If BTC pierces and stays above USD 124,500, the goal may be USD 133,500.
• Breaking over 133K opens the road even to around 140k.
2. Bear
• If the price does not pierce 124.5k and reject the resistance, it may drop to $ 113,400.
• Punction below this zone will give a signal of declines up to USD 106,800.
BTC

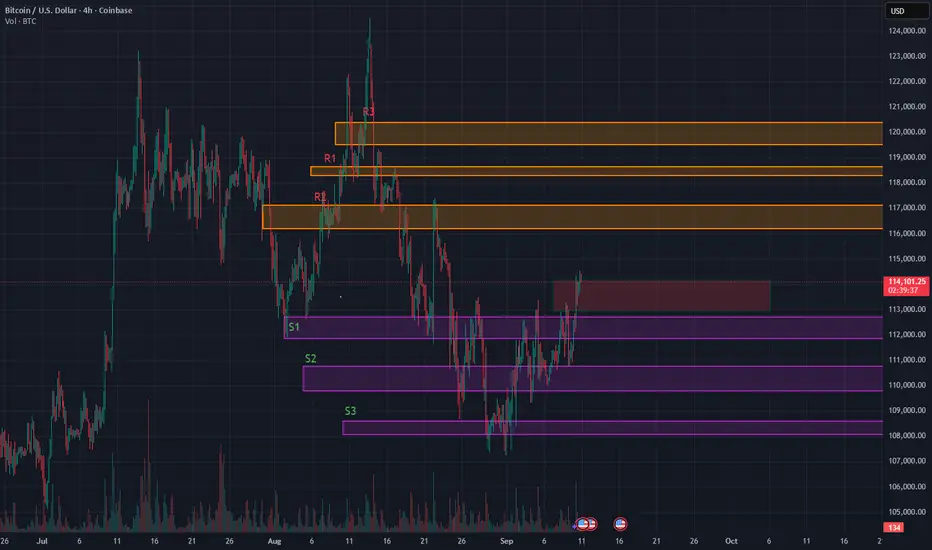
Range-Bound Rocket: BTC’s Coiled Spring Between S1 and R3-ATHRange Bound Rocket: BTC Loaded and Coiled for $120k Retest
Description:
BTC is now trading around $114,260, still inside the range I’ve flagged earlier. We reloaded at our previously posted support zones between $110k and $111k. That gives us a strong base.
I’m watching for acceptance above the $113k to $114k red box, which overlaps with the neckline of a potential reverse Head & Shoulders on the 4‑hour chart. It hasn’t triggered yet but we are in validation mode. (expecting a retest to 113k and then a break up) If we get a breakout with volume expansion and wide‑bodied candles, I’ll treat that as a valid activation. Target remains $119k and above.
This table shows how likely BTC is to stay above certain price levels over the next two weeks based on current volatility. These are not predictions, they represent statistically expected ranges based on price behavior.
2WK/Probability, Price Level, Meaning
90%, ~$96,700 BTC is very likely to stay above this level
75%, ~$103,200 BTC has a strong chance of staying above here
50%, ~$111,000 This is the midpoint, BTC has equal chance of being above or below
25%, ~$119,400 BTC has a one in four chance of closing higher than this
10%, ~$127,400 Only a small percentage of outcomes put BTC above this level
Key takeaways:
BTC is currently trading around $114,260, sitting just above our red resistance zone at $113,000 to $114,000.
Our first upside target, $118,000, lines up with the top 25 to 30 percent range of expected outcomes. This is reachable if the broader market stays supportive.
$120,000 sits closer to the top 20 percent threshold. BTC would need strong momentum and favorable macro data to push there in the next two weeks.
Downside probabilities
While the structure looks bullish, we should still consider these potential retracement levels:
Around 46 percent chance BTC dips below $110,000
Approximately 43 percent chance it drops under $109,000
Roughly 30 percent chance BTC trades below $105,000
These downside paths are consistent with our S2 and S3 support zones, which were successfully defended during the last major pullback.
What I'm doing and suggest :
Breakout confirmation:
I’m looking to add above $113k to $114k only if volume expands and candles show conviction, meaning minimal wicks and strong closes. Weak volume or upper wicks mean the breakout could fail. Main stop is back inside the range. Scalpers can use a tighter invalidation below $112.2k.
Reload zone:
A move into $110k to $109k is a statistically common retest. I’ll look for buyer defense and fading downside pressure to reload.
Volatility risk:
I'm already positioned long from our previously posted support zones around $110k to $111k, so I’m not actively adding or hedging right now. Into CPI and the Fed, I’m staying hands-off unless we get a clear breakout or strong market signal.
For those not in position:
Avoid chasing breakouts before the event
Look for confirmation or reaction post-data
If we get a volatility spike, retests of $110k to $109k are still statistically common and may offer a better entry
The goal is to avoid being overexposed heading into binary catalysts. I’m holding my current spot exposure and letting the trade breathe.
If no breakout forms:
I expect BTC to remain in a range between $111k and $118k. Support zones from prior posts maintained a bullish bias. If BTC consolidates below $114k but keeps forming higher lows, I’ll consider that ongoing accumulation.
Catalysts to monitor:
Nasdaq or NQ breakdown
• Tech strength: Nvidia up ~30% YTD on strong Blackwell Ultra demand, ADI and MX showing strength despite macro headwinds.
Jobless claims rising again
• U.S. jobless claims are rising to 237K, signaling labor market cooling. Continuing claims are easing but job additions in August were weak at just 22K. Recent wide downward revisions (~911K fewer jobs year-to-date) reinforce rate‑cut bets.
Geopolitical risk
• Geopolitical tensions remain tail‑risks.
Fed rate tone and CPI reaction
• Fed tone and CPI outputs are increasingly important as data is tilting soft and markets are pricing in easier policy.
• The USD’s trajectory matters. Further weakness helps BTC and tech space gain more cushion.
Tech remains a key driver. AI and semis continue to lead Nasdaq strength, and BTC still tracks equity moves closely. A soft dollar also reduces market drag and supports upside potential.
BITCOIN SIGNAL: LEVERAGE DRIVEN PUMP! (where it ends??!)Yello Paradisers! Enjoy the video!
And Paradisers! Keep in mind to trade only with a proper professional trading strategy. Wait for confirmations. Play with tactics. This is the only way you can be long-term profitable.
Remember, don’t trade without confirmations. Wait for them before creating a trade. Be disciplined, patient, and emotionally controlled. Only trade the highest probability setups with the greatest risk to reward ratio. This will ensure that you become a long-term profitable professional trader.
Don't be a gambler. Don't try to get rich quick. Make sure that your trading is professionally based on proper strategies and trade tactics.

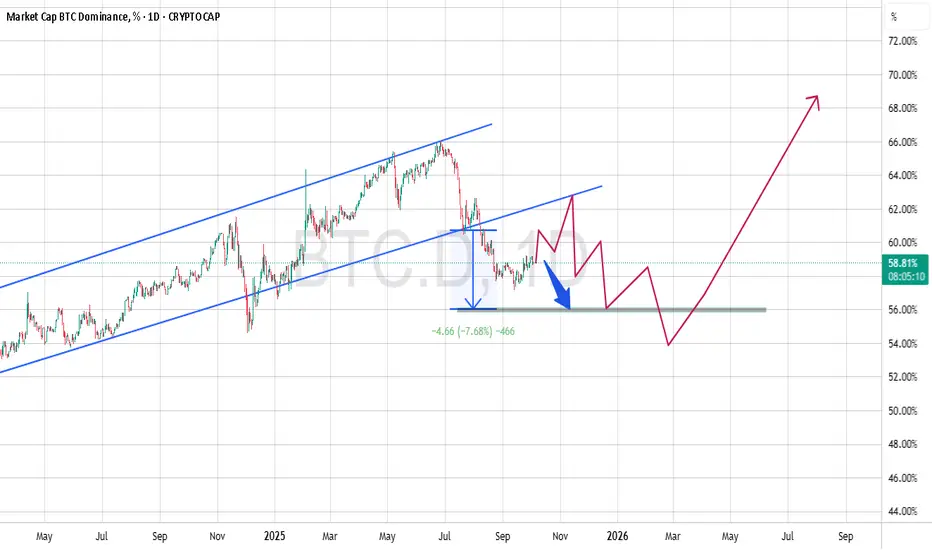
BTC Dominance: Short-Term Dip or Long-Term Rally?📊 Bitcoin dominance has been cruising in an uptrend channel for a while, but it recently broke below the channel's floor, dropping to around 58%. Right now, it’s bouncing around in a key zone between the 60% resistance and 56% support.
What’s Coming Next?
🔴 Short-Term Bearish Scenario: If dominance can’t hold above 60%, we might see it slide back to the critical 56% support. This could give altcoins some breathing room and maybe even spark a decent rally. Perfect opportunity for those eyeing altcoin trades!
🟢 Long-Term Bullish Scenario: If dominance builds a solid base at 56% and starts climbing again, it could aim for 64% and even push toward 68–70%. If this plays out, Bitcoin’s gonna take charge of the market again, and altcoins might feel the heat.
The Bottom Line:
Short-Term: A drop to 56% could mean altcoins steal the show. Keep an eye on this level!
Long-Term: If Bitcoin flexes its muscles and dominance climbs to 68–70%, it’s probably time to lean heavier into BTC in your portfolio.
✍️ This analysis can be a solid guide for balancing your portfolio between Bitcoin and altcoins. Watch those 56% and 60% levels closely to make smart moves!
BTC (LONG)BINANCE:BTCUSDT
Entry range (111600- 113000)
SL 109977
T1 124 900
T2 131 600
Extra Target is optional 139000
_______________________________________________________
Golden Advices.
********************
* collect the coin slowly in the entry range.
* Please calculate your losses before the entry.
* Do not enter any trade you find it not suitable for you.
* No FOMO - No Rush , it is a long journey.

btc local topBitcoin top not is in.
New peaks are inevitable.
It is clear that a local top has not been seen without touching the upper band of the logarithmic cycle on a cycle basis.
nfa.

Ethereum Beautiful RetestQuick Update :
- Remember what i always insist on :
" Resistances often tend to become supports, and supports often turn into resistances "
- You don’t need ten indicators to find the way, keep your chart simple. Indicators are just supplements, helping confirm when you already have a good chance of being right.
- The target for ETH remains unchanged, it could reach around 15,000 or even higher accordling to Fibonnacci.
Be Ready for Uptober
Happy Tr4Ding !

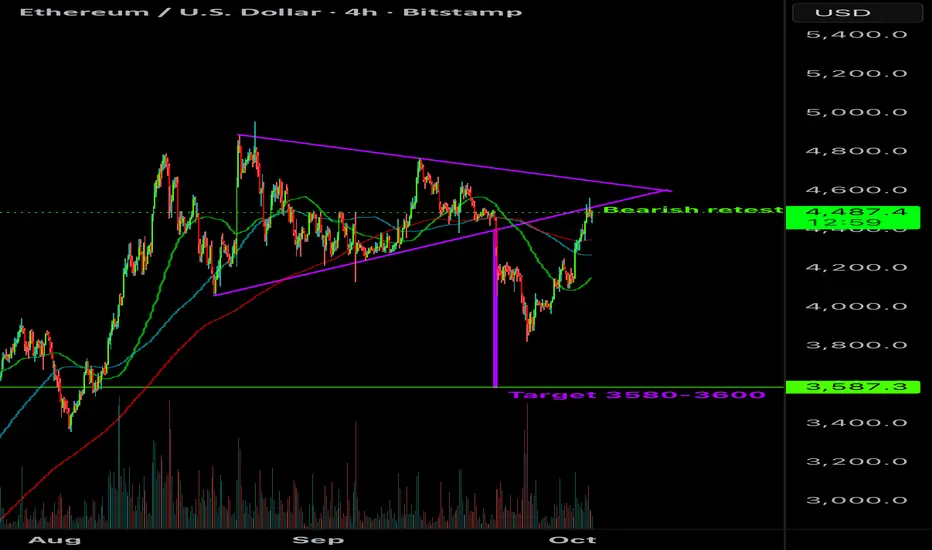
ETH/USDT – Bear Market Rally Into Q4Ethereum has staged a bear market rally as we move into the beginning of the last quarter of the year. After finding strong support around $3,826–$3,866, price recovered sharply and is now consolidating near the $4,480–$4,500 resistance zone.
• Resistance Zone (Supply): $4,487 – $4,561
• Support Zone (Demand): $3,826 – $3,866
• Current Price: $4,479
The structure shows that sellers are likely to step back in at this level, suggesting another weekend of selling pressure. If ETH fails to break and hold above the $4,560 level, downside momentum could retest the $3,800 area.
📉 Bearish Case: Rejection from resistance → continuation lower toward $3,826–$3,866.
📈 Bullish Case: Break and daily close above $4,561 → opens room for $4,700+ continuation.

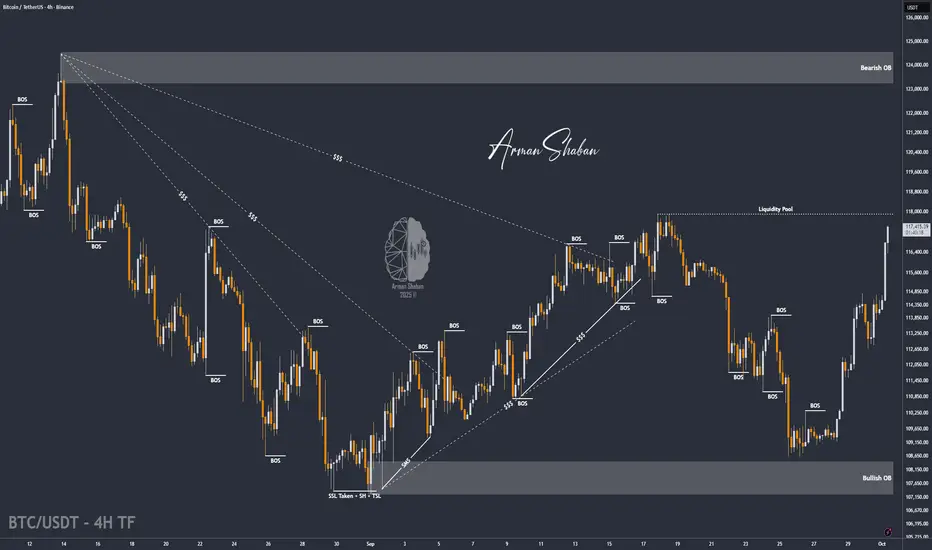
BTC/USDT | BTC Rally +7% Gains – Bulls Still in Control (READ)By analyzing the Bitcoin chart on the 4-hour timeframe, we can see that the price continued its rally as expected, hitting the $115K target and now reaching up to $117,200, just one step away from the next target at $118K. So far, this analysis has delivered more than 7% gains. I hope you made the most out of it!
Please support me with your likes and comments to motivate me to share more analysis with you and share your opinion about the possible trend of this chart with me !
Best Regards , Arman Shaban
ETH Bearish Retest?Could be looking at a bearish retest of the symmetrical triangle breakdown.
Target remains around $3600. Bearish divergences also confirming potential here.
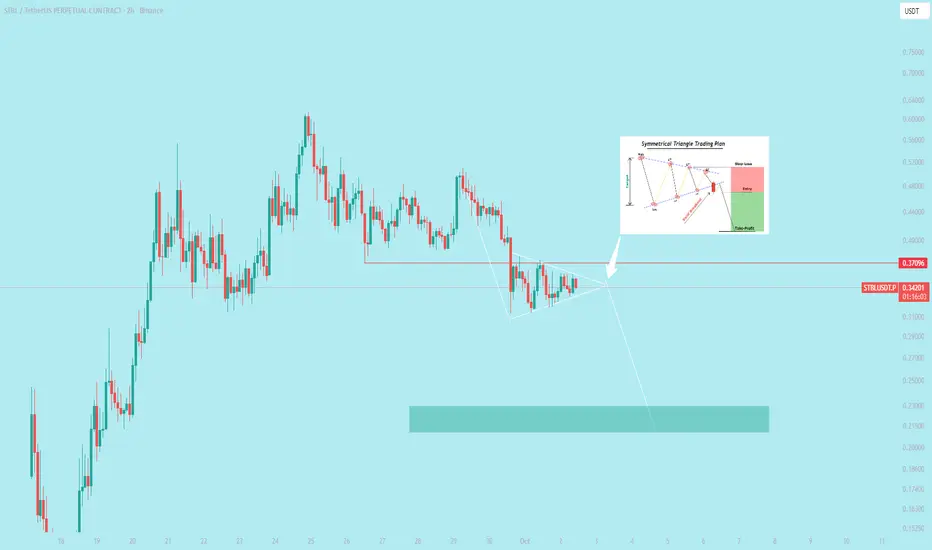
$STBL looks weak 🥴 *A bearish symmetrical triangle is a technical analysis chart pattern that signals a period of consolidation in a downward trend, followed by a continuation of the downtrend. It indicates that after a price decline, sellers and buyers reach a temporary equilibrium before sellers regain control and drive the price lower.*
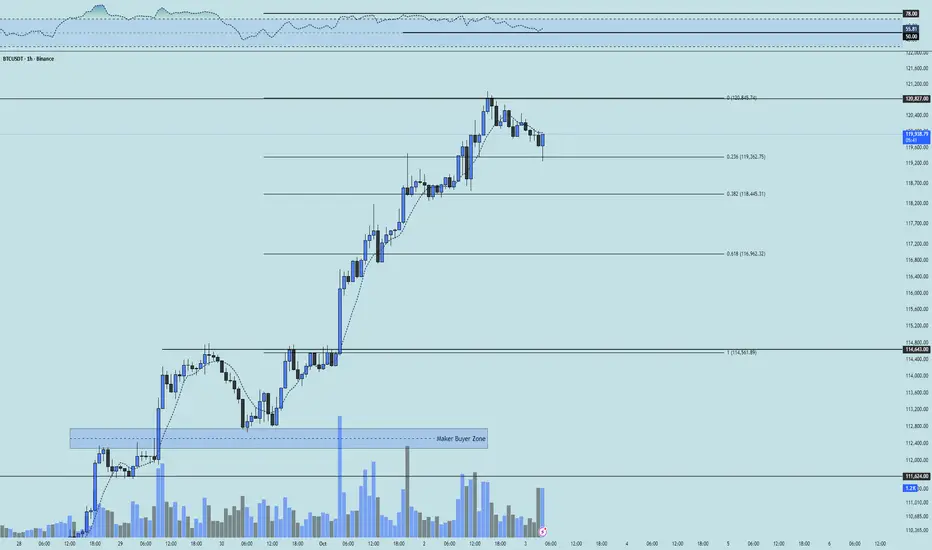
BTC 1H Analysis - Key Triggers Ahead | Day 51☃️ Welcome to the cryptos winter , I hope you’ve started your day well.
⏰ We’re analyzing BTC on the 1-Hour timeframe .
👀 On the 1-hour timeframe for Bitcoin, we can see that after this recent bullish leg, price has now reached its resistance at $120,827. If this resistance breaks — a zone packed with short orders — Bitcoin could start an extremely sharp and powerful upward leg, essentially triggering a short squeeze. At the moment, Bitcoin is entering a corrective phase; with the start of this correction, price could head down toward its Fibonacci retracement supports, bounce from one of those levels, and then form a new trading structure.
🧮 Looking at the RSI oscillator, price has been ranging around the 70 zone and briefly entered overbuy. It is now moving toward the 50 area, its oscillation mean. A break below 50 could deepen the correction, but if support holds, RSI could again head toward the resistance zone near 70 and re-test the overbought boundary.
🎮 The Fibonacci retracement drawn from the breakout at $114,562 to $120,827 highlights several strong support areas. The most important zones for Bitcoin are the 0.236 and 0.382 retracement levels. Support here, followed by a fresh structure, could set up strong trading opportunities.
🕯 The size and volume of buy candles have been exceptionally strong and increasing — something rarely seen in Bitcoin with such a one-sided move to the upside. Now, during this corrective phase, even as selling pressure appears, roughly 70% of that sell volume is being absorbed by buyers. What we must watch closely is how buyers decide to allocate capital from here. If the key Fibonacci levels are lost, we respect the market’s decision and only then consider new trades.
🧠 For a Bitcoin position If you don’t have an open position, I recommend waiting for a new structure to form at critical Fibonacci levels, and only enter after a breakout of that structure.
If you already hold a position, consider partial profit-taking, since USDT dominance has also reached an important support zone.
❤️ Disclaimer : This analysis is purely based on my personal opinion and I only trade if the stated triggers are activated .
BTCUSD H4 | Bullish Momentum Likely to ContinueBitcoin (BTC/USD) is falling towards the buy entry at 117,764.14, which is a pullback support that aligns with the 23.6% Fibonacci retracement and could bounce from this level to the upside.
Stop loss is at 114,705.13, which is a pullback support that lines up with he 50% Fibonacci retracement.
Take profit is at 124,031.38, which acts as a swing high resistance.
High Risk Investment Warning
Trading Forex/CFDs on margin carries a high level of risk and may not be suitable for all investors. Leverage can work against you.
Stratos Markets Limited (tradu.com ):
CFDs are complex instruments and come with a high risk of losing money rapidly due to leverage. 65% of retail investor accounts lose money when trading CFDs with this provider. You should consider whether you understand how CFDs work and whether you can afford to take the high risk of losing your money.
Stratos Europe Ltd (tradu.com ):
CFDs are complex instruments and come with a high risk of losing money rapidly due to leverage. 66% of retail investor accounts lose money when trading CFDs with this provider. You should consider whether you understand how CFDs work and whether you can afford to take the high risk of losing your money.
Stratos Global LLC (tradu.com ):
Losses can exceed deposits.
Please be advised that the information presented on TradingView is provided to Tradu (‘Company’, ‘we’) by a third-party provider (‘TFA Global Pte Ltd’). Please be reminded that you are solely responsible for the trading decisions on your account. There is a very high degree of risk involved in trading. Any information and/or content is intended entirely for research, educational and informational purposes only and does not constitute investment or consultation advice or investment strategy. The information is not tailored to the investment needs of any specific person and therefore does not involve a consideration of any of the investment objectives, financial situation or needs of any viewer that may receive it. Kindly also note that past performance is not a reliable indicator of future results. Actual results may differ materially from those anticipated in forward-looking or past performance statements. We assume no liability as to the accuracy or completeness of any of the information and/or content provided herein and the Company cannot be held responsible for any omission, mistake nor for any loss or damage including without limitation to any loss of profit which may arise from reliance on any information supplied by TFA Global Pte Ltd.
The speaker(s) is neither an employee, agent nor representative of Tradu and is therefore acting independently. The opinions given are their own, constitute general market commentary, and do not constitute the opinion or advice of Tradu or any form of personal or investment advice. Tradu neither endorses nor guarantees offerings of third-party speakers, nor is Tradu responsible for the content, veracity or opinions of third-party speakers, presenters or participants.

AKE ON WAY TO THE TARGET $0,005 AND THE NEW ATH - UP: 03-10-2025✅ AKEDO has confirmed above the low time frame zone around 0.00160, showing strong support holding.
📈 This setup increases the probability of a breakout move:
First target zone: 0.00326 (yellow line)
Main target: 0.00500 USDT
As long as the coin remains above the confirmation zone, momentum is bullish and the breakout can happen at any time.
⚡ Outlook: Structure is aligned for continuation toward the higher targets, with strong upside potential if volume follows.

BTC - Weekly Breakout!📈 BTC has already broken out of its correction phase and is holding strong above $118k.
As long as $118k holds, the next targets sit between $126k–$140k.
Only a drop below $114k would delay the bullish outlook.
Trend remains strongly bullish after the breakout.
⚠️ Disclaimer: Not financial advice. Manage risk properly.
All Strategies Are Good; If Managed Properly!
~Richard Nasr.

Next Volatility Period: Around October 14th
Hello, traders!
Follow us to get the latest information quickly.
Have a great day!
-------------------------------------
(BTCUSDT 1D Chart)
This volatility period is expected to last until October 4th.
Accordingly, the key question is whether it can find support near 119,177.56 and rise.
If not, and the price declines, support near 115,854.56 will be crucial.
If it finds support near 119,177.56 and rises, it is expected to challenge the Fibonacci ratio of 2.618 (133,889.92).
The key areas for maintaining an uptrend are:
- Short-term: 115,854.56-119,177.56,
- Medium-term: 104,463.99-108,353.0,
- Long-term: 87,814.27-93,570.28.
-
Thank you for reading.
We wish you successful trading.
--------------------------------------------------
- Here's an explanation of the big picture.
(3-year bull market, 1-year bear market pattern)
I'll explain more in detail when the bear market begins.
------------------------------------------------------

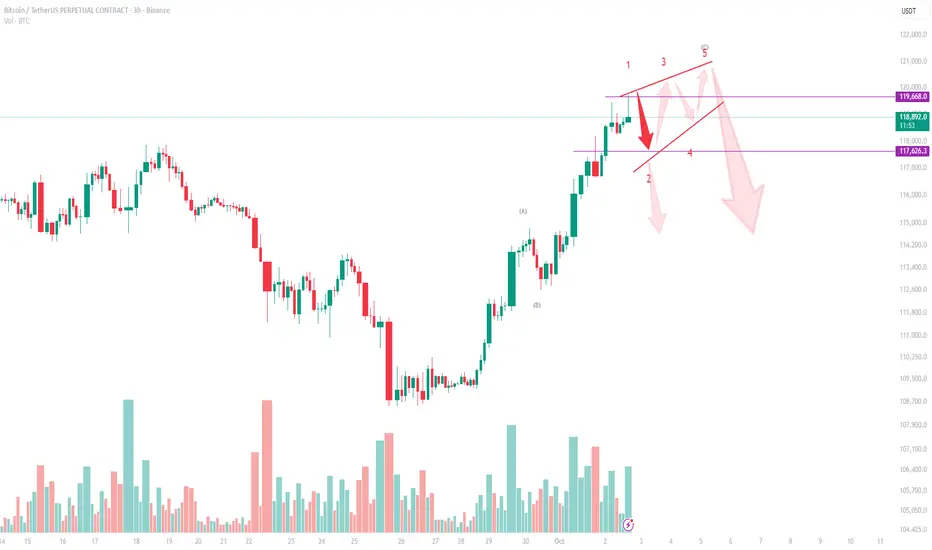
Bitcoin (BTC/USDT) Technical Analysis – 3H ChartWave Structure Outlook
Bitcoin is currently trading near $119,300, where the wave structure suggests a possible Ending Diagonal formation. This leaves us with two bearish scenarios to monitor:
Scenario 1 – Immediate Downside After 1–5 Completion
The 1–5 wave sequence may already be completed.
If so, the market could trigger an immediate downside move, breaking wedge support.
First critical level is $117,600. A clean break below this level would confirm the start of a deeper correction, opening the way toward $115,000 – $113,000.
Scenario 2 – Choppy Ending Diagonal (Light Red Arrows)
Alternatively, BTC may still extend within an Ending Diagonal.
This would mean choppy, back-and-forth price action (small up-and-down moves) before the final breakdown.
In this case, price may retest the $119,800 – $120,000 zone, but the structure remains corrective, and the eventual expectation is still bearish reversal.
Key Levels to Watch
Resistance: $119,800 – $120,000 (upper wedge boundary)
Support: $117,600 (first breakdown level)
Bearish Targets: $115,000 → $113,000
Conclusion
BTC is losing momentum at the end of a 5-wave structure. Whether the market follows Scenario 1 (immediate breakdown) or Scenario 2 (choppy diagonal ending before reversal), the overall outlook is bearish in the short term.
BTCUSD NEXT POSSIBLE MOVE BTC is currently holding strong above key support zones, showing bullish momentum building up. If the market continues to respect this structure, a possible upward move can be expected. A breakout above the resistance could trigger fresh buying pressure, opening the way for higher levels. Overall, price action is suggesting that buyers are still in control, and any sustained strength could lead BTC toward new highs in the coming sessions.

Bitcoin Faces $120K Resistance – Bull Trap or Breakout?Bitcoin ( BINANCE:BTCUSDT ) continued its uptrend of the last 2-3 days as I expected in my previous idea . Today, the announcement of the ADP Non-Farm Employment Change index worked like a catalyst for Bitcoin .
Bitcoin is currently surrounded by Resistance zones and a Potential Reversal Zone (PRZ) , and is near the important price of $118,400(Volumetric importance) and the $120,000(Round Number) .
From the perspective of Elliott Wave theory , it seems that Bitcoin could be in corrective waves and that the increase of the last few days could only serve as a Bull Trap .
I expect Bitcoin to decline at least to the Support lines .
Cumulative Long Liquidation Leverage: $113,590-$111,900
Cumulative Long Liquidation Leverage: $115,823-$115,087
Cumulative Short Liquidation Leverage: $120,000-$118,000
Note: If Bitcoin falls below the Support zone($114,820-$113,180), we should expect further declines.
CME Gap: $111,355-$109,915
Stop Loss(SL): $120,103
Please respect each other's ideas and express them politely if you agree or disagree.
Bitcoin Analysis (BTCUSDT), 1-hour time frame.
Be sure to follow the updated ideas.
Do not forget to put a Stop loss for your positions (For every position you want to open).
Please follow your strategy and updates; this is just my Idea, and I will gladly see your ideas in this post.
Please do not forget the ✅' like '✅ button 🙏😊 & Share it with your friends; thanks, and Trade safe.

BITCOIN Are we going to see 'UPTOBER' this time??Bitcoin (BTCUSD) has historically seen incredible rallies during the month of October and even more so those Octobers of the last years of Bull Cycles, like the one we are at now. Those rally phases have been very accurately called 'Uptober' rallies.
More specifically, the last three such Octobers (2021, 2017 and 2013) have been massively bullish, all starting after September corrections (Channel Down patterns). In 2013, October reached the 2.382 Fibonacci extension from September's correction, in 2017 and 2021 it reached the 1.786 Fibonacci ext.
As a result, if 'Uptober' is repeated again, this historic price actions gives us an optimistic Target at $132k (Fib 2.382) and a less optimistic one at $125.5k (Fib 1.786).
Do you think we will get such Uptober one more time? Feel free to let us know in the comments section below!
-------------------------------------------------------------------------------
** Please LIKE 👍, FOLLOW ✅, SHARE 🙌 and COMMENT ✍ if you enjoy this idea! Also share your ideas and charts in the comments section below! This is best way to keep it relevant, support us, keep the content here free and allow the idea to reach as many people as possible. **
-------------------------------------------------------------------------------
💸💸💸💸💸💸
👇 👇 👇 👇 👇 👇

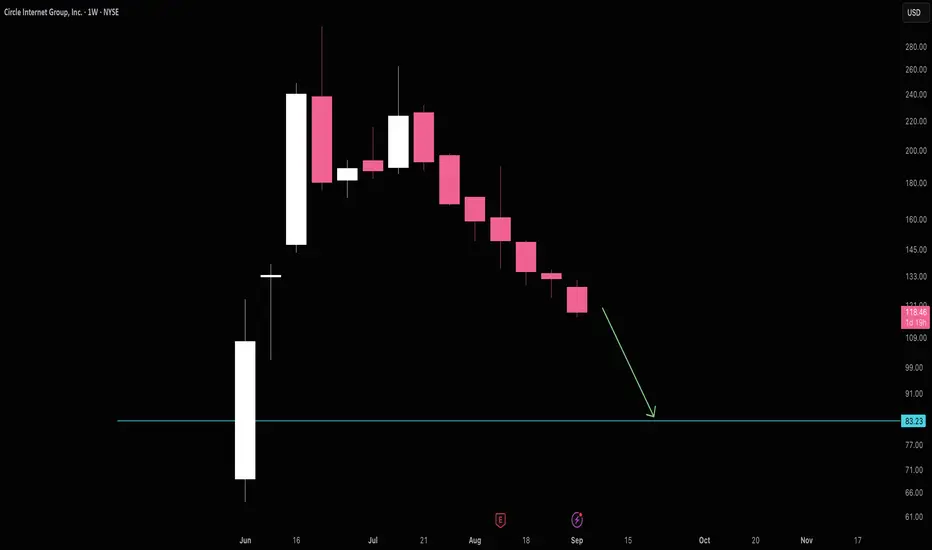
Circle appears to be heading to $83Circle seems to be in a steady decline towards $83. It's hard to say if it will hold there and find true support, but it's a good place to close shorts.
Good luck!
usdt.dHello, I am Mehdi.
According to the previous analysis, the market has continued to the range we are waiting for. In this area, we should wait for the formation of a pattern to continue the path.
Therefore, it is recommended to keep an eye on the market with a 70% profit margin.

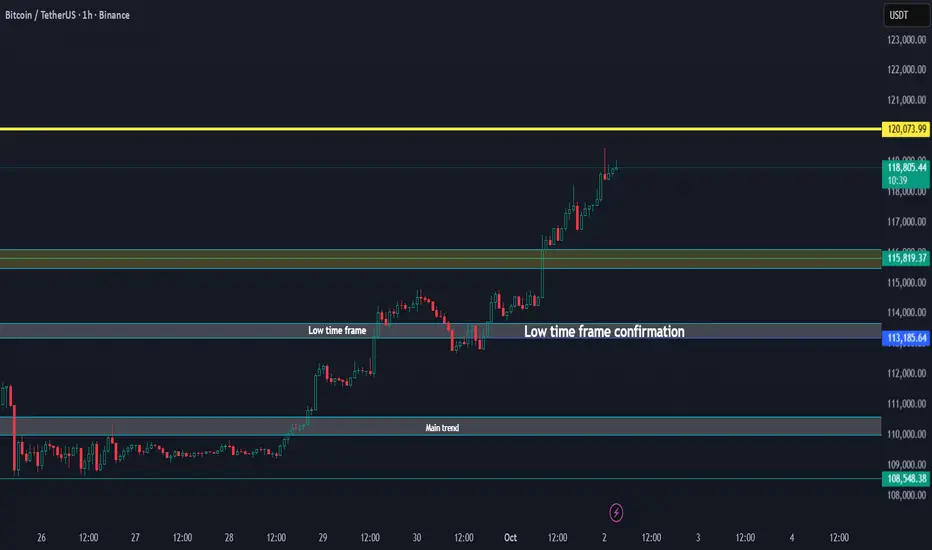
BTC Above All Key Levels, Trend Points Higher Update 02-10-2025🚀 Bitcoin / USDT Update
Bitcoin has broken above all key levels, showing strong momentum.
Main trend has been secured.
Low time frame is confirmed and holding.
Price is currently pushing into new zones with upside pressure.
If this strength continues, BTC could extend toward the 120K region, and a new trend could unlock further upside potential beyond that.
✅ As long as Bitcoin stays above the confirmation zone (~113K support), momentum remains bullish.