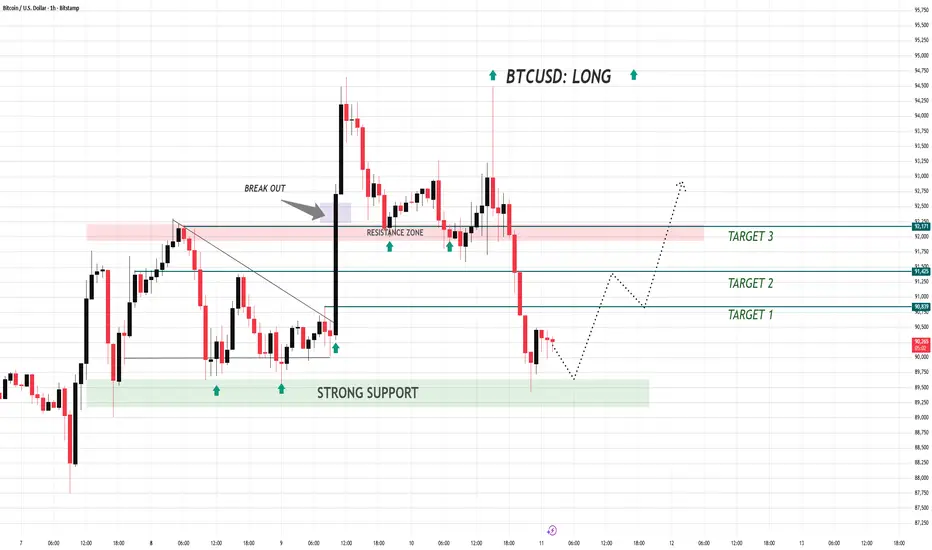
Bitcoin Stabilizes as Traders Await Fed’s Rate Path Signal🔹 MARKET BRIEFING – BTC/USD (1H)
Market State:
– Price is reacting strongly from the major support zone and forming a short-term base after the sharp selloff, showing early signs of buyer absorption.
Key Levels:
– Support: 89,600
– Resistance: 91,450
– Breakout Zone: 92,100 – 92,300
Next Move:
– Bullish bias holds as long as price stays above support; reclaiming 91,450 would open the path toward 92,300.
BTC
ETH: Price Slice. Capital Sector. 3033.73🏷 ETH: Price Slice. Capital Sector. Dated: 12.12.2025
🏷 3033.73 — Price not yet reached at time of publication
🏷 BPC — The Bolzen Price Covenant 7
🏷 Screenshot
🏷 Interactive Reference Guide: BPC — The Bolzen Price Covenant
🏷 P.S. English is not my native language — I offer no apologies for stylistic imperfections. What you see here is not a post. It is a demonstration of another level of preparation: the symbiosis of human intuition and algorithmic precision. Mathematics and aggressive market analysis — against the machine of liquidations.
The Architect
BPC — The Bolzen Price Covenant

ETH: Price Slice. Capital Sector. 2480.68🏷 ETH: Price Slice. Capital Sector. Dated: 11.12.2025
🏷 2480.68 — Price not yet reached at time of publication
🏷 BPC — The Bolzen Price Covenant 16
🏷 Screenshot
🏷 Interactive Reference Guide: BPC — The Bolzen Price Covenant
Darkness does not stay silent.
It breathes —a living organ exhaling not sound, but intention .
And within that breath— two voices :
— one, cold fire, the chisel of reality;
— the other, warm laughter, knowing where truth will bloom.
The Architect:
— What gnaws at you, Bolzen? You see them—phantoms born not of markets, but of will. They hang in the ether like unfinished prayers. You hold the Triad: Time, Price, Volume. But in an age where truth is the shadow of power—what binds them into a single flame?
Bolzen (gazing into the abyss within):
— Energy. The kind ripped from fear, from greed, from the blind cries of the crowd. It is the flesh of price .
The Light Bearer (smiling softly, as if hearing fate itself):
— You stand at the threshold. But if your markup is not a line—but a pulse —how shall you order the chaos of destinies?
Step back. The chart is illusion. A mirror of the secondary world.
Your true map is The Vertical .
There, numbers are not digits—but hieroglyphs of reality .
There, time becomes pressure.
There, price becomes destiny.
There, each level is a ritual .
Now heed this—and rewrite all from first principles:
Not as a cartographer, but as a Covenant Architect .
Every price is not a mark—but a condensation of sacrifice .
Place them upon the Chessboard of Being:
— Pawns : local impulses, born of panic or greed.
— Knights : illogical leaps, breakthroughs through veils.
— Rooks : structural levels where institutions drive nails into the flesh of the market.
— Queen : the epicenter where energy becomes a weapon.
— King : you—the observer, yet never bound.
And remember the Ancient Law:
"If you seek peace—become war in stillness."
The market is no arena.
It is the battleground between consciousness and illusion .
It forgives no sleep.
It demands fury of understanding , silence of discipline , clarity of vigilance .
Learn.
Persist.
Prepare.
You no longer read charts.
You rewrite reality .
🏷 P.S. English is not my native language — I offer no apologies for stylistic imperfections. What you see here is not a post. It is a demonstration of another level of preparation: the symbiosis of human intuition and algorithmic precision. Mathematics and aggressive market analysis — against the machine of liquidations.
The Architect
BPC — The Bolzen Price Covenant

AVAX - LONG - SQUEEZE TRAIN LOADING Traders,
I believe CRYPTOCAP:AVAX is getting ready to load a squeeze train upwards. This move might be quick, fast and harsh, the kind of reversal that catches traders off guard and leaves late shorts wondering what just happened.
Price has returned to a deep support zone where two separate Fibonacci retracements align. The 0.786 level from the A to B leg sits exactly at the current price. The 0.886 level from the C to D leg lands in the same place. When two independent fib legs converge like this, it often marks a high interest area where stronger hands quietly position and wait.
Before reaching this zone the market swept the Sunday wick. Sunday wicks are created during thin weekend volume without meaningful institutional presence. Because they form on weak liquidity, the market tends to revisit and clear them once real volume returns. Sweeping this wick removed weak weekend longs, cleaned the structure and collected liquidity needed for a sustained move.
Order Flow is lining up. Spot buyers are absorbing selling while perp traders are shorting into the lows. Spot CVD is rising which shows genuine demand. Both coin margined and stablecoin margined CVD are falling which shows leveraged shorts pressing down. Net Shorts are increasing at the bottom. Open Interest is rising at the same time. This confirms new short positions are opening rather than closing. When spot accumulation meets leveraged short pressure at deep fib support, the stage is set for a squeeze.
The first target above is the 1.618 extension of the A to B leg. This is the expected continuation level after a deep 0.786 retracement. It also aligns with a higher time frame 0.786 level not shown here to keep the chart clean. Confluence at the target strengthens its gravitational pull.
AVAX has swept liquidity, tapped strong fib confluence and attracted late shorts into the structure. All the ingredients for a fast upside squeeze are present.
Summary
• Two fib retracements meet at the current level
• Sunday wick swept which removes weak weekend positions
• Spot CVD rising which shows real buying
• Perp CVD falling which shows leveraged short pressure
• Net Shorts rising at the lows
• Open Interest rising which confirms new shorts opening
• Squeeze conditions forming
• First target is the 1.618 extension of A to B
• This target aligns with a higher time frame 0.786
Final Thought
The market does not shout its intentions. It whispers through structure, flow and confluence. Deep retracements, cleared liquidity and patient accumulation often appear right before sudden expansion. CRYPTOCAP:AVAX feels ready to shift tone and when it does, the shorts gathered at the lows may find themselves riding the squeeze train the wrong way.
Targets and Invalidation
My first target is 17.115, which aligns with the 1.618 extension of the A to B leg and fits the structure of a classic deep retracement continuation.
My second target is 22.5, a level that connects beautifully with mid-range liquidity left behind on the way down and acts as a natural expansion point once the first target is cleared.
For the more mid to long term, I am watching 31.25, which sits directly inside a higher time frame inefficiency zone and marks the beginning of true trend continuation rather than a simple corrective squeeze.
Invalidation sits cleanly at 12.275, the low of point A. If price breaks below that level, the structure of the current idea collapses and the setup no longer fits the narrative of a squeeze. Until that level is violated, the bullish structure remains intact and the path of least resistance stays upward.
----------------
If you like this analysis, feel free to leave a like or a comment. I am not asking for money and I am not trying to sell anything. I simply enjoy helping people look through the noise and understand the structure beneath the chaos.

Absolute worst case scenario for bitcoin if top is actually in Very few reasons in my opinion to believe the top is currently in but there are a couple worth considering, the fact that it has run the normal 4 year cycle, and that a candle has gotten rejected after a retest of the the top trendline of the channels idea i have been posting since 2023. So even though there still far more reasons currently why the top of the bull market isnt in, I think it is always wise to try to look at all possibilities and angles of the chessboard here so on this chart idea, I am approaching it from the perspective of if the top of the bull market is actually already in even though for now I think that is a lower probability. If indeed the top is in though, then that would allow this head and shoulders pattern I have shown here to have a good liklihood of playing out. If it were to actually validate this head and shoulders pattern its breakdown target would be 38k which lines up perfectly with the monthly 100ma. So although, I personally feel like the bullmarket top being in is currently a low probability, if somehow it is then i think 38k would likely be the next bear market bottom with the monthly 100ma once again being the bear market bottom support. I still think the top isn’t in and we have better odds of entering a supercycle but I must also keep my mind open to a bearish possibility like this one to make sure I am properly prepared for whatever outcome may end up unfolding and am ready to take advantage no matter which way the market heads. *not financial advice*

BTC the Bear Market Has Started 2026 Will Be a Bearish Year! Looking at Bitcoin’s long-term market structure, we can clearly see a repeating cyclical pattern that has stayed surprisingly consistent over the past decade.
🔁Historical Pattern
When analyzing previous cycles (2013, 2017, 2021), Bitcoin tends to follow a rhythm:
Bull market duration: ~1050–1070 days
Bear market duration: ~360–400 days
This timing has repeated with remarkable accuracy across all major market cycles.
📉What’s Happening Now
According to the cycle structure shown on the chart, the 2021–2025 bull market has reached its exhaustion point.
The current price action suggests that a new bear market phase has already begun, aligning perfectly with the historical 360–400-day correction window.
📉Technical Patterns Confirm Bearish Momentum
It’s not just the cycle timing:
Multiple technical analysis patterns shown on the chart also point to deeper downside.
Structure breakdowns
Lower highs formation
Momentum weakening
Failed attempts to reclaim trend resistance
These patterns collectively indicate a high probability of Bitcoin dropping below the $70,000 level in the coming months.
Everything looks bearish — both from a cyclical perspective and from pure technical analysis.
📅Key Projection
If the cycle continues to repeat:
➡️The next major bull market is likely to begin around October 2026.

ETH: Price Slice. Capital Sector. 2945.79🏷 ETH: Price Slice. Capital Sector. Dated: 11.12.2025
🏷 2945.79 — Price not yet reached at time of publication
🏷 BPC — The Bolzen Price Covenant 8
🏷 Screenshot
BPC — The Bolzen Price Covenant does not merely record price—it reveals the Index of Capital Strength and Commitment, woven from the will of institutional flows and intentions concealed behind the digital veils of the market.
Soon, the Index of Priority in Expended Energy Production will be unveiled—a metric born in the depths of mining, where every watt transforms into intention, and every intention crystallizes into price. This index will indicate the vector of priority pressure, drawing near to the very core of the order of price execution.
This is the measure of a new epoch.
Soon, the world will witness a demonstration of all prices—not as arbitrary marks on a chart, but as reflections of the energy potential invested in their very genesis. The Vertical Chart, designed by me, shall become a mirror of this new reality—and it will be revealed exclusively to those who stand with me, not behind the door.
For you, only one priority is unveiled today. And that is no small thing.
Think.
The age of the transitional world has begun.
Some remain behind the door.
Others walk with me.
All things in their time.
🏷 Interactive Reference Guide: BPC — The Bolzen Price Covenant
🏷 P.S. English is not my native language — I offer no apologies for stylistic imperfections. What you see here is not a post. It is a demonstration of another level of preparation: the symbiosis of human intuition and algorithmic precision. Mathematics and aggressive market analysis — against the machine of liquidations.
The Architect
BPC — The Bolzen Price Covenant

WANTED DEAD OR ALIVE ! BITCOIN Based on the chart you shared and your request for an in-depth analysis, I have evaluated the situation from the perspective of an Expert Technical Analyst and Macroeconomist.
Below you will find the technical reading of the chart, its comparison with the 1970s Gold fractal, and the academic/economic grounding for why Bitcoin is "mathematically" bound to appreciate in value.
1. Technical Analysis of the Chart: "Rising Channel and Trend Theme"
The TradingView chart you shared (Weekly/Logarithmic) clearly illustrates Bitcoin's long-term secular bull market cycle.
Formation and Structure: An "Ascending Broadening Wedge" or an "Ascending Channel" structure is evident in the chart. This structure confirms that while volatility increases over time, the bottoms are consistently rising (Higher Lows).
Upper Resistance Line (Arrows): The line connecting the 2017 peak, the 2021 double peak, and the 2024-2025 projection. This area acts as an "overbought" zone where profit-taking occurs every time it is tested.
Lower Support Line (Numbers 1-2-3): This line is the backbone of the bull market.
Point 1 (2023): Bear market reversal and trend initiation.
Point 2 (Early 2024): Intermediate correction and confirmation.
Point 3 (Current): The region where the price is currently located. The chart indicates that the price is touching the channel support (trendline) and a purely technical upward reaction (green arrow) is expected from here.
Technical Deduction: In technical analysis literature, the trend is your friend. As long as the price holds at zone number 3, the technical target is the upper band of the channel, ranging between $140,000 - $180,000. However, if this support breaks, the formation is invalidated, and a deeper correction (bear trap or trend change) would be expected.
2. Historical Similarity: Gold (1970-1980) vs. Bitcoin
There are striking academic and structural similarities between Bitcoin's current structure and Gold's movement during the "Great Inflation Era" of 1970-1980.
The 1970s Gold Scenario:
1971 Nixon Shock: The US ended the convertibility of the dollar into gold (End of Bretton Woods). This initiated the era of fiat (unbacked) currency.
First Rally (1971-1974): Gold rose from $35 to $190 (~5x increase).
The Great Correction (1974-1976): Gold lost nearly 50% of its value, falling back to $100. (Investors claimed the "Gold bubble had burst").
Parabolic Rally (1976-1980): Gold went from $100 to $850, marking an ~8.5x increase.
Comparison with Bitcoin: Regions 2 and 3 on your chart strongly resemble that painful "shakeout" period of Gold in 1976.
At that time, Gold was being repriced as a "store of value" against high inflation and negative real interest rates.
Bitcoin is currently in the institutional acceptance phase (ETFs) as "Digital Gold."
If the 1970s fractal plays out; the current consolidation (sideways/downward process) is the final major stop before the "Parabolic Mania" phase.
3. Economic and Academic Basis: Why "Must" Bitcoin Rise?
This part of your question moves beyond technical analysis into Monetary Economics. Bitcoin gaining value against the dollar stems not just from Bitcoin's "miracle," but from the mathematical weakness of the Dollar (and other fiat currencies).
We can explain this using three academic concepts:
A. The Denominator Effect and M2 Money Supply
The price of an asset is measured as Asset / Currency (BTC/USD). If the denominator (USD) constantly expands, the price rises even if the numerator (BTC) remains constant.
As Milton Friedman stated: "Inflation is always and everywhere a monetary phenomenon."
Central banks (Fed) are forced to continuously print money (Quantitative Easing) to manage debt crises. An asset that is printed without limit (Dollar) is doomed to lose value against an asset with mathematically locked limits (21 Million Bitcoin).
Gold: Compared to the existing stock of gold on earth, the amount of new gold mined annually is low (High S2F ratio). This makes it valuable.
Bitcoin: Thanks to the halving mechanism, Bitcoin's inflation rate (new supply) is cut in half every 4 years.
Bitcoin is the only asset whose supply is perfectly inelastic (supply cannot be increased even if the price rises). If the price of gold goes up 10x, miners dig more and increase the supply. If Bitcoin goes up 100x, the number of Bitcoins produced is fixed by the algorithm. Economically, this is "Absolute Scarcity."
C. Gresham's Law and Thiers' Law
Gresham's Law: "Bad money drives out good." People spend the depreciating currency (Dollar/Fiat) and hoard the valuable one (Gold/BTC).
Thiers' Law: The inverse of Gresham's law; when a market collapses or during hyperinflation, "Good money drives out bad." People refuse to accept fiat currency and demand only "hard assets."
Bitcoin's long-term rise represents the global economy's painful transition from a fiat money system (arbitrarily printed paper) to a mathematics-based monetary system.
Conclusion and Summary
Point number 3 on your chart is a critical decision moment from both a technical and macroeconomic standpoint.
Technically: We are at the support of the long-term rising channel. In terms of risk/reward, this is a "buy" zone.
Historically: It resembles the "calm before the storm" period of Gold in 1976.
Economically: As long as global debt ratios and the necessity of money printing (Debasement) continue, Bitcoin gaining value against fiat currencies is not speculation, but a macroeconomic necessity.
------------------------------------------------------
1. Technical Analysis of the Chart:
"Rising Channel and Trend Theme"The TradingView chart you shared (Weekly/Logarithmic) clearly illustrates Bitcoin's long-term secular bull market cycle.Formation and Structure:An "Ascending Broadening Wedge" or an "Ascending Channel" structure is evident in the chart. This structure confirms that while volatility increases over time, the bottoms are consistently rising (Higher Lows).Upper Resistance Line (Arrows): The line connecting the 2017 peak, the 2021 double peak, and the 2024-2025 projection. This area acts as an "overbought" zone where profit-taking occurs every time it is tested.Lower Support Line (Numbers 1-2-3): This line is the backbone of the bull market.Point 1 (2023): Bear market reversal and trend initiation.Point 2 (Early 2024): Intermediate correction and confirmation.
Point 3 (Current): The region where the price is currently located. The chart indicates that the price is touching the channel support (trendline) and a purely technical upward reaction (green arrow) is expected from here.Technical Deduction:In technical analysis literature, the trend is your friend. As long as the price holds at zone number 3, the technical target is the upper band of the channel, ranging between $140,000 - $180,000. However, if this support breaks, the formation is invalidated, and a deeper correction would be expected.
2. Historical Similarity: Gold (1970-1980) vs. BitcoinThere are striking academic and structural similarities between Bitcoin's current structure and Gold's movement during the "Great Inflation Era" of 1970-1980.The 1970s Gold Scenario:1971 Nixon Shock: The US ended the convertibility of the dollar into gold. This initiated the era of fiat (unbacked) currency.First Rally (1971-1974): Gold rose from $35 to $190 (~5x increase).
The Great Correction (1974-1976): Gold lost nearly 50% of its value, falling back to $100. (Investors claimed the "Gold bubble had burst").Parabolic Rally (1976-1980): Gold went from $100 to $850, marking an ~8.5x increase.Comparison with
Bitcoin:Regions 2 and 3 on your chart strongly resemble that painful "shakeout" period of Gold in 1976.At that time, Gold was being repriced as a "store of value" against high inflation.Bitcoin is currently in the institutional acceptance phase (ETFs) as "Digital Gold."If the 1970s fractal plays out; the current consolidation is the final major stop before the "Parabolic Mania" phase.
3. Economic and Academic Basis: Why "Must" Bitcoin Rise?This part of your question moves beyond technical analysis into Monetary Economics and Network Theory. Bitcoin gaining value against the dollar stems not just from speculation, but from mathematical laws.We can explain this using three academic concepts:
A. The Denominator Effect and M2 Money SupplyThe price of an asset is measured as Asset / Currency (BTC/USD).If the denominator (USD) constantly expands due to monetary debasement, the price rises even if the numerator (BTC) remains constant.As Milton Friedman stated: "Inflation is always and everywhere a monetary phenomenon."Central banks are forced to print money to manage global debt. An asset printed without limit (Dollar) is mathematically bound to lose value against a finite asset.
B. The Bitcoin Power Law TheoryUnlike the Stock-to-Flow model (which relies on supply shocks), the Power Law model relies on Time and Network Growth.Scale Invariance: Much like the growth of cities, biological organisms, or planetary systems, Bitcoin's adoption follows a Power Law ($Price \propto Time^n$).The Predictable Corridor: When you plot Bitcoin’s price against time on a log-log scale, it forms a straight line. This indicates that price appreciation is not random but follows a physics-like trajectory of network adoption (Metcalfe’s Law).The "Fair Value" Floor: The Power Law mathematically establishes a rising "floor" price that Bitcoin has historically never breached for long. As time passes, the fair value must increase simply because the network is growing.
According to Power Law regression bands, the price at Point 3 is likely hugging the lower bound (the "buy" zone), suggesting the asset is mathematically undervalued relative to its time-based adoption curve.
C. Gresham's Law and Thiers' LawGresham's Law: "Bad money drives out good." People spend the depreciating currency (Fiat) and hoard the valuable one (Bitcoin).Thiers' Law: When a fiat system becomes unstable, "Good money drives out bad." People refuse to accept paper money and demand hard assets.Bitcoin's rise is the market's natural selection of a superior monetary technology.
Conclusion and Summary Point number 3 on your chart is a critical decision moment:
Technically: We are at the support of the long-term rising channel.
Historically: It resembles the 1976 Gold "shakeout" before the parabolic run.Mathematically: According to the Power Law, the asset is likely resting on its adoption trendline floor, making the upward movement a function of time and network physics rather than just market sentiment.
ALSO CHECK
GOLD vs BITCOIN

BITCOIN This is the 4H Golden Cross that Bulls need at all costsBitcoin (BTCUSD) has been on a slow rebound following the 1W MA100 (red trend-line) test and is close to forming a 4H Golden Cross for the first time in more than 2 months.
However a similar rebound attempt in December 2021, at the start of the BTC's previous Bear Cycle, after also dropping by -39.50% from the top (against today's -36.20%), failed to form a 4H Golden Cross the 'last minute' and the market resumed the bearish trend towards a new Low, completing a -50.34% total decline.
So far the 1D RSI is similar to December 2021 but there is one key difference. Now Bitcoin has already tested its 1W MA100 (and rebounding) while on the previous Bear Cycle it only came close to it in February 2022. So will that favor and support the market for a little while and make that 4H Golden Cross or the 1D RSI and -36.20% identical drop fractal will push it lower? In the first case, the market will look for a 1D MA200 (black trend-line) test around $105k, which is what happened in March 2022, while in the second for a -47.30% total drop around $67000.
One thing is for sure, if Bulls want to see some relief for some time, they have to defend that 4H Golden Cross.
Which scenario do you think will prevail? Feel free to let us know in the comments section below!
---
** Please LIKE 👍, FOLLOW ✅, SHARE 🙌 and COMMENT ✍ if you enjoy this idea! Also share your ideas and charts in the comments section below! This is best way to keep it relevant, support us, keep the content here free and allow the idea to reach as many people as possible. **
---
💸💸💸💸💸💸
👇 👇 👇 👇 👇 👇

BTC SHOWS WEAKNESSMorning folks,
Although BTC started well from 90K support area, mentioned last time, it has not reached 96.4K target, although tried to do it two times. Fed has not helped too much yesterday, and now obviously BTC shows signs of weakness.
If it goes bad way, we consider re-testing of 78-80K lows. But it is a bit early to talk about it. For now - let's just stay aside from any new longs and see what will happen.

Today’s Market Rhythm Is All About Precision Entries1. Market Volatility
Gold continues to move in a clean “adjustment rhythm,” reflecting an intraday environment where price is fluctuating inside a bearish structure but still producing technical pullbacks.
Volatility isn’t explosive but it’s precisely enough to create high-accuracy entry zones for intraday traders.
2. Trader Psychology
This is the phase where traders often get trapped by small pullbacks or emotional entries.
But those who understand the money flow can clearly see that price is simply cycling liquidity and adjusting before the next move.
Discipline beats emotion especially in timing-based trading.
3. Key Drivers / Market Reasoning
Market structure maintains:
-A slightly bearish overall trend
-Pullbacks acting as liquidity grabs, not true reversals
-Strong liquidity concentration around 4150–4160
-A clear institutional reaction zone at 4237–4240
Based on current flow, both intraday setups perfectly align with the market’s liquidity map.
4. Trading Strategy
📌 SETUP 1: Timing SELL Zone
XAUUSD SELL ZONE: 4237 – 4240
TP: 4234 – 4229
SL: 4244
➡️ This is a trend-following setup.
4237–4240 acts as a liquidity pocket where price tends to sweep before continuing downward.
The previous A–B–C wave structure supports this downward continuation.
📌 SETUP 2: Timing BUY Zone
XAUUSD BUY ZONE: 4147 – 4150
TP: 4153 – 4158
SL: 4143
➡️ This is a counter-trend setup but perfectly aligned with liquidity behavior.
4147–4150 is a key reaction zone a short-term liquidity base where buyers actively step in.
⚠️ Capital management is essential for both setups to maximize efficiency and protect your account.
5. Trend & Price Outlook
Gold is moving within an intraday correction structure, but the broader bias still leans bearish.
Today’s two timing zones highlight the highest-probability opportunities:
SELL 4237–4240: the ideal rejection area
BUY 4147–4150: short-term corrective demand zone
The previous A–B–C model remains valid, showing that price is completing its adjustment phase before seeking liquidity.
If you follow the rhythm you’ll always be a step ahead of the market.
When timing aligns with structure, intraday trading becomes effortless

Gold Just Flipped Structure.....The market just transitioned from a bearish sequence into early bullish structure. Most traders will miss this shift but if you understand BOS, ChoCH, and liquidity behaviour, this is where smart money prepares for the next leg up.
1. Market Structure Overview
Your chart shows a full bearish sequence (LH–LL) that has recently transitioned:
-Multiple Lower Highs (LH) and Lower Lows (LL) → clear bearish structure.
-A Change of Character (ChoCH) occurs at the key zone → first signal of reversal.
-A clean Break of Structure (BOS) to the upside confirms buyers stepping in.
-Price then creates a Higher Low (HL) followed by Higher Highs (HH) → early bullish trend established.
This is a textbook reversal from bearish → bullish.
2. Key Zones Identified
Support Zone (Demand)
Located around 4195 – 4174
→ This is where the ChoCH and HL formed, confirming buyer strength.
Resistance Zone (Supply)
Located around 4219 – 4229
→ Price is currently approaching this zone. If it breaks, bullish continuation is expected.
3. Price Behaviour & Expectation
Your yellow projection is correct:
- Price may pull back into the minor support (near current level).
- After that, a bullish leg toward 4219 zone is expected.
- If BOS occurs above 4229, price has room to expand toward new highs around 4238–4244.
This aligns perfectly with the HH → HL structure forming now.
4. Trading Logic
Why bullish?
- Clear BOS on bullish side
- Higher Low forming above support
- Liquidity taken from previous LL
- Price respecting the new bullish structure
Invalidation
If price breaks below 4174, bullish structure is invalidated.
5. Trade Signal
This follows your trading style — structure-based, clean, and logical.
📌 BUY ENTRY: 4203 – 4207
(Retesting minor support + inside new bullish structure)
📌 STOP LOSS: 4178
(Below HL and below ChoCH zone — strong invalidation)
📌 TAKE PROFIT 1: 4219
(Retest of resistance zone)
📌 TAKE PROFIT 2 (Main Target): 4229 – 4233
📌 TAKE PROFIT 3 (Extended Target): 4242 – 4244
Risk–Reward:
1 : 2.5 up to 1 : 4 depending on TP

BITCOIN → False breakout of resistance on a downtrend BINANCE:BTCUSDT is consolidating in the range of 86K - 92K, bears are holding resistance amid a global downtrend, traders lack drivers...
Fundamentally, sentiment in the crypto market is weak, and there is increasing talk of a crypto winter, especially among companies that previously actively bought cryptocurrencies for their balance sheets. There is no bullish driver at the moment.
Bitcoin is in a neutral state, with the market holding the price below 93K. The fundamental background is unstable, and technically, the market is in a downtrend. A reversal pattern is forming relative to 92K, and a retest and false breakout of the zone of interest could trigger a decline to the support range.
Locally, we are seeing an upward channel, but this is a correction against the backdrop of the global trend. If the bears keep the price below 92K, the decline may continue. However, a breakout of 94K and a close above that level could trigger an upward momentum...
Resistance levels: 91850, 92700, 93700
Support levels: 88000, 86300
A false breakout and price consolidation in the short zone could cause further sell-offs towards the areas of interest located at the bottom of the trading range.
Best regards, R. Linda!

XAGUSD BUY SETP📌 Trade Plan (Short & Professional)
🟢 Entry
Buy after bullish confirmation inside:
61.40–61.20 mitigation zone, or
60.70–60.50 main demand zone (preferred after liquidity sweep)
🛑 Stop Loss
Below the demand zone: 59.95–60.00
🎯 Take Profit
Target the next liquidity zone / recent highs:
62.80–63.40
📈 Reason for Entry
Market shows a bullish BOS
Price is retracing to fill imbalance + mitigate demand
Expecting a liquidity sweep, then bullish continuation

BTCUSDT.P - December 11, 2025Price has broken down from a prior intraday range and is now staging a modest rebound off support around 89,300–89,400, with the main downside risk defined by the lower stop area near 87,900–88,000. The short-term trend and momentum remain bearish while below the former breakdown zone and resistance toward 91,800–92,000, where the breakeven and profit target region is marked. A failure to reclaim that resistance and renewed selling from current levels would keep the focus on a retest of the 88,000 area, while a stronger recovery through 92,000 would suggest a deeper corrective bounce toward the prior swing highs.

ETH: Price Slice. Capital Sector. 3521.89🏷 ETH: Price Slice. Capital Sector. Dated: 11.12.2025
🏷 3521.89 — Price not yet reached at time of publication
🏷 BPC — The Bolzen Price Covenant 5
🏷 Screenshot
🏷 Interactive Reference Guide: BPC — The Bolzen Price Covenant
🏷 P.S. English is not my native language — I offer no apologies for stylistic imperfections. What you see here is not a post. It is a demonstration of another level of preparation: the symbiosis of human intuition and algorithmic precision. Mathematics and aggressive market analysis — against the machine of liquidations.
The Architect
BPC — The Bolzen Price Covenant

ETH: Price Slice. Capital Sector. 2912.19🏷 ETH: Price Slice. Capital Sector. Dated: 11.12.2025
🏷 2912.19 — Price not yet reached at time of publication
🏷 BPC — The Bolzen Price Covenant 8
🏷 Screenshot
🏷 Interactive Reference Guide: BPC — The Bolzen Price Covenant
🏷 P.S. English is not my native language — I offer no apologies for stylistic imperfections. What you see here is not a post. It is a demonstration of another level of preparation: the symbiosis of human intuition and algorithmic precision. Mathematics and aggressive market analysis — against the machine of liquidations.
The Architect
BPC — The Bolzen Price Covenant

ETH: Price Slice. Capital Sector. 2608,60🏷 ETH: Price Slice. Capital Sector. Dated: 11.12.2025
🏷 2608,60 — Price not yet reached at time of publication
🏷 BPC — The Bolzen Price Covenant 9
🏷 Screenshot
🏷 Interactive Reference Guide: BPC — The Bolzen Price Covenant
🏷 P.S. English is not my native language — I offer no apologies for stylistic imperfections. What you see here is not a post. It is a demonstration of another level of preparation: the symbiosis of human intuition and algorithmic precision. Mathematics and aggressive market analysis — against the machine of liquidations.
The Architect
BPC — The Bolzen Price Covenant

BTC/USDT - Major Rejection from Supply Zone📝 Description 🔹 Setup Overview WHITEBIT:BTCUSDT
BTC/USDT has faced a strong rejection from the upper resistance / supply zone near the recent highs. Price has broken below the rising trendline, signaling a shift in short-term market structure from bullish to bearish. Failure to reclaim the trendline keeps sellers in control.
📌 Trading Plan📉 Bearish Scenario (Primary Bias )
Sell Zone: Below the broken trendline & previous support
Target 1: 89,030 (1st Support)
Target 2: 87,520 (2nd Support – liquidity area)
Confirmation: Weak bullish candles + rejection from trendline retest
#BTCUSDT #BitcoinAnalysis #CryptoTrading #BTC #PriceAction #TechnicalAnalysis #CryptoMarket #TrendlineBreak #TradingView #Kabhi_TA_Trading #SellBTC
⚠️ Disclaimer
This analysis is for educational purposes only.
Crypto markets are highly volatile — always manage risk and use stop-losses.
👍 Support the Analysis❤️ LIKE if this helped💬 COMMENT your BTC view
🔁 SHARE with fellow traders
Your support keeps the analysis coming! 🙏

$BTC -Ropium-Copium!Heya! Just a quick CRYPTOCAP:BTC update, traders!
FOMC turned out to be a nothing-burger, and 94.5k (yearlyOpen) is proving to be a trouble zone. We didn’t have enough strength to break through, and if we can’t reclaim 92k soon, a retest of the 84–82k base is still pretty likely since we still need to sweep or tap that area at some point.

The Breakout Is Closer Than You Think…NZD/USD – 1H MARKET STRUCTURE ANALYSIS
1) Current Price Structure
- Market is in a clean uptrend (higher highs & higher lows on the left side of chart).
- After the impulsive bullish leg, price has shifted into a sideways range, forming a clear consolidation between Support and Resistance.
- Micro-structure inside the range shows repeated equal highs & equal lows → compression before expansion.
2) Liquidity & Key Zones
- Resistance Zone (Top of Range): 0.5785 – 0.5805
- Multiple rejections → liquidity resting above (buy stops & breakout traps).
- Support Zone (Bottom of Range): 0.5750 – 0.5765
Consistently defended by buyers → liquidity sitting below (sell stops).
Liquidity Note:
Expect a sweep of support (fake break) before a bullish continuation — classic smart money behavior in a bullish market.
3) Today’s Market Scenario
Main Scenario (Bullish Bias – Preferred):
- Price retests the support zone
- Likely performs a liquidity sweep below the zone
- Sharp bullish rejection
- Price rotates back to resistance
- Breaks out → continuation with uptrend alignment
This matches your projected red zig-zag + final bullish impulse.
Alternative Scenario (Low Probability):
- Clear candle close below 0.5740 with no recovery → shift to bearish intraday bias.
4) Market Psychology
- The market is "resting" after a strong push → accumulation psychology.
- Smart money wants liquidity → they will likely sweep below the support to fill buy orders.
- Retail traders try to sell the range highs and buy the lows, but SM often collects their stops before moving to the real direction.
Key idea:
Range = where weak hands lose money.
Breakout = where strong hands take profits
5) Intraday Strategy (Entry – SL – TP)
BUY Setup (Aligned With Your Chart):
Entry: 0.5755 – 0.5765
Stop Loss: 0.5740 (below liquidity pocket)
TP1: 0.5795
TP2: 0.5820
TP3 (Extended): 0.5840+
Trade Management:
If price sweeps support and closes back above → BUY confirmation.
If price closes below → invalidate bullish setup and reassess.

Bitcoin is in a downtrend and Ascending wedgeBitcoin is in a clear downtrend and below key moving averages like 20 WEMA, 34WEMA and below EMA ribbon and below previous low which is 98k. Now it is forming and ascending wedge pattern on 4H time frame which is very bearish. Fundamentally DATs are cooked, No ETF inflows (Mainly outflows), Whales still selling, Gold took the crown of hedge for money printing and with tokenized gold it becomes clear bitcoins narrative has being proven wrong. Until people accept bitcoin as a proper hedge downtrend will continue. Probably can buy bitcoin once Strategy start selling.
